| Edited by Eiichi Ohtsubo. Shigeru Iida: Corresponding author. E-mail: shigiida@nibb.ac.jp |
Considerable attention has recently been given to gene tagging in rice (Oryza sativa) as a functional genomic tool for elucidating the function of rice genes (Hirochika et al., 2004; Leung and An, 2004; Upadhyaya, 2007) since the complete sequencing of the 389-Mb rice genome had been achieved (International Rice Genome Sequencing Project, 2005). In addition to foreign elements, such as T-DNA or maize DNA transposons, the endogenous retrotransposon Tos17 has been systematically employed for the tagging of rice genes (Hirochika et al., 2004; Leung and An, 2004). A possible shortcoming of these gene-tagging systems in rice is to require tissue culture processes for either the introduction of the foreign elements into the rice genome (An et al., 2005) or the activation of the dormant Tos17 element on the genome (Hirochika et al., 1996), in which the concomitant occurrence of somaclonal variation associated with the tissue culture is inevitable (Larkin and Scowcroft, 1981; Kaeppler et al., 2000). Indeed, the tagging efficiency of Tos17 was reported to be very low due to the high occurrence of somaclonal variation (Kumar and Hirochika, 2001). While endogenous DNA transposons have extensively been utilized for gene tagging in maize, snapdragon, petunia, and morning glories (May and Martienssen, 2003; Chopra et al., 2006), two active endogenous DNA transposons, mPing and nDart, in rice have been identified only recently. The 0.43-kb element mPing of the MITE (Miniature Inverted-repeat Transposable Element) family was shown to actively transpose in rice cell cultures (Jiang et al., 2003), in plants regenerated from anther-derived calli (Kikuchi et al., 2003), in γ-ray-irradiated rice plants (Nakazaki et al., 2003), or in plants from seeds treated with high hydrostatic pressure (Lin et al., 2006). In addition, mPing and its related element Pong were recently shown to transpose in recombinant inbred lines, which were derived from hybridization between cultivar rice (O. sativa) and wild rice (Zizania latifolia) (Shan et al., 2005), suggesting that they may also be mobile in rice plants under certain natural growth conditions. The 0.6-kb nonautonomous element nDart in the hAT family was found as a causative transposon of a mutable virescent allele pyl-v conferring pale yellow leaves with dark green sectors in its seedlings, and its transposition could be induced by crossing with a line containing the autonomous element aDart and stabilized by segregating aDart under natural growth conditions (Maekawa et al., 1999; Tsugane et al., 2006). No somaclonal variation should occur in the transposon tagging system with nDart because no tissue culture was involved in nDart activation. Furthermore, we were able to identify several mutable alleles caused by the insertion of nDart, and one of them, thumbelina-mutable, which confers the mutable gibberellin-insensitive dwarf phenotype, was found to be a new allele of the GIBBELLERIN INSENSITIVE DWARF1 (GID1) gene encoding a soluble gibberellin receptor (Ueguchi-Tanaka et al., 2005; Tsugane et al., 2006), indicating that our nDart-promoted gene tagging system is effective.
The Japonica rice genome of Nipponbare was found to contain 18 copies of the nDart-related sequences of 0.6 kb and approximately 60 copies of other nDart-related elements longer than 2 kb, some of which encode a putative transposase (Tsugane et al., 2006); it was also reported to carry about 70 copies of 0.43-kb mPing and longer putative autonomous elements, one copy of 5.3-kb Ping, and at least five copies of 5.2-kb Pong (Jiang et al., 2003; Kikuchi et al., 2003). As an initial step to develop an effective transposon tagging system using nDart in rice, we tried to visualize nDart and nDart-related elements in the Nipponbare genome using a transposon display (TD) method, which is an amplified fragment length polymorphism (AFLP)-based technique to visualize multiple transposons by amplifying their flanking sequences (Fig. 1; Vos et al., 1995; Frey et al., 1998; Van den Broeck et al., 1998; Maes et al., 1999; Yephremov and Saedler, 2000; Fukada-Tanaka et al., 2001; Takagi et al., 2003; Le and Bureau, 2004). Since the 389-Mb rice genome sequence is available (International Rice Genome Sequencing Project, 2005), we compared the observed bands with the anticipated virtual bands by TD based upon the genome sequence. We also compared the visualization of nDart-related elements with that of mPing in the Nipponbare genome because both nDart and mPing are active DNA transposons in rice but their characteristic features are quite different from each other; nDart is more GC-rich than mPing, and the subterminal repeats of nDart-related elements are more heterogeneous than those of mPing-related elements (Fig. 2; Jiang et al., 2003; Kikuchi et al., 2003; Nakazaki et al., 2003; Tsugane et al., 2006). Because TD may encounter difficulties to amplify certain PCR fragments due to structural features of the fragments to be amplified, e.g., secondary structures, AT or GC richness, and/or characteristic terminal and subterminal repeats of the transposons in question, comparison of the observed TD patterns with the anticipated virtual patterns based on the known genome sequence is useful for improving the TD protocol by optimizing the PCR amplification conditions as well as for assessing the reliability and quality of the obtained data (Le and Bureau, 2004). The transposon displays for nDart- and mPing-related elements are called Dart-TD and Ping-TD, respectively. While all mPing-related elements were found to be easily visualized without specific optimization, it was rather difficult to visualize all of the nDart-related elements, probably due to the GC richness of the elements and their flanking regions. Indeed, only two enzymes, MseI and TaqI, were sufficient to visualize all mPing-related elements, whereas we employed four restriction enzymes, MseI, TaqI, CviAII, and MspI, to visualize nDart-related elements. A preliminary account of Dart-TD using the MseI and MspI enzymes was reported previously (Tsugane et al., 2006). We have finally established a protocol for Dart-TD with these four restriction enzymes that enable us to visualize all of the 0.6-kb nDart elements and over 80% of longer nDart-related elements. This is an essential and important step for the utilization of nDart elements as a new gene-tagging system for functional genomics in rice.
The nDart- and mPing-related elements in Nipponbare were searched by BLASTn analysis using representative elements of each subgroup as a query to the latest 4.0 pseudomolecules in the IRGSP sequence database (http://rgp.dna.affrc.go.jp/E/IRGSP/Build4/build4). Published BAC or PAC sequences including detected elements were retrieved, and sequences of the transposons and their flanking 1.0-kb sequences were extracted and aligned with the elements. Bioinformatic sequence analyses were carried out using EMBOSS, stand-alone version 3.0 (http://emboss.sourceforge.net). The strategy of transposon display (TD) is outlined in Fig. 1. In order to visualize the bands generated by TD efficiently in a range of approximately 60 to 600 bp by polyacrylamide gel electrophoreses, we chose four restriction enzymes with 4-bp recognition sequences, MseI (TTAA), TaqI (TCGA), CviAII (CATG), and MspI (CCGG), in Dart-TD and two enzymes MseI and TaqI in Ping-TD. To predict the TD patterns, the nearest restriction enzyme sites for MseI, TaqI, CviAII, and MspI from each element were identified from the published sequences, and a selective nucleotide for the nested selective PCR amplification was determined in each element (Fig. 1). To calculate the anticipated fragment sizes in TD analysis, the lengths of the primers chosen and the terminal sequence of the element to be amplified in the nested PCR amplification were added to the distance between the element and the nearest restriction enzyme sites.
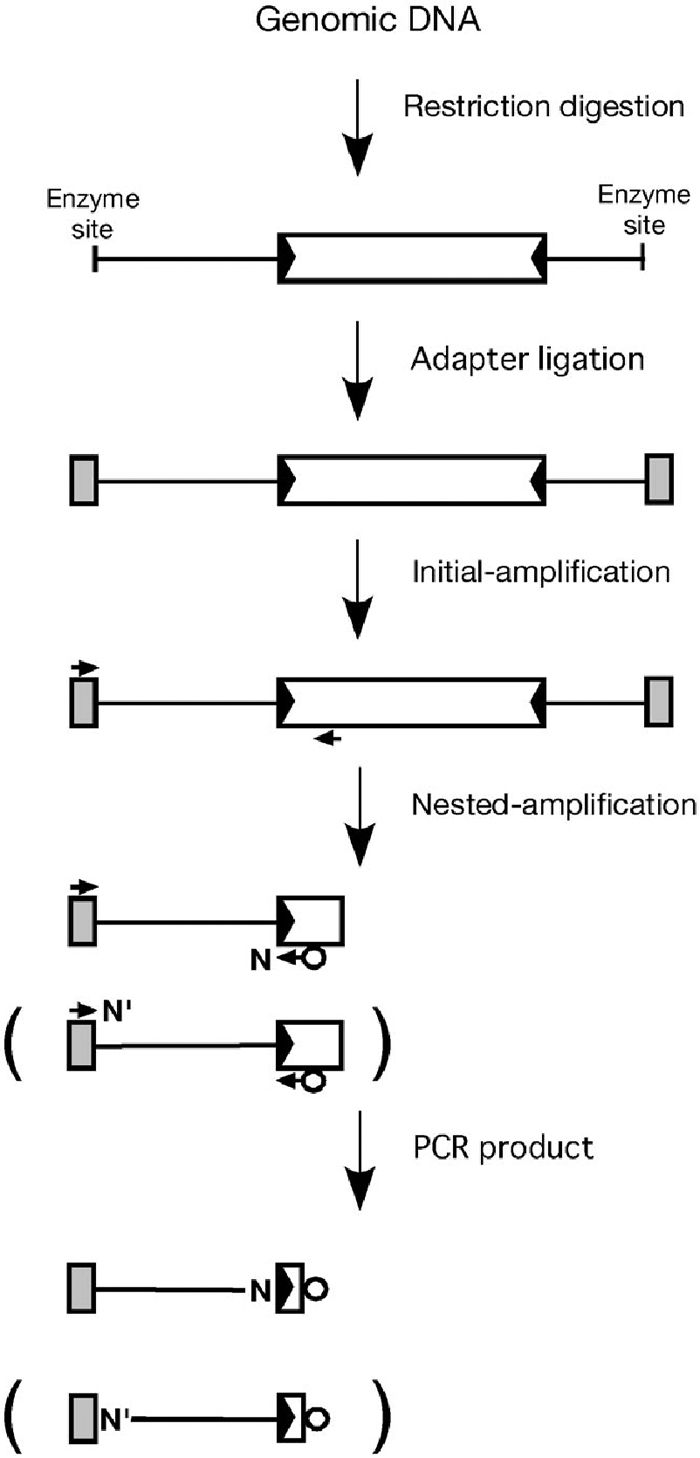 View Details | Fig. 1. Schematic representation of a transposon display (TD) procedure. A transposable element (TE) and its terminal inverted repeats (TIRs) are indicated by an open box and black arrowheads, respectively. The shaded boxes indicate adapters ligated to the restriction enzyme cleaved sites. The adapter- and transposon-primers are indicated by horizontal arrows above the adapter box and under the TE rectangles, respectively. The open circles and N (or N’) represent fluorescent label and a selective nucleotide used in nested selective PCR amplification, respectively. As Table 1 shows, a selective nucleotide was used for adding to the 3’-end of the primers Dart5’-1,2,3-2nd/N in Dart-TD, whereas that was used for the 3’-end of the adapter-primers MseI-2nd/N’ or TaqI-2nd/N’ in Ping-TD, as illustrated in parentheses. |
Since the nDart-related transposons in Nipponbare comprise various subgroup elements with different internal sequences, we can design specific primers that allow us to visualize certain subgroup elements in Dart-TD (Fig. 2a, Table 1). For example, the transposon-primer Dart5’-1-1st was designed to visualize the nDart1-3 subgroup elements and iDart1-51, while the transposon-primer Dart5’-2-1st was to visualize the elements belonging to the nDart1-101 and iDart1/dDart1 (except for iDart1-52 and iDart1-53) subgroups. Because all of the nDart1-101 subgroup and 38 iDart1/dDart1 elements carry a TaqI cleavage site between their 5’-termini and their internal sequence hybridizable with the primer Dart5’-2-1st, they will not be visualized when TaqI is used (Fig. 3a, Table 2a). The transposon-primer Dart5’-3a-1st was designed to visualize the nDart1 and iDart1/dDart1 elements, except for iDart1-52 and iDart1-53, in the MseI-, TaqI-, and CviAII-cleaved samples because it can hybridize to the junction sequence between their common terminal inverted repeats (TIRs) and the left subterminal region. Since these elements carry an MspI cleavage site within their 5’-subterminal regions adjacent to their TIRs, the transposon-primer Dart5’-3b-1st is designed to visualize them in order to hybridize the sequence generated by ligation of the MspI-cleaved TIR with the MspI adapter. Apart from these nDart1 and iDart1/dDart1 elements with Dart5’-3b-1st, no nDart-related transposons can be visualized with other primers used when MspI is employed because all of them bear MspI cleavage sites within their 5’-subterminal regions.
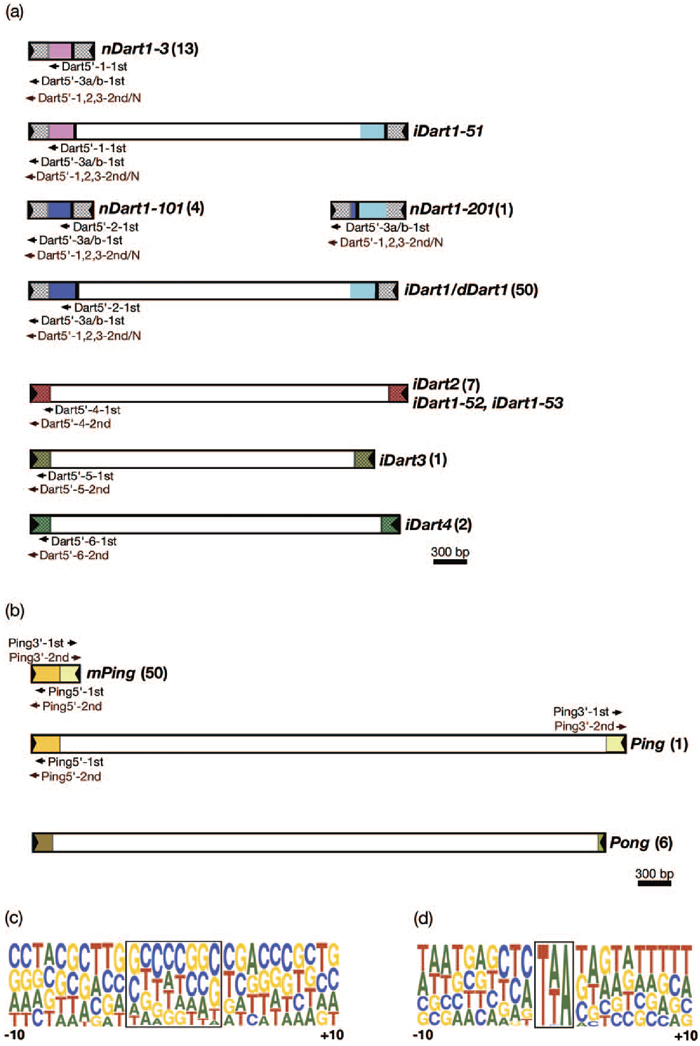 View Details | Fig. 2. Structures of nDart- and mPing-related elements and their target site duplication (TSD) sequences in Nipponbare. (a) nDart-related elements. (b) mPing-related elements. Only typical structures in each representative element are shown, and the numerals in parentheses indicate the copy numbers of a given group of elements. The arrowheads and the shaded boxes at both ends indicate the TIRs and left and right subterminal regions (LSRs and RSRs), respectively, and the same colored regions show highly homologous segments (Jiang et al., 2003; Kikuchi et al., 2003; Tsugane et al., 2006). The position and direction of transposon-primers for initial and nested PCR amplifications are indicated by horizontal arrows under the transposon boxes (above the transposon boxes for Ping3’). (c) TSDs and their flanking sequences of nDart-related elements (n = 81). (d) TSDs and their flanking sequences of mPing-related elements (n = 57). In the pictograms (http://weblogo.berkeley.edu), nucleotide A is shown in green, C in blue, G in yellow, and T in red. The TSD sequences are enclosed, and the numbers –10 and +10 indicate the position of nucleotides 10 bp upstream and downstream from TSDs, respectively. The height of each nucleotide represents the relative frequency of that nucleotide at the position. |
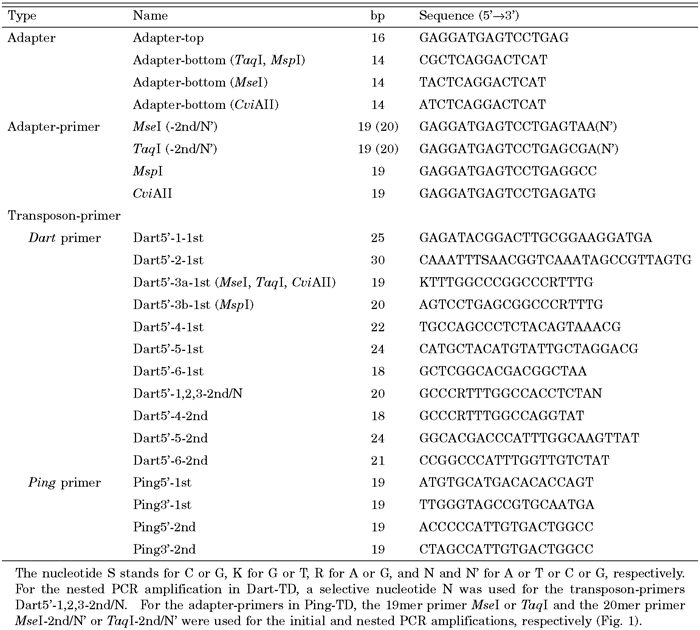 View Details | Table1. Primer and adapter sequences used |
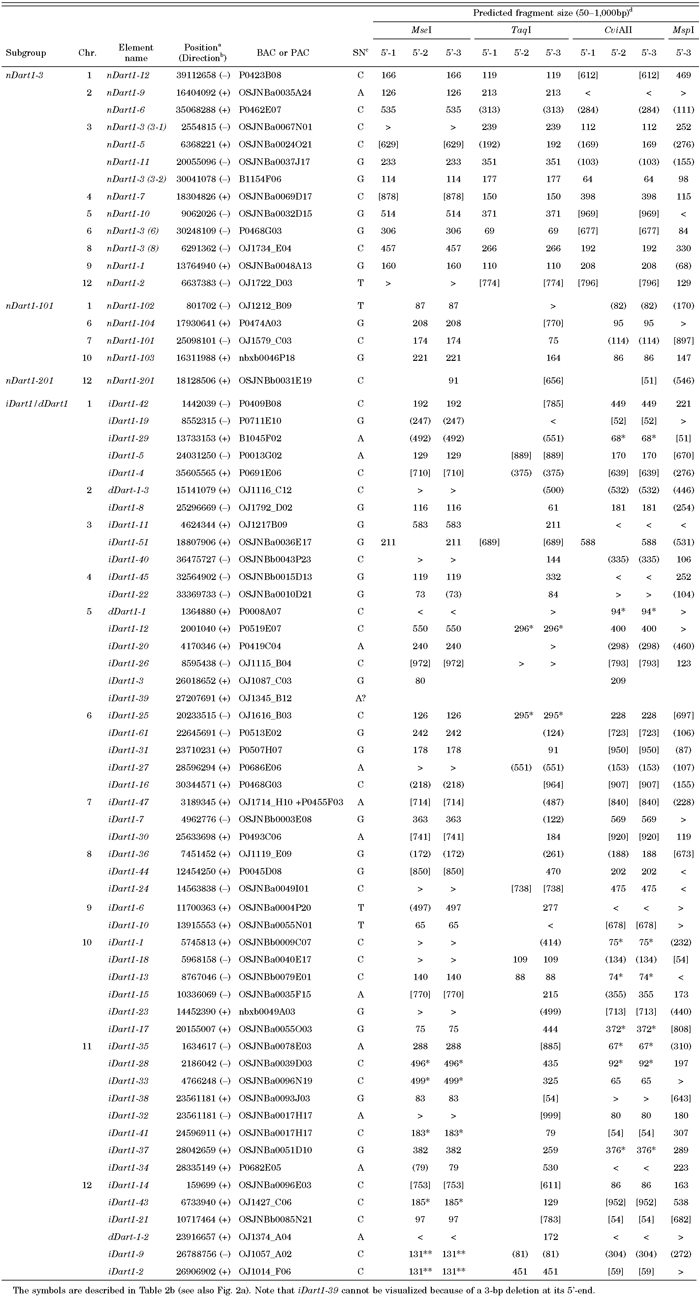 View Details | Table 2a. Visualization of nDart1- and iDart1/dDart1-subgroup elements except for iDart1-52 and iDart1-53 in Nipponbare |
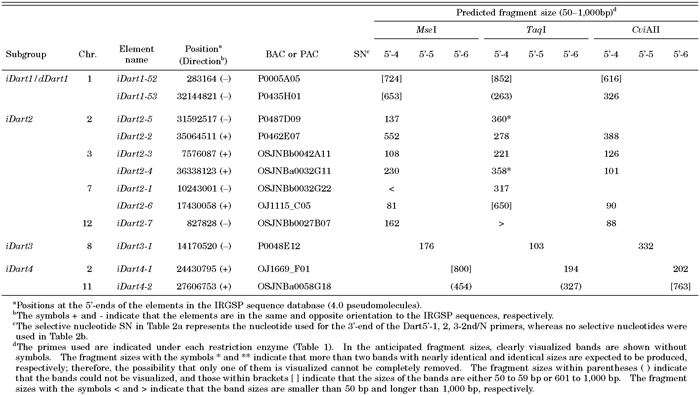 View Details | Table 2b. Visualization of iDart2-, iDart3-, and iDart4-subgroup elements including iDart1-52 and iDart1-53 in Nipponbare |
For subsequent nested PCR amplification to visualize these nDart1 and iDart1/dDart1 elements, the transposon-primers Dart5’-1,2,3-2nd/N were employed (Table 1); in this case, a selective nucleotide N was used for the 3’-end of the primers in order to reduce the number of bands generated. Note that iDart1-39 cannot be visualized in any enzyme used because of a 3-bp deletion at its 5’-terminus, which corresponds to the 3’-end of the primers Dart5’-1,2,3-2nd/N (Table 2a). Likewise, no amplified band from iDart1-3 can be seen, due to a 14-bp deletion, when the primers Dart5’-3a/b-1st are used.
The transposon-primer Dart5’-4-1st was used to visualize the iDart2 subgroup elements, including iDart1-52 and iDart1-53, whereas Dart5’-5-1st and Dart5’-6-1st were employed for the iDart3 and iDart4 subgroups, respectively (Fig. 2a, Table 1). However, we cannot visualize 2 out of 7 iDart2 elements with CviAII because they bear a CviAII cleavage site within their subterminal regions proximal to their 5’-termini (Table 2b). For subsequent nested PCR amplification, individual primers with no selective nucleotide were used for these elements.
For the mPing-related elements in Ping-TD, we planned to employ two transposon-primers, Ping5’-1st and Ping3’-1st, which are hybridizable to the 5’- and 3’-ends of mPing or Ping, and the transposon-primers Ping5’-2nd and Ping3’-2nd were employed for subsequent nested PCR amplification (Fig. 2b, Table 1). By comparing the anticipated virtual bands of the elements based on the known sequence in the 4.0 pseudomolecules with the observed bands in both Dart-TD and Ping-TD, we have improved our TD protocol by optimizing the PCR amplification conditions described below.
Both Dart-TD and Ping-TD were carried out according to the procedure of Fukada-Tanaka et al. (2001) with the following modifications. Genomic DNA (1 μg) was cleaved with appropriate restriction enzymes and ligated to an appropriate adapter (88 pmol). The initial amplification was performed in a 20 μl reaction mixture containing adapter-ligated DNA (8 ng) and an appropriate set of adapter- and transposon-primers (4.8 pmol each) for 20 cycles of denaturation (94°C for 30 sec), annealing (48°C or 50°C for 1 min in Dart-TD or 56°C for 1 min in Ping-TD), and extension (72°C for 1 min). For the subsequent nested amplification, we used 5’-Rhodamine-labeled transposon-primers (2.4 pmol). A selective nucleotide was used for adding to the 3’-end of the transposon-primers Dart5’-1,2,3-2nd/N in Dart-TD or for the 3’-end of appropriate adapter-primers in Ping-TD (Table 1). The PCR amplification was performed according to a touchdown protocol using 2 μl of a 10-fold initial amplification sample as a template; it consisted of 13 cycles of denaturation (94°C for 30 sec), annealing (57°C or 59°C for 30 sec in Dart-TD or 65°C for 30 sec in Ping-TD), and extension (72°C for 1 min) followed by a reduction of the annealing temperature in a 0.7°C decrement per cycle and then 20 cycles at the annealing temperature (48°C or 50°C for 30 sec in Dart-TD or 56°C for 30 sec in Ping-TD). In PCR amplification, Advantage-GC2 Polymerase Mix (Clontech) and Ex-Taq (TAKARA) were used as a Taq polymerase in Dart-TD and Ping-TD, respectively. The reaction products were concentrated by ethanol precipitation and electrophoresed with a 60–600 bp size marker (Internal lane standard 600, Promega) on a 5% denaturing polyacrylamide gel (Fig. 3). The bands were detected using FMBIO II Multi-view (Hitachi Software Engineering). We primarily compared the anticipated virtual bands in size with the observed bands in TD, in order to assess the reliability and quality of the data obtained.
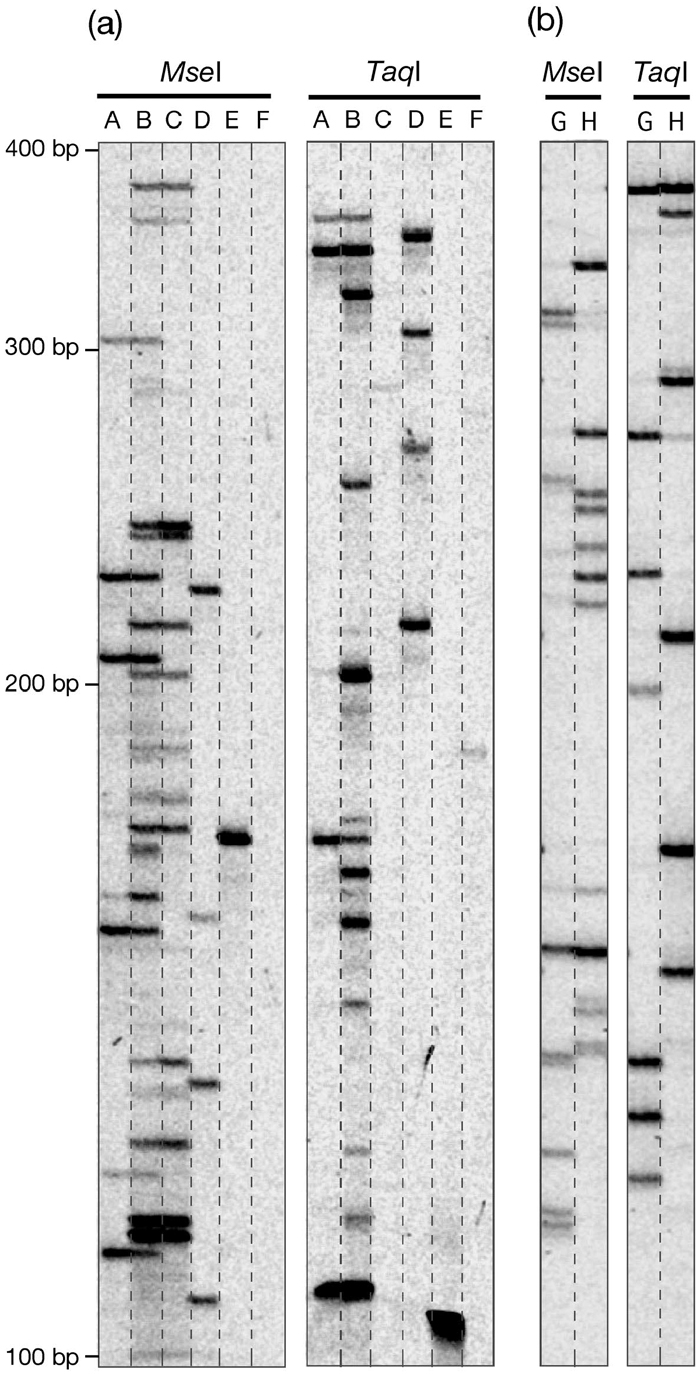 View Details | Fig. 3. Typical examples of observed bands in TD. (a) nDart-related elements. (b) mPing-related elements. The transposon-primers used in the initial PCR amplification are lane A, Dart5’-1-1st; lane B, Dart5’-3a-1st; lane C, Dart5’-2-1st; lane D, Dart5’-4-1st; lane E, Dart5’-5-1st; lane F, Dart5’-6-1st; lane G, Ping5’-1st; lane H, Ping3’-1st (Fig. 2, Table 1). For the nested amplification, the selective nucleotide G was used for adding to the transposon-primers Dart5’-1-2nd/N, Dart5’-3-2nd/N, and Dart5’-2-2nd/N in lanes A, B, and C, respectively, whereas the selective nucleotide T was used for the adapter-primers MseI-2nd/N’ and TaqI-2nd/N’ in lanes G and H, respectively (Fig. 1, Table 1). Special care was taken to examine whether a weak band appeared is reproducible or not. Note that the anticipated band of 454 bp from iDart4-2 was not detectable in MseI-treated lane F, whereas no bands appeared in TaqI-treated lane C, as expected (Table 2). For details, see text. |
While the structures of nDart-related elements and their localization in the Nipponbare genome were analyzed previously with 3.0 pseudomolecules in the IRGSP sequence database (Tsugane et al., 2006), in this study, we searched the nDart- and mPing-related elements in the Nipponbare genome with the latest 4.0 pseudomolecules, and the results are compiled in Table 2 and Table 3, respectively. The nDart-related elements can be classified into three subgroups of about 0.6-kb nonautonomous elements (nDart1-3, nDart1-101, and nDart1-201) and four subgroups of elements longer than 2 kb (iDart1/dDart1, iDart2, iDart3, and iDart4) on the basis of their lengths and sequence characteristics (Fig. 2a; Tsugane et al., 2006). Newly obtained results showed that the three previously reported iDart1 elements, iDart1-44, iDart1-46, and iDart1-48, on chromosome 8 were found to be the same element, designated here as iDart1-44, and that the two elements, iDart1-31 and iDart1-62, on chromosome 6 were shown to be the same sequence represented by iDart1-31 (Table 2a). Thus, the copy numbers of the small nDart1 elements of about 0.6 kb and longer iDart/dDart elements are 18 and 63, respectively, and both elements are distributed throughout the Nipponbare chromosomes. Since the subterminal sequences of iDart1-52 and iDart1-53 are closely related to those of the iDart2 subgroup elements, we treated them as though they comprised single-subgroup elements for TD analysis (Fig. 2a). One of the characteristic features of the nDart-related elements is that they are highly GC-rich; the average GC content of the 0.6-kb nDart1 elements is 70%, whereas the GC contents of the terminal sequences of about 250 bp of the longer iDart/dDart elements in different subgroups are within a range of 64–79%. Most of the nDart-related elements are flanked by apparent target site duplications (TSDs) of 8 bp, whose average GC content is 64%, and approximately three quarters of the termini in the 8-bp TSD sequences are either nucleotide G or C (Fig. 2c). Moreover, the nDart-related elements appear to reside in the higher GC-rich regions (48% in the 0.5-kb flanking regions) than the whole rice genome sequence (44%; see International Rice Genome Sequencing Project, 2005). Interestingly, the nDart-related elements tend to reside at the border of higher and lower GC-rich regions in the genome; the average GC content of one flanking region of 0.5 kb is 56%, whereas that of the other 0.5-kb segment is 40%.
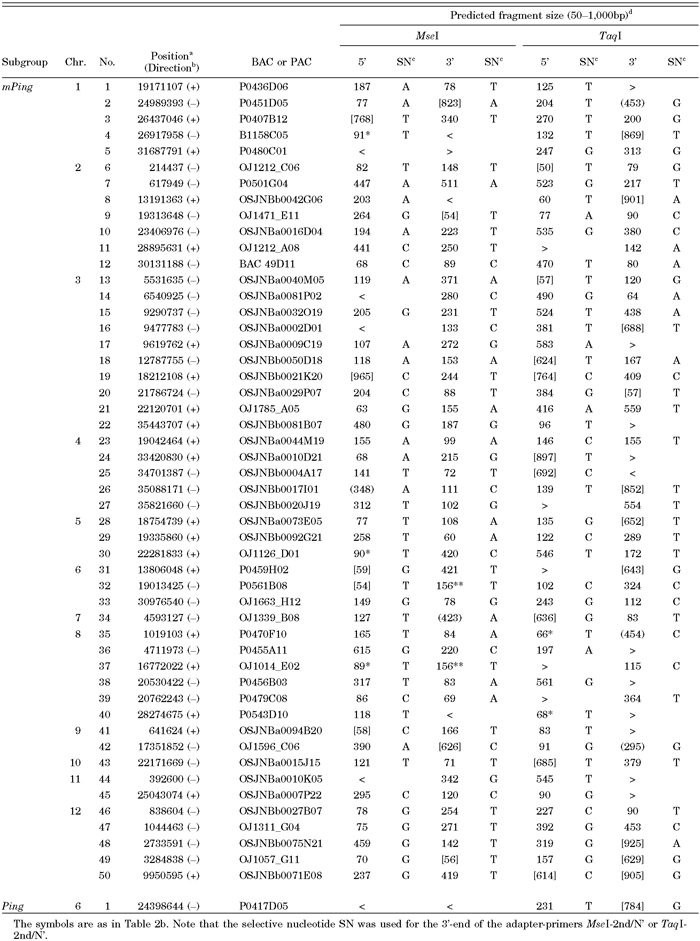 View Details | Table 3. Visualization of mPing and Ping elements in Nipponbare |
The mPing-related elements were classified into 3 groups, 0.43-kb mPing, 5.3-kb Ping, and 5.2-kb Pong, and mPing is thought to be a deletion derivative of Ping (Fig. 2b; Jiang et al., 2003). Although mPing in Nipponbare was previously estimated to be either about 70 copies by TD (Jiang et al., 2003) or 60–80 copies by Southern blot analysis (Kikuchi et al., 2003), newly obtained results with the latest 4.0 pseudomolecules in the IRGSP sequence database revealed that Nipponbare bears 50 mPing elements and a unique Ping sequence (Table 3). The 6 copies of Pong reside in the genome, and two of them exist as a composite transposon on chromosome 6; one Pong is integrated into another Pong in the opposite orientation. In addition, a rearranged Pong sequence (5’-terminal Pong segments of 0.7 kb and 0.5 kb were fused as inverted repeats) is also present on chromosome 7. The TSDs of mPing-related elements were known to be 3-bp AT-rich sequences (Jiang et al., 2003; Kikuchi et al., 2003; Nakazaki et al., 2003). Of 57 mPing-related elements examined (excluding the rearranged Pong), 3-bp TSD sequences, TCA, TTA, and TAA, were found at 1, 25, and 31 elements, respectively (Fig. 2d). The mPing-related elements are relatively AT-rich sequences; the GC contents of mPing, Ping, and Pong are 47%, 44%, and 43%, respectively. They also reside at the AT-rich region of the genome, and the average GC content of the flanking 0.5-kb regions is approximately 41%. Unlike the nDart-related elements, no clear difference can be found in the GC contents between one flanking region and the other. Therefore, the nDart- and mPing-related elements tend to reside in the higher and lower GC-rich regions, respectively, compared with the whole rice genome sequence.
Fig. 3a shows typical examples of Dart-TD, and the results are compiled in Table 2. By comparing the anticipated virtual bands with the observed bands in TD, we can assess the reliability and qualityof the obtained data. We first tried to visualize the nDart1 and iDart1/dDart1 elements. The visualization of these elements was much more difficult than that of the previously experienced MITE elements in rice: Mashu, OnagaI, StwawayOs-1, and TabitoII (Takagi et al., 2003), probably because the nDart-related elements and their flanking sequences in the rice genome are highly GC-rich sequences. We tried to optimize conditions for PCR amplification by changing several Taq polymerases available as well as the reaction conditions, including various sequences for the primers (data not shown). The optimized reaction conditions are described in MATERIALS AND METHODS, and the primers used for the optimal conditions are in Table 1. While we have succeeded reasonably well in optimizing the visualization of the elements using these primers, we could not visualize them well with primers hybridizable with their 3’-subterminal sequences (data not shown). Although we do not know why the anticipated band tend to appear inefficiently, it was noted that the visualization of 3’-flanking sequences of the maize En/Spm element is less reliable than that of 5’-flanking sequences in a certain circumstance (Yephremov and Saedler, 2000). One important contrivance for efficient PCR amplification for the nDart1 and iDart1/dDart1 elements in our optimized Dart-TD is to design a selective nucleotide to be added to the transposon-primers Dart5’-1,2,3-2nd/N (Fig. 1) for subsequent selective nested PCR amplification (Table 1) instead of designing the selective nucleotide to be added to appropriate adapter-primers (see also Fig. 1) as described in other TD procedures (Frey et al., 1998; Takagi et al., 2003). In this respect, it is noteworthy that a selective nucleotide can be added to both transposon- and adapter-primers in certain protocols (Van den Broeck et al., 1998; Fukada-Tanaka et al., 2001), whereas no selective nucleotide is used in other procedures (Jiang et al., 2003; Le and Bureau, 2004). Because of the high occurrence of the nucleotide G or C at the ends of the 8-bp TSD sequences (Fig. 2c), about three quarters of the nDart1 and iDart1/dDart1 elements are expected to be visualized when a G or C nucleotide is used as a selective nucleotide (Table 2a) that corresponds to the TSD ends. We also noticed that unpredictable bands occasionally appeared when the nucleotide A or T was used as a selective nucleotide for nested PCR amplification in Dart-TD using the transposon-primers Dart5’-2-2nd/N and Dart5’-3-2nd/N. Based on the optimized amplification conditions for the nDart1 and iDart1/dDart1 elements, we subsequently applied the conditions to visualize the remaining elements, iDart2 (including iDart1-52 and iDart1-53), iDart3, and iDart4 (Fig. 2a).
Of 81 Dart-related elements, 55, 57, 49, and 42 elements are expected to be visualized in the MseI-, TaqI-, CviAII-, and MspI-cleaved samples, respectively (Table 2). Thus, the bands produced from 79 elements are expected to appear within the range of 60 to 600 bp, whereas two elements, iDart1-39 and iDart1-52, cannot be detected in this analysis because iDart1-39 contains a 3-bp deletion at its 5’-terminus (see MATERIALS AND METHODS), and the predicted bands produced from iDart1-52 in any enzyme used are longer than 600 bp. In our TD analysis, 67 of 79 elements could be visualized as clear bands in the anticipated sizes in at least one of the amplification conditions using different primers and/or restriction enzymes, while four elements gave ambiguous results because they produced identical or nearly identical bands in size under the given amplification conditions (Table 2 and Table 4). Although seven iDart1/dDart1 elements and one iDart4 sequence were predicted to produce bands within the range of 60 to 600 bp, we were unable to detect them under all conditions used. The GC content of the 0.5-kb 5’-flanking regions of these undetectable elements was found to be 62.5% on average, which is much higher than those of the successfully amplified elements (45.6%), suggesting that the higher the GC content of the flanking sequences of the elements is, the more difficult it will be to visualize the expected bands in Dart-TD.
In Ping-TD, we first tried to use only two restriction enzymes, MseI and TaqI. Fig. 3b shows a typical example of Ping-TD, and the results are compiled in Table 3. For Ping-TD, a selective nucleotide was designed to be added to the adapter-primers (Table 1), and the selectivity of the selective nucleotides was found to be highly reliable. Jiang et al. (2003) had not used such selective nucleotides to visualize mPing-related elements in Nipponbare. By comparing the anticipated virtual mPing bands with the observed TD bands, we found that these two enzymes are sufficient to visualize all mPing-related sequences without any difficulty. As Table 3 shows, 41, 42, 37, and 29 of total 50 mPing and a single Ping are expected to be amplified within the range of 60 to 600 bp in the Ping5’/MseI, Ping3’/MseI, Ping5’/TaqI, and Ping3’/TaqI reactions, respectively, and over 90% of the anticipated bands can be observed in every condition studied. Consequently, all mPing and Ping elements are easily visualized by combining the results obtained individually (Table 4). We also noticed that unpredictable bands are rarely seen in our Ping-TD system, probably because the relatively low GC content of the mPing-related elements and their flanking sequences must be suitable for the visualization of expected bands in TD. We have not tried to visualize the Pong elements because Jiang et al. (2003) had succeeded in visualizing all Pong elements present in the latest IRGSP sequences (4.0 pseudomolecules). However, they could not detect the rearranged Pong sequence carrying two 5’-terminal inverted repeats on chromosome 7 because they visualized the Pong elements with a primer hybridizable to their 3’-subterminal sequences.
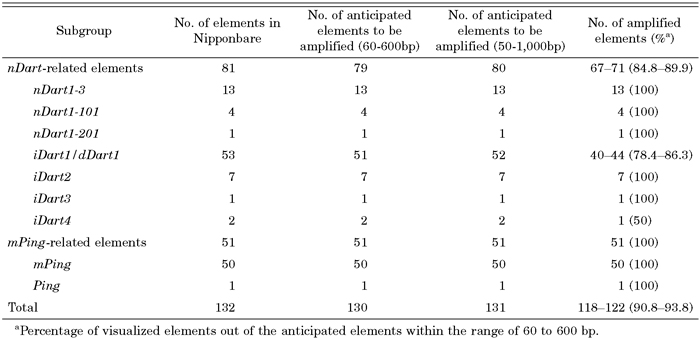 View Details | Table 4. Visualization efficiencies of transposons by Dart-TD and Ping-TD in Nipponbare |
The results of the present study are summarized in Table 4. While we were able to visualize all mPing-related elements present in Nipponbare, approximately 87% of the anticipated bands produced from the nDart-related elements within a range of 60 to 600 bp could be detected, and most of the ambiguous results in Table 4 stemmed from the appearance of identical or nearly identical bands produced from different elements. Apart from an iDart4 element, only seven iDart1/dDart1 elements failed to produce the anticipated band under every Dart-TD condition tested. The anticipated bands within a range of 50 to 59 bp and that of 601 to 1,000 bp, which could have been detected using a capillary electrophoresis system, are indicated in brackets (Table 2). In the nDart-related elements, 12, 15, 21, and 9 elements are expected to give bands in a range of either 50 to 59 bp or 601 to 1,000 bp when Dart-TD is performed with the restriction enzymes MseI, TaqI, CviAII, and MspI, respectively (Table 2 and Table 4). The results suggest that the efficiency of Dart-TD would improve if the produced bands were separated using capillary electrophoresis in the range of 50 to 1,000 bp. Similarly, a significant portion of the mPing elements are expected to produce bands in a range of either 50 to 59 bp or 601 to 1,000 bp in Ping-TD (Table 3), and preliminary data confirm that bands in a range of 50 to 59 bp can be clearly visible by capillary electrophoresis (N. Ishikawa, unpublished).
Transposon tagging with visualization by TD has been developed as a powerful method for large-scale functional genomics in higher plants (Maes et al., 1999). However, the comparison of the anticipated virtual bands based on the known sequence with the observed TD patterns has not been well documented. For example, the bands produced from the mPing-related elements in Nipponbare by TD were compared with almost half of the Nipponbare genome (187 Mb by 24 December, 2001) then available in public databases (Jiang et al., 2003). In another instance, Le and Bureau (2004) compared the anticipated four bands of the CAC elements of the CACTA superfamily in the complete sequence of the Arabidopsis genome with the only four observed bands produced by TD. In the present study, we have compared the anticipated 79 and 51 bands of the nDart- and mPing-related elements with the observed bands in Dart-TD and Ping-TD, respectively; only 67–71 bands from the nDart-related elements could be detected within a range of 60 to 600 bp in our optimized condition, whereas all 51 bands of the mPing-related elements were easily detected (Table 4). It should be emphasized here that the optimization of PCR amplification conditions for visualizing nDart-related elements in our Dart-TD protocol would not be possible without comparing the anticipated virtual bands based on the known sequence with the actually observed TD band patterns. Therefore, it is important to assess the reliability and quality of the obtained TD data as described here for developing an efficient TD procedure that is applicable to functional genomic analysis.
The nDart and mPing elements are the only active DNA transposons reported in rice, and the transposition of nDart can be controlled by ordinary crossing in the natural growth condition (Maekawa et al., 1999; Jiang et al., 2003; Kikuchi et al., 2003; Nakazaki et al., 2003; Tsugane et al., 2006). Because no tissue culture was involved in nDart activation, no somaclonal variation should occur in the nDart transposon tagging system, which is certainly an important aspect for functional genomics in rice. In addition, most of the nDart-related elements reside in GC-rich regions, and no apparent consensus sequence is found in their insertion sites including 8-bp TSD sequences, whereas the mPing-related elements are present in relatively AT-rich regions in the Nipponbare genome, and their TSDs are either TTA or TAA (Fig. 2d). These facts indicate that the target specificity of the nDart-related elements is different from that of the mPing-related elements and that the former is likely to be wider than the latter. Since the GC content of genes (45.3%) is known to be higher than that of intergenic regions (42.9%) in rice (International Rice Genome Sequencing Project, 2005), we further expect that the nDart-related elements are likely to be inserted into genic regions. Indeed, the 0.6-kb elements in the nDart1-3 subgroup were often found to be integrated into either the exon or 5’-UTR regions in aDart-containing lines (Tsugane et al., 2006; K. Takagi and M. Maekawa, unpublished). Because the transposition of the nDart1-3 subgroup elements has been shown to be much more active than that of the remaining nDart-related elements (Tsugane et al., 2006) and because all of the nDart1-3 subgroup elements in Nipponbare could be successfully visualized using our Dart-TD procedure (Table 4), the results presented here would be an important step for developing a new gene tagging system using nDart for functional genomics in rice. In accordance with such a line of investigation, we are currently attempting to generate a large number of mutant lines tagged by nDart elements and their relatives and planning to utilize the Dart-TD procedure we have developed here.
We thank Prof. Yoshio Sano for his encouragements, Ms. M. Matsumoto for her technical assistance, Drs. K. Kikuchi, A. Hoshino, C. H. Eun and Ms. S. Fukada-Tanaka for their valuable suggestion and discussion. This work was supported by grants from the Program for Promotion of Basic Research Activities for Innovative Biosciences (PROBRAIN) and the Ministry of Education, Culture, Sports, Science, and Technology of Japan. K. Takagi is a recipient of a fellowship awarded by the Japan Society for the Promotion of Science for Young Scientists.
|