| Edited by Koji Murai. Saneyoshi Ueno: Corresponding author. E-mail: saueno@ffpri.affrc.go.jp |
The areas that have been reforested in Japan have increased three-fold in recent years – from ca 34,000 ha in 1960 to ca. 221,000 ha in 2000 – and the areas reforested by broad-leaved species have also rapidly increased (Ministry of Agriculture, Forestry and Fisheries of Japan, 2002). Among broad-leaved species, members of the Fagaceae have been widely used, and the area reforested by Quercus species has reportedly doubled in the past 20 years. Ideally, the genetic composition and diversity of the populations used as sources of planting material should be carefully analyzed in such reforestation programs, for two reasons: firstly, to maintain diversity in the planted material and, secondly, to maximize the chances of establishment, since provenance tests have shown that large proportions of genetic differentiation can be attributed to climatic adaptation (Matyas, 1996; Saenz-Romero et al., 2006). If adaptive genetic variation is ignored, there may be severe detrimental effects, potentially including complete silvicultural failure. Generally, seedlings of local provenance will be ideal materials for reforestation. However, there is no clear agreement regarding precisely how “local” such materials need to be (McKay et al., 2005). Analysis of genetic diversity using suitable markers should help to resolve this issue.
In recent years, EST (Expressed Sequenced Tag) -based markers have been increasingly widely developed and used for both linkage map construction (Tani et al., 2003) and analysis of genetic variation (Rowland et al., 2003; Schubert et al., 2001). ESTs are one pass-reads from expressed regions of a genome that can be easily acquired by high-throughput capillary sequencers. The generation of ESTs is relatively rapid and they can be partially sequenced cost-effectively to obtain massive amounts of information on gene expression and coding sequences of genomes. Furthermore, since ESTs frequently include coding regions of their respective genomes, their analysis provides valuable information on functional sequences, which is especially valuable for cases where the species’ genomes have not yet been fully sequenced. In addition, some variations in DNA sequences derived from ESTs may be related to natural selection (Kado et al., 2003), thus ESTs are also useful for identifying adaptive genetic variations.
Quercus mongolica (Fagaceae) is a deciduous tree that occurs on all of the main Japanese islands (Hokkaido, Honshu, Shikoku and Kyushu). Genomic microsatellite markers for Q. mongolica have been developed (Mishima et al., 2006) and registered in publicly available databases. However, no ESTs or EST-based markers have been previously developed for this species. Therefore, in the study presented here, we generated and characterized EST sequences in order to develop EST-based genetic markers of Q. mongolica var. crispula to facilitate genetic diversity analyses. We collected 3385 EST sequences, analyzed the relative abundance of each EST, and performed similarity searches to infer their putative functions. Furthermore, simple sequence repeats (SSRs) were mined within our library. PCR primers for these sequences were developed and their polymorphisms were surveyed. The sequences characterized and EST-SSR markers developed in this study should be valuable resources for the analysis of genetic diversity of Q. mongolica and related species.
An adult Q. mongolica tree (ca. 25 cm in diameter at breast height) growing in the arboretum of the Forestry and Forest Product Research Institute (36°00.8’N, 140°13.0’E) was selected as a source of RNA, and in May 2005 several twigs at about 5 m above ground were cut from it. The twigs were chopped into sticks of about 1.5 cm in diameter and 25 cm in length. The outer bark was peeled from the sticks using a cutter. The inner bark was then stripped, immediately frozen in liquid nitrogen, sliced and ground in liquid nitrogen using a mortar and pestle. About 50 g of inner bark slice was used for RNA extraction. Total RNA was extracted by the CTAB method (Chang et al., 1993) and further purified using an SV total RNA isolation system (Promega, Madison, USA).
The mRNA was purified using an Oligotex-dT30 Super mRNA purification Kit (Takara, Japan), then a library of the sequences obtained was constructed using a cDNA Library construction Kit (Stratagene, La Jolla, USA). First-strand cDNA synthesis was carried out with oligo d(T)18 primers. Synthesized cDNAs were size-selected and ligated into pBluescript II SK(+) vectors (Stratagene, La Jolla, USA). The ligated vectors were then transformed into competent DH10B Eschericha coli cells by electroporation. The competent cells were plated onto LB media and incubated overnight. White colonies were randomly selected and sequenced from the 5’ end using a MegaBACE4000 sequencer (Amersham Bioscience) and T3 primers. The cDNA library construction and sequencing were carried out by the Dragon Genomics center in Mie Prefecture, Japan.
The sequence data were analyzed by PartiGene software (Parkinson et al., 2004) as follows. We used trace2dbest, part of the PartiGene package to process raw trace files, perform base calling and remove vector and low quality sequences with Phred (Ewing and Green, 1998; Ewing et al., 1998). The error probability cutoff value of Phred was set at the default value of 0.05. Sequences less than 150 bp long after Phred processing were removed from the following analysis. The remaining sequences were used for clustering with CLOBB (Parkinson et al., 2002) under its default settings. Clusters containing more than one sequence were assembled into consensus sequences with Phrap (Green, 1999) under its default settings expect that the forcelevel was set at 10 according to the suggestion in “UserGide & Tutorial” of the PartiGene. All contigs (including singletons, for which only one sequence was included in a contig) were assumed to be unigenes and used for primary annotation through similarity searches against the NCBI nr database using the Blastx (Altschul et al., 1990) algorithm with an e-value cutoff of 1e-5. The unigenes were functionally classified through similarity searches against uniprot (uniprot_trembl and uniprot_sprot) databases (Apweiler et al., 2004) with an e-value cutoff of 1e-25 according to annotation based on GO and GO slim terms (Harris et al., 2004), using annot8r_blast2GO, a sequence annotation script published by Schmid & Blaxter (http://www.nematodes.org/PartiGene/index.html). Uniqueness of the unigenes was assessed by similarity search against NCBI UniGenes of Arabidopsis thaliana (UniGene At build 52), Oryza sativa (UniGene Os build 61) and Poplus balsamifera (UniGene Pba build 2), using tBlastx algorithm with an e-value cutoff of 1e-5. Next, microsatellites were surveyed using SSRIT (Temnykh et al., 2001); a microsatellite search tool available from the USDA-ARS Center for Bioinformatics. Sequences with at least nine, six and five repeats for di-, tri- and tetra-SSRs, respectively, were surveyed. Whether the microsatellites within each unigene were located in coding or non-coding (5’ UTR and 3’ UTR) region was assessed using ESTScan (Iseli et al., 1999). The functions of unigenes harboring microsatellite sequences were analyzed according to the GO annotations described above. To assess whether the number of microsatellite-containing unigenes in specific categories significantly deviated from the numbers expected from random sampling, samples of 118 were randomly selected from the 1109 GO-annotated unigenes 1000 times, and 95% confidence limits for the frequency of unigenes in each GO category, were determined, using Perl scripts written in-house.
PCR primers for di- and tri-SSRs were designed by Primer3 (Rozen and Skaletsky, 2000), called from read2Marker script (Fukuoka et al., 2005) under its default settings. The utility of EST-SSR primers designed in the present study was demonstrated by analyzing polymorphisms among individuals of Q. mongolica, Q. serrata and Q. dentata (Table 1). These three species are sufficiently closely related to hybridize with each other. Eight individuals of each of the three species were genotyped, by PCR carried out in 6 μL of reaction mixtures containing ca. 10 ng genomic DNA, 1 × PCR buffer, 200 μM of each dNTP, 1.5 mM MgCl2, 0.2 μM of each primer designed in the present study and 0.15 U of Taq polymerase (Promega), using the following program: 94°C for 3 min, then 40 cycles of 94°C for 45 sec, 55°C for 45 sec and 72°C for 45 sec, followed by a final extension at 72°C for 7 min. PCR products were labeled with ChromaTide Rhodamine Green-5-dUTP (Molecular Probes Eugene, USA) according to the method of Kondo et al (2000), and analyzed using a 3100 Genetic Analyzer with GeneScan software (Applied Biosystems, Foster City, USA). For each locus, the number of alleles (Na) was counted and observed heterozygosity (Ho) was calculated. The proportion of shared alleles between individuals was computed by the MSA software (Dieringer and Schlötterer, 2003) and an NJ dendrogram was constructed with the PHYLIP package (Felsenstein, 1989). Dendrograms were graphically displayed by MEGA version 3.1 (Kumar et al., 2004).
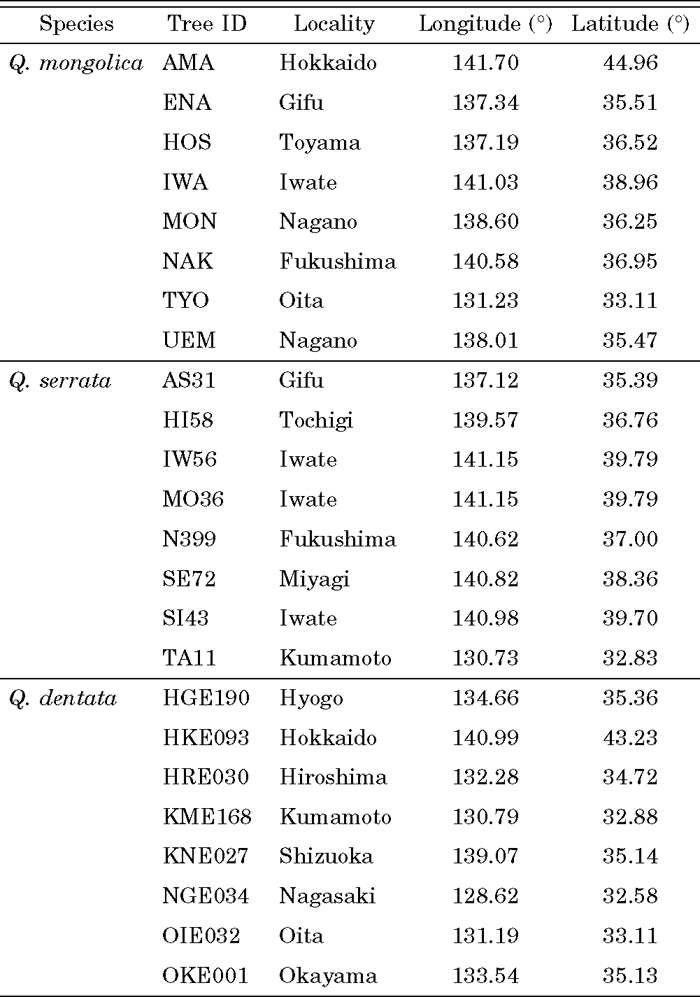 View Details | Table 1 Locations of samples used for polymorphism screening |
A total of 3642 reads were obtained. After Phred processing, 3385 reads proved to have high quality sequences more than 150 bp long. The average length of high quality sequences was 558 bp. They were then grouped into 2119 sequence clusters, 1672 of which comprised single EST sequences. The remaining 447 clusters included 1713 EST sequences and assembled into 468 contigs. In total, 2140 unigenes were identified. All but one cluster comprised less than 30 ESTs, and one cluster included 102 sequences.
The Blastx search against the NCBI nr database showed that 1702 contigs had similarity with other proteins in the database, while no similar proteins were detected for the remaining 438 at an e-value cutoff of 1e-5. Functional classification based on GO terms assigned 538, 976 and 825 of the unigenes to the cellular component, molecular function and biological process categories, respectively, and the largest proportions of terms within these categories to the intracellular (GO:0005622; 75%), catalytic activity (GO:0003824; 35%) and physiological process (GO:0007582; 56%), subcategories (Fig. 1). In total, 1109 unigenes were assigned at least one GO term. The tBlastx search against the NCBI UniGenes of Arabidopsis thaliana, Oryza sativa and Populus balsamifera showed that 1759 contigs had similarities with at least one UniGenes within the three species. However, the remaining 381 had no similarities with those UniGenes at an e-value cutoff of 1e-5 and regarded as new transcripts in Q. mongolica inner bark.
 View Details | Fig. 1 Functional profile of the 1109 Q. mongolica unigenes annotated according to GO slim terms (open squares). The error bars indicate 95% confidence limits for the frequencies of unigenes annotated with a specific GO slim term when 118 unigenes were randomly sampled 1000 times. The circles show functional profiles for 118 microsatellite-containing unigenes with GO annotation. Closed circles indicate significantly highly represented GO slim terms amongst unigenes with microsatellites. The GO IDs and corresponding terms are as follows: GO:0005622, intracellular; GO:0005623, cell; GO:0005576, extracellular region; GO:0005941, unlocalized protein complex; GO:0003824, catalytic activity; GO:0005488, binding; GO:0003676, nucleic acid binding; GO:0005198, structural molecule activity; GO:0005215, transporter activity; GO:0004871, signal transducer activity; GO:0005554, molecular function unknown; GO:0030528, transcription regulator activity; GO:0030234, enzyme regulator activity; GO:0003774, motor activity; GO:0007582, physiological process; GO:0006139, nucleobase, nucleoside, nucleotide and nucleic acid metabolism; GO:0006810, transport; GO:0006118, electron transport; GO:0050896, response to stimulus; GO:0006519, amino acid and derivative metabolism; GO:0007154, cell communication; GO:0007275, development; GO:0050789, regulation of biological process; GO:0006928, cell motility; GO:0009987, cellular process. |
The SSRIT script identified 274 microsatellites in 2140 unigenes (Table 2), but microsatellite motifs were present in only 248 of the unigenes, because some of them contained multiple microsatellites. The most frequent microsatellite had AG motifs, and we found no CG repeats in the unigenes. The frequency of di-SSRs decreased as the number of repeats increased; about 90% of the di-SSRs had less than 17 repeats. Among tri-SSRs (90% of which had less than 10 repeats), AAG and AAC repeats were relatively frequent (Table 2). However, there were far fewer tri-SSRs than di-SSRs. We found 10 tetra-SSRs in the unigenes. The maximum number of repeats was 49 (of the AG motif). Analysis of the location of the SSRs within genes indicated that 172 (63%) of them reside in non-coding regions, and 83 (30%) of them are likely to be located in coding regions. The locations of the remaining 19 (7%) of the SSRs were not determined, but they are likely to be non-coding. Most of the di-SSRs were located in non-coding regions, 69.5% of tri-SSRs appeared to be coding regions, and 80% of the tetra-SSRs in non-coding regions (Fig. 2). Most of the non-coding SSRs (90.7%) was inferred to be in 5’ UTR, probably because the EST sequencing was performed from 5’ end.
 View Details | Table 2 Abundance of microsatellites in the Q. mongolica unigenes |
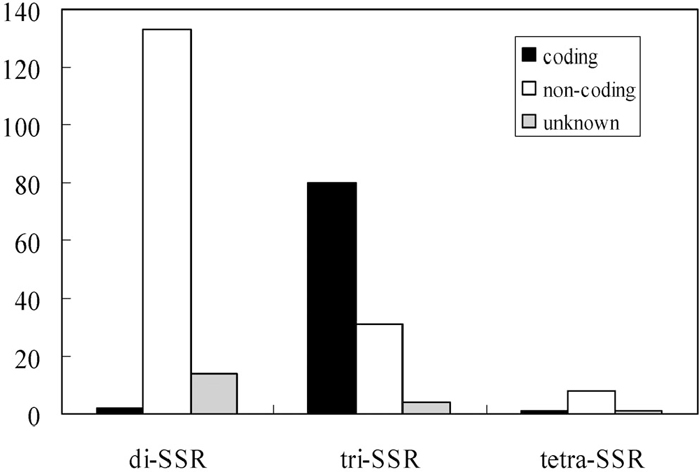 View Details | Fig. 2 Frequency distribution of di-, tri- and tetra-SSRs in coding and non-coding locations. |
GO annotations, which were assigned to 118 microsatellite-containing unigenes in total, indicated that the following terms were strongly represented in them: nucleic acid binding (GO:0003676; 24.6%), nucleobase, nucleoside, nucleotide and nucleic acid metabolism (GO:0006139; 24.5%), and cell communication (GO:0007154; 9.4%) (Fig. 1). According to the random sampling tests (see above), the most highly represented GO terms (GO:0003676, GO:0006139 and GO:0007154) proved to be significantly more strongly represented than expected (P < 0.05) among the unigenes harboring microsatellites (Fig. 1), After Bonferroni correction for multiple testing, only GO:0003676 (nucleic acid binding) was significantly overrepresented (P < 0.001).
In total, 32 and 13 primer pairs were designed for di- and tri-SSRs, respectively, and 31 of them successfully amplified Q. mongolica genomic DNA sequences. The remaining 14 primer pairs showed multiple banding patterns or produced larger products than expected (more than 500 bp), which were excluded for future analysis. When the successful primer pairs were applied to related species, 28 (90%) and 31 (100%) of them amplified Q. serrata and Q. dentata DNA sequences, respectively, both of which belong to the same section as Q. mongolica (Kanno, 2005; Manos and Stanford, 2001). After fluorescent labeling and electrophoresis by the capillary sequencer, 20 primer pairs (Table 3) showed a clear single locus amplification pattern for eight Q. mongolica genomic DNA samples. Some primer pairs produced 3 peaks and/or peaks that were difficult to genotype and are not listed in Table 3. The number of alleles per locus (Na) and observed heterozygosity (Ho) ranged from 2 to 12, and from 0.25 to 1.00, respectively (Table 4). In addition, genotypes of the eight individuals representing Q. serrata and Q. dentata were determined at 19 and 20 loci, respectively, and their levels of polymorphism were found to be nearly as high as those in Q. mongolica. The genotypic data for all of the loci except QmC01758 (which was not examined in Q. serrata), were used to calculate shared allele distances and construct an NJ dendrogram for the 24 individuals representing the three species (Fig. 3). The 24 individuals were roughly clustered by species. There were no significant relationships between geographic distance and shared allele distance among individuals.
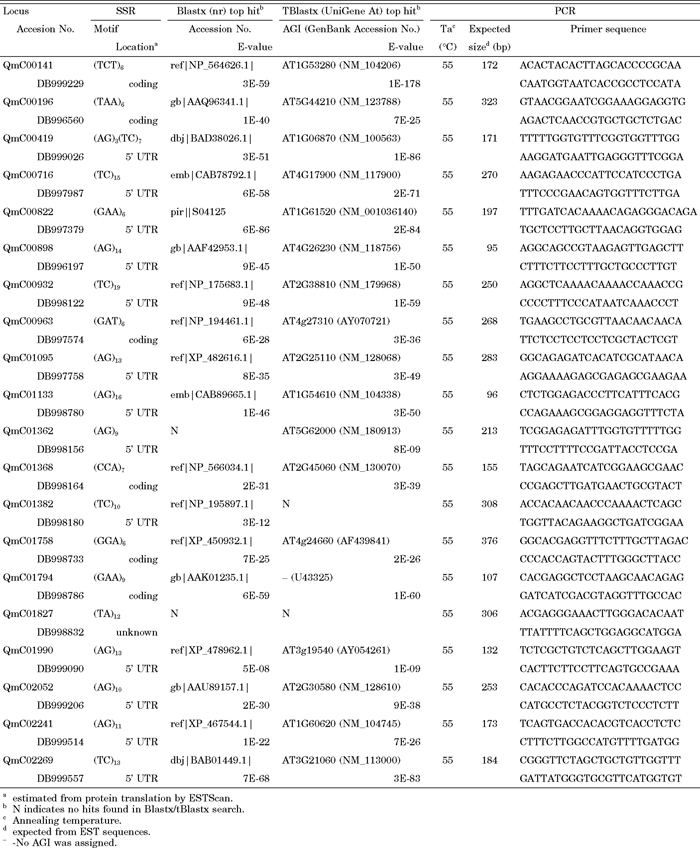 View Details | Table 3 Characteristics of the Q. mongolica EST-SSR markers |
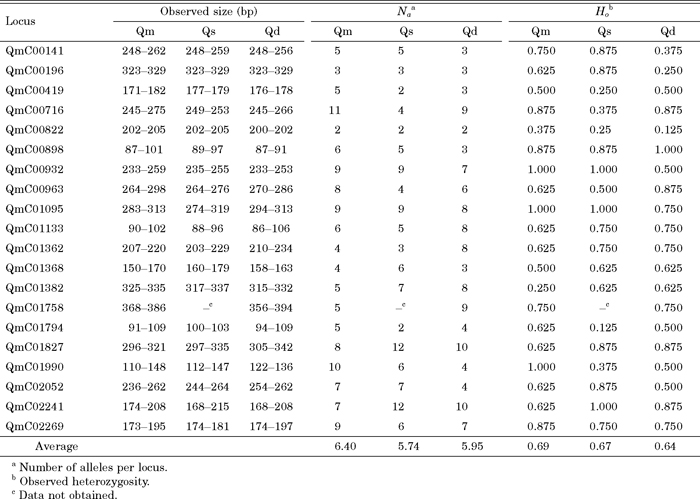 View Details | Table 4 Polymorphisms for EST-SSR markers for Quercus mongolica (Qm), Q. serrata (Qs) and Q. dentata (Qd) |
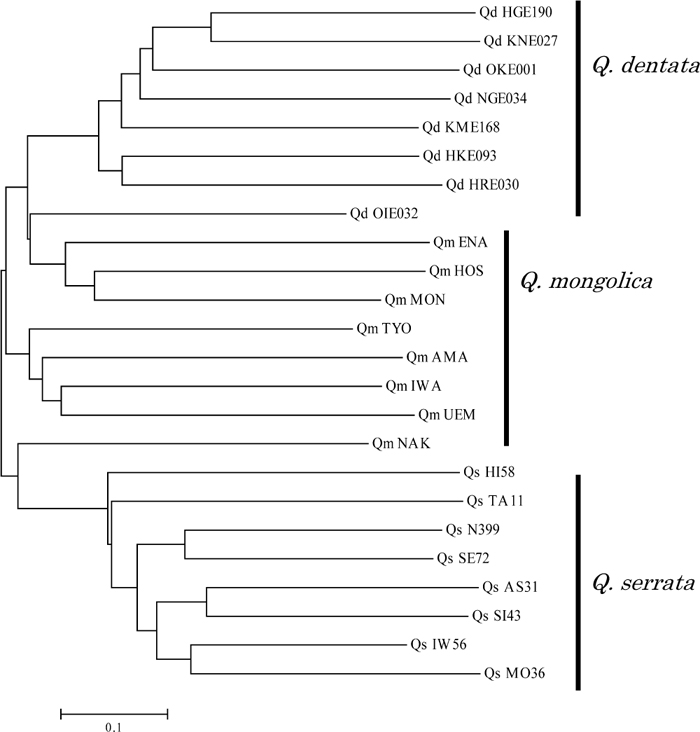 View Details | Fig. 3 NJ dendrogram for individuals of Q. mongolica (Qm), Q. serrata (Qs) and Q. dentata (Qd) based on the proportion of shared alleles for 19 EST-SSR markers. Individual tree IDs (Table 1) are shown following species abbreviations. |
The frequency analysis of the di-SSRs found in this study (Table 2) showed that the AG motif was the most abundant, in accordance with the general tendency for this motif to be the most common in plant genomes (Lagercrantz et al., 1993), especially in ESTs (Morgante et al., 2002). An SSR survey of tri-SSRs in Arabidopsis thaliana found that the AAT repeat was the most common and AAG the next most frequent (Katti et al., 2001), while CCG has been found to be the most common in Oryza sativa (La Rota et al., 2005). The tri-SSR frequency pattern we found in Q. mongolica was more similar to the A. thaliana than the O. sativa pattern reported by the cited authors. Furthermore, tri-SSRs were more concentrated in coding-regions of the unigenes, while di-SSRs were located mostly in non-coding regions (Fig. 2), probably due to selective pressures against frameshift mutations in coding regions (Metzgar et al., 2000).
Functional analysis of the unigenes and EST-SSRs based on GO slim terms (Fig. 1) revealed that the EST-SSRs were significantly more frequent than expected by chance in nucleotide-binding proteins (GO:0003676). More specifically, many of the Q. mongolica unigenes with GO:003676 had similarity to transcription and translation-related proteins (data not shown). This may reflect the putative importance of the flexibility conferred by mono-amino acid repeats in the proteins (transcription factors) found with nucleic acids in transcription complexes (Faux et al., 2005). Previous analyses of A. thaliana and O. sativa proteins have shown that amino acids repeats are also overrepresented in their transcription factors (Zhang et al., 2006).
In the present study, we developed 20 EST-SSR markers for Q. mongolica. The number of alleles per locus (Na) and observed heterozygosity (Ho) ranged from 2 to 12, and from 0.25 to 1.00, respectively (Table 4). Mishima et al (2006) surveyed the polymorphisms of 11 genomic di-SSR markers in 67 Q. mongolica individuals, and reportedly found 5 to 18 alleles per locus with observed heterozygosities values ranging from 0.522 to 0.896. Thus (although the number of individuals genotyped differs substantially between the present investigation and the cited study), the level of polymorphism appears to be higher for genomic SSRs (gSSR) than for EST-SSRs, in accordance with trends found in a systematic study of sunflower (Pashley et al., 2006). However, Pashley et al. (2006) also found no significant differences between the levels of variability in transferable EST-SSR and gSSR markers in their systematic comparison. EST-SSR markers are reported to be more transferable to related species than anonymous gSSR markers (Chabane et al., 2005; Chagne et al., 2004; Rungis et al., 2004). Therefore, EST-SSR markers are likely to be especially useful in analyses of genetic diversity in populations in hybrid zones (where simultaneous analyses of hybridizing species are required) or at the distributional margins of species (where null alleles are likely to be present) since the frequency of null alleles is likely to be lower for EST-SSR markers, due to their conservative nature, than the corresponding frequencies of other types of markers that could be used. Ishida et al. (2003) detected hybrid individuals between Q. mongolica and Q. dentata in a natural population, using morphological and AFLP data. In such a situation, EST-SSR markers developed in the present study should be useful for analyzing gene flow between species. We believed that the PCR primers designed in the present study should be of considerable assistance in future studies.
The authors are grateful to M. Kanno, A. Kanazashi, H. Yoshimaru, K. Ishida, Y. Koyama and K. Koono for sample collection. This research was supported by a grant for Research on Genetic Guideline for Restoration Programs using Genetic Diversity Information from the Ministry of Environment, Japan. The ESTs described in this paper have been submitted to the DDBJ with the accession numbers DB996174-DB999558.
|