| Edited by Yoko Satta. Quanqi Zhang: Corresponding author. E-mail: qzhang@ouc.edu.cn |
Tyrosine phosphorylation, controlled by the coordinated actions of protein tyrosine phosphatases (PTPs) and protein tyrosine kinases (PTKs), is a critical mechanism for the regulation of numerous cell functions including cellular proliferation and differentiation, metabolism, development, cytoskeletal organization, gene transcription, and the immune response (Tonks and Neel, 1996; Mustelin et al., 2002). Since the identification of the first PTP in 1988, several dozens of PTP members have been identified in organisms ranging from virus to human (Tonks et al., 1988; Fischer et al., 1991; Alonso et al., 2004).
PTPR4 is a kind of proto-typical transmembrane PTP containing two cytoplasmic PTP domains (D1 and D2), one transmembrane segment and an extracellular domain. PTPα and PTPε, originally cloned in 1990, are the only known members of PTPR4 (Sap et al., 1990; Matthews et al.,1990; Krueger et al., 1990). In recent years it has become evident that the precise subcellular localization of PTPs is an important factor in regulating their physiological roles (Mauro and Dixon, 1994; Fischer, 1999). PTPε, which is at the focus of this study, includes four forms of proteins coded by a single PTPε gene, providing an example of correlation between subcellular localization and function. The two most prevalent forms are the transmembrane form (PTPε M) and cytoplasmic form (PTPε C) derived from a single PTPε gene by alternatively spliced promoters (Elson and Leder, 1995b; Elson et al., 1996; Nakamura et al., 1996). The other two forms are shorter molecules p67 PTPε and p65 PTPε that exist together with either PTPε M or PTPε C. p67 is produced by initiation of translation at an internal initiation codon of PTPε mRNA molecules, while p65 is produced by specific proteolytic cleavage of larger PTPε proteins (Gil-Henn et al., 2000,2001; Kraut et al., 2002). Each form possesses unique tissue-specific expression patterns, subcellular localizations, and physiological functions.
In teleost fish, Okubo and Aida (2003) isolated and characterized PTPα and PTPε M in the medaka, and demonstrated that GnRH down regulates the PTPα/PTPε M gene expression using an in vitro medaka whole-brain culture system. Van der Sar et al (2001) cloned PTPα and PTPε M in zebrafish and described their expression during the embryo development. However, none of cytoplasmic form of PTPε was identified in teleost fish.
In this paper, we report the isolation of full length cDNAs of PTPα and two forms of PTPε, PTPε M and PTPε C, from brain and spleen RNA of Japanese flounder. We proved that these two isoforms of PTPε are also from one PTPε gene by alternative mRNA splicing. The unique expression patterns of PTPα and two isoforms of PTPε mRNAs in various tissues are described.
The animal used in the present study was Japanese flounder, Paralichthys olivaceus (Pleuronectiformes, Paralichthyidae). Fish samples were collected from a flounder hatchery located in Weihai, Shandong Province.
Total RNAs were extracted individually from brain, spleen and kidney tissues using TRIZOL (Invitrogen). The cDNAs were then synthesized from total RNAs by reverse transcription using oligo (dT) primer with reverse transcriptase MMLV (Promega) and used as templates for PCR amplifications. The general sense primer for PTP (PTP-sense) and the general antisense primer for PTPR4 (PTP-antisense) were designed from conserved amino acid residues of PTP (Denu et al., 1996) (Table 1).
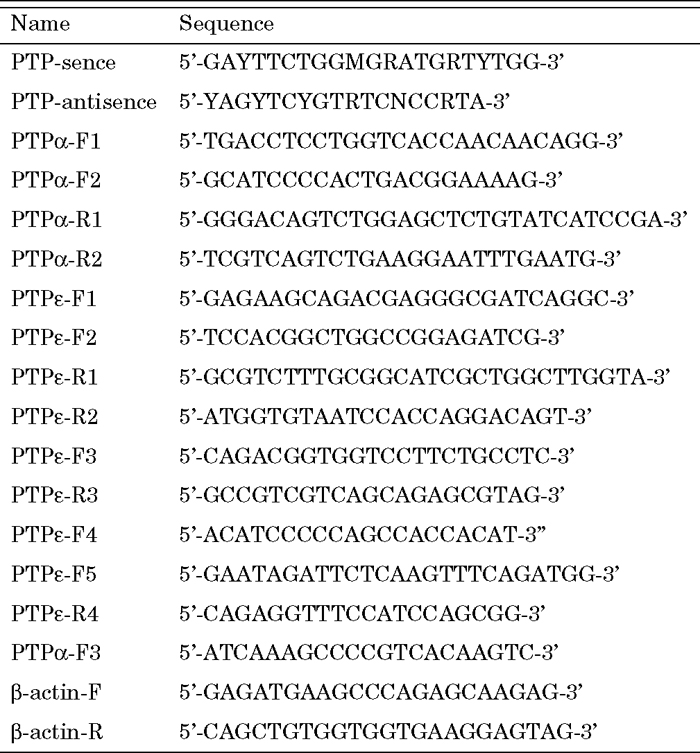 View Details | Table 1 Degenerate primers and gene specific primers used in this study |
The PCR-amplified fragments were purified and cloned into PMD-18T vector (TaKaRa, Dalian, China). Six independent clones containing inserts were isolated and sequenced. Confirmation of these sequences was carried out by multiple alignment of the deduced amino acid sequences of these inserts using CLUSTAL W method (Thompson et al., 1994). The result suggested that three inserts were for PTPα and the other three were for PTPε.
Rapid amplification of cDNA ends (RACE) of PTPα and PTPε was carried out using SMART RACE amplification kit (BD Biosciences) with mixed RNA from brain, spleen and kidney as templates. Gene specific primers (GSPs) PTPα-F1/PTPα-R1 and nested gene specific primers (NGSPs) PTPα-F2/PTPα-R2, designed from the known cDNA sequences determined previously were used for 3’- and 5’-RACE of PTPα, respectively (Table 1). Likewise, GSPs PTPε-F1/PTPε-R1 and NGSPs PTPε-F2/PTPε-R2 were used for 3’- and 5’-RACE of PTPε, respectively (Table 1). PCR amplifications were performed according to the instructions provided by the manufacturer. The RACE products were checked on 1.5% agarose gel. Only one band was observed in 3’-RACE reactions and 5’-RACE of PTPα, but two bands were found in 5’-RACE reaction of PTPε. Then all RACE products were cloned and at least three independent clones of each product were sequenced.
Sequence data used for phylogenetic analysis were obtained from NCBI. Multiple alignment of the amino acid sequences of PTP domains D1 and D2 in PTPR4 were conducted using Molecular Evolutionary Genetics Analysis (MEGA) 3.1 software (Kumar et al., 2004).
Genomic DNA was extracted individually from muscle tissues using routine phenol/chloroform method and completely digested with BamHI, EcoRI, HindIII, PstI or XbaI, respectively. Five micrograms of DNA from each enzyme digestion were loaded and separated by 0.9% agarose gel electrophoresis, blotted to positively charged nylon membranes (Amersham Biosciences) and cross linked under UV light.
The hybridization probe was a 108 bp cDNA fragment hybridizing to a common sequence of both isoforms of PTPε cDNAs. The probe was generated by PCR using primer pairs PTPε-F3/PTPε-R3 (Table 1), labeled with PCR DIG probe synthesis kit (Roche Applied Science). After pre-hybridization at 44°C for 30 minutes in DIG Easy Hyb (Roche Applied Science), denatured probe was added to pre-heated DIG Easy Hyb at approximate concentration of 1.5 μl/ml and then hybridized to the membrane at 44°C for 12 hours. The blot was washed to a final stringency of 0.5 × SSC containing 0.1% SDS at 65°C. The hybridization signal was then visualized with NBT/BCIP (Roche Applied Science).
Two-microgram aliquots of total RNAs from brain, heart, liver, spleen, gill, kidney, intestines, muscle, testis and ovary tissues treated with DNase I (Takara, Dalian, China) were used to synthesize single-strand cDNAs. These cDNAs were diluted 10 folds with sterile water and used as templates for semi-quantitative RT-PCR. The primers used were PTPα-F3/PTPα-R2 for PTPα, PTPε-F4/PTPε-R4 for PTPε M and PTPε-F5/PTPε-R4 for PTPε C, respectively (Table 1). To clearly display the different expression profiles of the two isoforms of PTPε, a duplex RT-PCR was performed to amplify PTPε M and PTPε C from the same cDNA samples using PTPε-F4, PTPε-F5 and PTPε-R4. Expression of β-actin served as internal control. Through pre-experiments (data not shown) the number of cycles for which RT-PCR were taken was optimized to be 20 for the β-actin and 26–28 for PTP genes. All PCR products were run on 2% agarose gels, stained with ethidium bromide, and photographed under a BIO-BEST 200M image system (SIM, HK, China).
A fragment about 560 bp was obtained by general primer for PTP and specific primer for PTPR4. After cloning to PMD-18T, six independent clones containing inserts were isolated and sequenced. Sequence analysis showed that three inserts were PTPα and the other three were PTPε.
Based on the partial sequence of PTPα, a 1230 bp fragment was obtained by 3’-RACE PCR of PTPα, and a 1680 bp fragment was amplified in 5’-RACE. Thus the complete PTPα cDNA sequence of 3086 bp was obtained and deposited in Genbank with Accession No. DQ683253. This sequence contained a 454 bp 5’ UTR, a 2490 bp open reading frame (ORF) with a typical Kozak sequence and a 142 bp 3’ UTR. An in-frame stop codon was found at 33 nucleotides upstream of initiation codon. The deduced protein of 830 amino acids included a probably signal peptide, transmembranal region and two highly conserved catalytic domains of receptor-type PTPs. Comparison of the amino acid sequences showed that the identity between flounder PTPα and human, mouse, rat, chicken, African clawed frog, zebrafish or medaka PTPα was 77%, 74%, 76%, 76%, 73%, 80% and 83%, respectively. The C-terminal, which represents the cytoplasmic PTP domains and the transmembranal region, had high identity (91%, 90%, 90%, 89%, 91%, 96%, and 95%, respectively) but its N-terminal, the extracellular domain, showed very low identity (18%, 15%, 15%, 23%, 15%, 25%, and 43%, respectively) (Fig. 1).
 View Details | Fig. 1 Comparison of deduced amino acid sequences of PTPα in the flounder and their orthologs. Identical residues are boxed in black. PTP domain D1 was underlined and D2 was double underlined. |
In 3’-RACE PCR for PTPε a single 1300 bp fragment including polyA tail was amplified. In 5’-RACE reaction, however, two different-sized PCR products were obtained. The longer one was 1100 bp and the shorter one was 850 bp. Sequencing results showed that the difference between them located exclusively at the 5’ ends. The first 392 bp of the larger cDNA fragment were replaced by 143 bp in the shorter one. Thus two complete cDNAs of PTPε were obtained with 2481 bp and 2232 bp, and deposited in Genbank with Accession Nos. DQ825344 and DQ825345, respectively. Each cDNA contained an ORF and an in-frame stop codon upstream of the initiator ATG (24 bp upstream in larger one and 30 bp in shorter one) indicating that they were all the true complete cDNAs. The ORF of the larger cDNA was 2046 bp encoding 682 amino acids and the shorter one was 1911 bp encoding 637 amino acids. The deduced amino acid sequences of these two proteins were identical except a small part at their amino end (Fig. 2A). The unique sequences of the larger PTPε consisting of 56 amino acid residues contained a signal sequence, an extracellular region, and a transmembranal domain. These regions were replaced in the smaller protein by a stretch of 11 hydrophilic amino acids that lacked the above features (Fig. 2B). The common sequence of the two proteins consisted of two highly conserved catalytic domains of receptor-type PTPs. According to the comparison of the amino acid sequences with their human orthologs, the larger protein should be “PTPε-transmembranal” (PTPε M), while the shorter one should be “PTPε-cytoplasmic” (PTPε C).
 View Details | Fig. 2 Diagram of PTPε M and PTPε C ORF (A) and partial protein products (B). TM (black box) indicates transmembranal domain; D1 and D2, PTP catalytic domains (hatched boxes). Vertical arrows mark where the sequences converge. Signal sequence was marked with dashed line; transmembranal domain was marked with solid line; the probe for southern blotting was marked with wave line. |
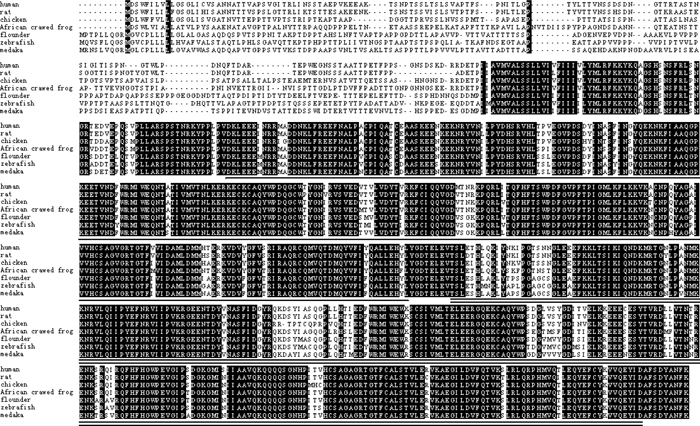
Flounder PTPε M shared 73%, 72%, 72%, 84% and 77% identity with human, mouse, rat, zebrafish and medaka PTPε M, respectively. The D1 and D2 domain of flounder PTPε exhibited 79%, 78%, 78%, 88% and 82% identity with the corresponding regions in human and other animals, respectively (Fig. 3). Flounder PTPε C shared 77% and 76% identity with human and rat PTPε C, respectively (Fig. 4).
 View Details | Fig. 3 Comparison of deduced amino acid sequences of PTPε M in the flounder and their orthologs. Identical residues are boxed in black. PTP domain D1 was underlined and D2 was double underlined. |
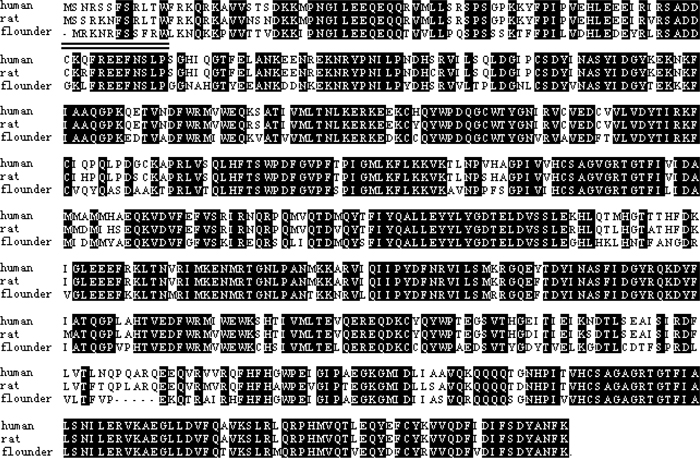 View Details | Fig. 4 Comparison of deduced amino acid sequences of PTPε C in the flounder and their human and rat orthologs. Identical residues are boxed in black. The unique sequences of PTPε C were double underlined. |
The sequences of PTPε M and PTPε C cDNAs were identical except for the 5’-terminal regions. To clarify that how many PTPε genes exist in flounder genome southern hybridization was carried out. The probe was designed to hybridize a common sequence of both isoforms of PTPε cDNAs (Fig. 2). The blotting results showed that only one hybridization signal was detected in BamHI, EcoRI, HindIII, PstI or XbaI digested genomic DNA samples (Fig. 5).
 View Details | Fig. 5 Genomic Southern blotting analysis for PTPε in the flounder. Genomic DNA was digested separately with BamHI, EcoRI, HindIII, PstI and XbaI. Only one hybridization single band was obtained for each digested DNA, indicating that there is only one PTPε gene in the flounder genome. |
For phylogenetic analysis of PTPR4 family among cyclostomes, cartilaginous fishes, teleosts and tetrapods, only partial cDNA sequences including PTP domain 2 (D2) and part of D1 are available for all the taxa. Fig. 6 shows the phylogenetic analysis of the PTP domain D1 and D2 in PTPR4 family, inferred by MEGA 3.1 software. The trees were inferred by neighbor-joining (NJ) method (Saitou and Nei, 1987), using human, chicken, and shark PTPs belonging to the PTPR1/6 subfamily as an outgroup. The bootstrap probability was calculated by the LBP (local bootstrap probability) method (Adachi and Hasegawa, 1996).
 View Details | Fig. 6 Phylogenetic trees of PTPR4 family from comparison of the PTP domain D1 (280 amino acids) (A) and domain D2 (291 amino acids) (B). The number at each branch node represents the local bootstrap probability estimated by the LBP method. The filled circle shows the Agnatha–Gnathostoma split. |
According to the phylogenetic trees by both D1 and D2, the PTPR4 was divided clearly into two branches, PTPα and PTPε. Flounder was first jointed with zebrafish or medaka, and then the three teleosts formed a cluster in both branches. As for the relationship among medaka, flounder and zebrafish, the phylogenetic trees of PTPα D1, PTPε D1 and PTPε D2 showed zebrafish was more closely related to flounder, while the tree of PTPα D2 showed medaka was more closely related to flounder. Although PTPα D2 did not show the consensus topology, it was supported by less bootstrap probability. In hagfish, no PTPε and PTPα D1 are available for phylogenetic analysis at present, the hagfish hgPTPR4 was apparently an ortholog of human / mouse / rat / chicken / African crawed frog PTPα.
Semi-quantitative RT-PCR was performed to evaluate the levels of PTPR4 mRNAs in various flounder tissues. PTPα expressed highly in gill, and also expressed at different levels in brain, heart, spleen, kidney, intestine and testis. Expression of PTPα in liver, muscle and ovary tissues was very low or undetectable (Fig. 7). PTPε M expressed in all tissues, of which brain showed the highest level of expression and liver showed the lowest. Compared with the above two transmembrane forms of PTPR4, the expression of PTPε C showed higher variation among tissues. It distributed expressed relatively high in spleen and kidney tissues. Other tissues showed very low or no expression (Fig. 7). There was no positive correlations in the expression patterns as well as the expression levels between these two forms of PTPε (Fig. 7).
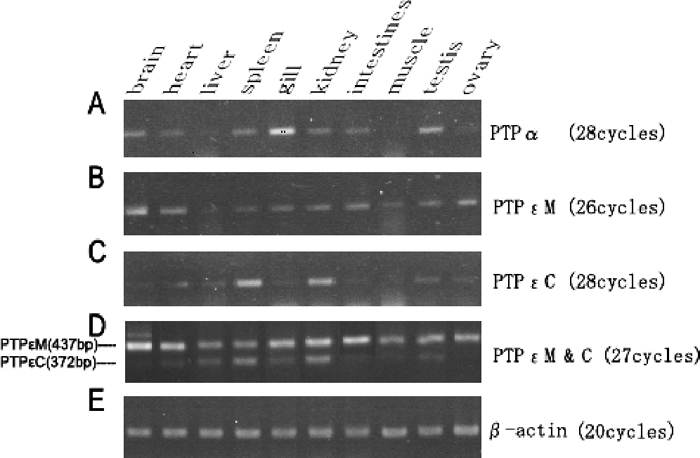 View Details | Fig. 7 Tissue expression of PTPα (A), PTPε M (B) and PTPε C (C) mRNA analyzed by RT-PCR. A comparative study of PTPε M and PTPε C expression were exhibited (D). Expression of β-actin was used as an internal control (E). |
Here we have isolated the full length cDNAs of PTPR4 family, including one form of PTPα and two forms of PTPε from brain and spleen tissues of Japanese flounder. Both PTPα and PTPε M contain generalized domain structures. The deduced proteins shared similarity in catalytic domains with other vertebrates, but divergence in the extracellular domains.
In the present study we detected the existence of PTPε C in Japanese flounder. Sequence analysis of the PTPε C cDNA revealed that it differed from that of PTPε M cDNA only at its 5’ end. In human, mouse and rat genome, the two isoforms of PTPε are encoded by a single gene. Different isoforms are derived from alternative splicing of 5’ exons and promoters of this gene (Elson et al., 1996; Tanuma et al., 1999). The identification of PTPε C in non-mammalian animals has not been reported yet. To explore if the same organization of PTPε exists in flounder, genomic Southern blot analysis was carried out. In rat genome, exon identification of PTPε indicated that the translation initiation codons (ATG) of PTPε M and PTPε C were located within exon 2 and exon 4 respectively. Exon 5 contained the sequence common to both PTPε M and PTPε C cDNAs (Tanuma et al., 1999). The location of exon/intron junction sites were conserved (Okubo et al., 2002; Okubo and Aida, 2003), therefore, the probe was designed to hybridize a common sequence of both isoforms in the corresponding region of exon 5 in medaka. Only one hybridization signal was detected in each digested DNA. This fact proved that there exists only one PTPε gene in flounder. The two cDNA isoforms with distinct 5’ exons and promoters might have been derived from alternative splicing of the same PTPε gene, as having been reported in mammalian genome (Elson et al., 1996; Tanuma et al., 1999)
Each isoform of PTPε possessed unique tissue-specific expression patterns in flounder. Similar phenomenon has been reported in adult mouse and rat (Sap et al., 1990; Matthews et al., 1990; Elson and Leder, 1995a; Elson et al., 1996).This result indicated that which of the isoforms is to be expressed might be subject to complicated regulation at the level of transcription. The distinct expression levels and patterns in various tissues suggested that each isoform should have distinct physiological roles. The differences in their subcellular localization and tissue specificity may cause each of the PTPε isoforms to encounter different substrates and interacting molecules.
PTPR4 express widely in various tissues and have been implicated in several signaling pathways in mammals. PTPα has been associated with cellular transformation (Zheng et al., 1992), neuronal differentiation (den Hertog et al., 1993), cellular adhesion and spreading (Zeng et al., 2003). Expression of PTPα has also been included in C-terminal dephosphorylation and activation of Src and Fyn (Harder et al., 1998; Brandt et al., 2003; Maksumova et al., 2005), down-regulation of insulin receptor signaling (Lammers et al., 1997, 1998; Kapp et al., 2003), and activation of the delayed rectifier, voltage-gated potassium channel Kv (Tsai et al., 1999). PTPε M has been linked to transformation of mouse mammary epithelial cells (Elson, 1999), down-regulation of insulin receptor signaling (Nakagawa et al., 2005) and inhibits ERK1 and ERK2 kinase activity by reducing their phosphorylation (Toledano-Katchalski et al., 2003). PTPε C was related to down-regulation of delayed rectifier, voltage-gated potassium (Kv) channels (Peretz et al., 2000) and selectively inhibition of IL-6- and IL-10-induced JAK-STAT signaling (Tanuma et al., 2001) and control of macrophage function (Sully et al., 2001). In flounder, PTPα and PTPε M also expressed widely as in adult mouse and rat, suggesting that their respective substrates and signaling pathways may be similar to those in mammals. The fact that PTPε C expressed predominantly in spleen and kidney, overlapping with which in mammals (Tanuma et al., 1999), seems to suggest that it plays some role in hematopoietic and immune system.
Molecular phylogenetic studies in many eukaryotic gene families have proved that the multiplicity of members in the same family rapidly increased in the first half of chordate evolution before the fish–tetrapod split by gene duplications (Iwabe et al., 1996). For hgPTPR4 in hagfish, only cDNA sequence of PTP domain D2 has been available for phylogenetic analysis. The phylogenetic position of the hagfish hgPTPR4 in the phylogenetic tree by PTP domain D2 apparently showed that it is an ortholog of human / mouse / rat / chicken / African crawed frog PTPα. At present PTPε has not been isolated from hagfish, it is thus difficult to say whether there exists PTPε in this animal. Data of PTPε from other species in this phylogenetic analysis showed that all PTPε form a cluster first and then joined with the above PTPα branch. This fact indicated that PTPα and PTPε were from a common ancestor. Judging from the phylogenetic position of the hagfish hgPTPR4 in the phylogenetic tree by PTP domain D2 of PTPR4, the duplication from the ancestor gene to PTPα and PTPε was likely before the divergence of Gnathostoma and Agnatha. The result is consistent with those of previous researches obtained from the phylogenetic analysis of PTP domains (Ono-Koyanagi et al., 2000; Andersen et al., 2001, 2004). To our limited knowledge, human PTPε is the first phosphatase reported to express both cytoplasmic and transmembrane isoform with two PTP domains. It is interesting to find that teleost fish, the evolutionarily lower Gnathostoma, had developed the function of alternative expression just after the genome duplication. The high identity of both isoforms between human and flounder strongly suggest their functionally conservative evolution. These results showed that the functional evolution of protein phosphorylation is promoted by not only genome duplication, but also elaborate regulation of gene expression.
This work was supported by grants from the National High Technology Research and Development Program of China (No. 2006AA10A404) and the National Natural Science Foundation of China (No. 30671624).
|