| Edited by Fumio Tajima. Koichiro Tsunewaki: Corresponding author. E-mail: kkcqn857@yahoo.co.jp. Note: Supplementary materials in this article are at http://wwwsoc.nii.ac.jp/gsj3/sup/83(4)Tsunewaki/ |
Since 1986, complete nucleotide sequences of chloroplast genomes of a large number of angiosperms have been reported, including those of tobacco (Shinozaki et al., 1986), rice (Hiratsuka et al., 1989), maize (Maier et al., 1995) and wheat (Ogihara et al., 2000). Complete mitochondrial genome sequences are now also available for several angiosperms, such as Arabidopsis (Unseld et al., 1997), rice (Notsu et al., 2002), maize (Clifton et al., 2004) and tobacco (Sugiyama et al., 2005). These reports, together with related studies in other plant taxa, have paved the way for systematic studies of the molecular evolution of organellar genomes and genes in land plants (Pace et al., 1986; Palmer, 1991; Burger et al., 2003; Knoop, 2004; Jansen et al., 2007). We recently completed nucleotide sequencing of the mitochondrial genome of common wheat, Triticum aestivum cv. Chinese Spring, and analyzed the evolutionary dynamics of the mitochondrial genomes of wheat, rice and maize (Ogihara et al., 2005). These sequencing studies have provided the data necessary for comparison of the nucleotide sequences of wheat mitochondrial genes with those of the wheat chloroplast genes, mitochondrial genes of other Embryophyta and prokaryotic genes. Such comparisons will provide new insights into the evolutionary origin and structural differentiation of wheat mitochondrial genes.
It is currently accepted that the mitochondrial and chloroplast genomes of eukaryotes originated from an α-proteobacterium and a cyanobacterium, respectively (see Knoop, 2004 for review). Rickettsiales, an order of α-proteobacterium, is considered the best candidate for the prokaryotic ancestor of the present day mitochondrion (Fitzpatrick et al., 2006). Pelagibacter ubique HTCC1062, a Rickettsiales species, is a cosmopolitan and free-living oceanic bacterium; it has one of the smallest genomes (1,308,759 bp) of the α-proteobacteria but possesses almost all the genes required for the basic functions of α-proteobacterial cells (Giovannoni et al., 2005). The cyanobacterium Prochlorococcus marinus MIT9312, which belongs to cyanobacterium subsection I, has various attributes that make it valuable to studies of the origin of plant chloroplast. This species has the smallest known cyanobacterial genome (1,709,204 bp, Copeland et al., unpubl.), displays primitive characters such as unicellular form and binary fission, and is positioned in a branch close to the root of the molecular phylogenetic tree for 16S-rRNA genes in cyanobacteria (Tomitani et al., 2006). The availability of the complete nucleotide sequences of the mitochondrial genome of common wheat, of other plant organellar genomes, and of prokaryote genomes, provides a new avenue for exploration of the evolutionary relationships between the genomes of α-proteobacteria, cyanobacteria and plant organelles.
C-to-U RNA editing was first identified in protozoan mitochondria (Benne et al., 1986) and shortly thereafter was shown to occur in the mitochondrial genes of wheat (Covello and Gray, 1989; Gualberto et al., 1989) and Oenothera (Hiesel et al., 1989). In evolutionary terms, this process is significant as it masks the deleterious effect of a T-to-C mutation by editing C for U after transcription, thus enabling a gene carrying this point mutation to retain its functionality. This type of editing was once considered to have developed with the emergence of tracheophyte (vascular plants) during land plant evolution (Oda et al., 1992; Hiesel et al., 1994). A later editing study of the mt cox3 gene indicated that the C-to-U editing occurs only rarely in bryophytes, greatly increasing its site in pteridophytes and gymnosperms (Malek et al., 1996). RNA editing in cereal mitochondrial genes has been reported in rice (Notsu et al., 2002), maize (Clifton et al., 2004) and wheat (Covello and Gray, 1989; Gualberto et al., 1989; and many others). These studies provide useful information for investigating the origin and role of RNA editing during cereal evolution.
In this study, we investigated the evolutionary dynamics of wheat mitochondrial genes. First, we examined the structural differentiation of organelle genes during evolution. Second, we studied the patterns of sequence mutation and divergence in these genes during cereal evolution. In the first part of the study, we compared the nucleotide sequences of mitochondrial protein and RNA genes in wheat to those of the wheat chloroplast, and to Pelagibacter ubique and Prochlorococcus marinus genes. These two prokaryotes were chosen as the referents on the basis of their primitive evolutionary characteristics. In the second part of the study, we compared the nucleotide sequences of all wheat mitochondrial genes to those of rice and maize, in order to estimate the types and frequencies of base changes and indels that have occurred during cereal evolution. These analyses have provided (1) insight into the patterns of structural differentiation of wheat mitochondrial genes, (2) support for the α-proteobacterial and cyanobacterial origins of wheat mitochondrial and chloroplast genes, respectively, (3) a proof of higher evolutionary conservativeness of mitochondrial genes, comparing to chloroplast genes, (4) phylogenetic inferences on mitochondrial genome divergence between wheat, rice and maize, (5) critical information on evolutionary variability in different mitochondrial gene groups, and (6) evidence for the effect of C-to-U RNA editing on base substitution frequency and its origin in mitochondrial genome evolution.
The structural differentiation of wheat mitochondrial (abbrev. “mt”) genes during evolution was studied by comparing the nucleotide sequences of chloroplast (“ct”) and mt genes of common wheat, Triticum aestivum cv. Chinese Spring (Ogihara et al., 2000, 2005), with genes of the cyanobacterium Prochlorococcus marinus str. MIT 9312 ("Pm") (Copeland et al., unpubl.) and the α-proteobacterium Candidatus Pelagibacter ubique HTCC1062 ("Pu") (Giovannoni et al., 2005), using the respective database accessions, NC_002762, AP008982, CP000111 and NC_007205. In some cases, gene sequences of Escherichia coli ("Ec") (Accession no. NC_000913, Blattner et al., 1997) were also included in the comparisons.
To identify mt gene mutations that have occurred during cereal evolution, complete mt genome and gene sequences of wheat, rice and maize were compared using the respective database accessions, AP008982 (Ogihara et al., 2005), BA000029 (Notsu et al., 2002) and AY506529 (Clifton et al., 2004). The pre-Poaceae history of C-to-U editing sites in cereal mt genes was investigated using the complete mt genome sequences of Marchantia polymorpha (“Mp”, liverwort; Oda et al., 1992; accession no. NC_001660), Physcomitrella patens (“Pp”, moss; Terasawa et al., 2007; accession no. NC_007945) and Cycas taitungensis (“Cy”, cycad; Chaw et al., 2008; accession no. NC_010303).
Blast 2 version Blastn 2.2.13 (http://www.ncbi.nlm.nih. gov/blast/bl2seq/wblast2.cgi?) was used to estimate sequence homology under the following settings; E-value = 10.0, low complexity filter = ON and word size = 11. Clustal W version 1.83 (Thompson et al., 1994) and MEGA4 (Tamura et al., 2007) were used for multiple sequence alignments and neighbor-joining tree construction (Saitou and Nei, 1987). RNA editing data for rice and maize mt genes were taken from Notsu et al. (2002; Database accession BA000029) and Clifton et al. (2004; AY506529), respectively, and those of wheat mt genes were taken from the studies given in the footnote 1 of Table 8.
Sequence homology between mt and ct genes may occur by three mechanisms: vertical transmission of the same ancestral prokaryote genes to both mt and ct genomes (orthologs); intracellular transfer of genes from ct to mt genome (xenologs; Schuster and Brennicke, 1988); and horizontal gene transfer across the species barrier (Richardson and Palmer, 2007, for review). No cases of horizontal gene transfer, however, have been reported in wheat. Orthologous mt genes were identified as those with the same or higher levels of gene similarity (defined below) to Pm and Pu genes compared to the corresponding ct genes.
Ct, Pm and Pu genes for 5S, 16S and 23S rRNAs were denoted rrn5, rrn16 and rrn23, respectively. Their respective Ec gene counterparts were rrfH, rrsH and rrlH. Mt (wheat), ct (wheat), Pm and Pu genes are identified by the prefixes "mt", "ct", "Pm" and "Pu", respectively, e.g., mt-rrn18, and ct-, Pm- and Pu-rrn16 for the small subunit rRNA genes of the mt, ct, Pm and Pu genomes.
The following abbreviation was used: C*; C residue subjected to C-to-U RNA editing, Cy; Cycas taitungensis (cycad), ct; chloroplast, Ec; Escherichia coli, indel; insertion and deletion (length mutation), mt; mitochondrial, nt; nucleotide, Mp; Marchantia polymorpha (liverwort), Pm; Prochlorococcus marinus (cyanobacterium), Pp; Physcomitrella patens (moss), Pu; Pelagibacter ubique (α-proteobacterium, Rickettsiales)
Conserved vs. variable region; conserved region was referred to a gene segment showing 75% or higher sequence identity between two genes in comparison, whereas variable region to the one showing less than 75% identity. Gene similarity; applied to gene pairs with conserved and variable segments and was calculated by summation of the products, [size of individual conserved segment/entire gene size] x [its sequence identity].
We carried out a BLAST search of wheat mt genes for sequence homology to ct, Pm and Pu genes. Homology was determined as gene similarity for all protein and rRNA genes, excluding tRNA genes (Table 1). Wheat mt genes not listed in Table 1 showed no significant sequence homology to all ct, Pm and Pu genes.
 View Details | Table 1 Orthology of wheat mt genes deduced from gene similarities between the corresponding mt, ct, Pm and Pu genes |
Of the protein genes, seven showed low to moderate levels of similarity to ct, Pm and/or Pu genes. Mt-atp1 had 16% similarity to both ct- and Pm-atpA, and 25% similarity to Pu-atpA; these genes encode ATP synthase subunit A, indicative of their orthology. Origin of the remaining six protein genes was not determined definitely, although the orthology of nad1a, nad5b, cob, cox1 and cox3 to the corresponding Pu genes were suspected.
As for three rRNA genes, mt-rrn5 showed no gene similarity to its ct, Pm or Pu counterpart, whereas mt-rrn18 had ca. 45% similarity to Pm- and Pu-rrn16, and a somewhat lower similarity (36%) to ct-rrn16 (Table 1), indicating orthology of mt-rrn18 to ct-, Pm- and Pu-rrn16. Similarly, mt-rrn26 had ca. 25–32% similarity to ct-, Pm- and Pu-rrn23 (Table 1), indicating orthology of mt-rrn26 to ct-, Pm- and Pu-rrn23.
The molecular structures of the three orthologous mt and ct gene pairs, rrn18/rrn16, rrn26/rrn23 and atp1/atpA, were compared to those of the corresponding Pm and Pu genes, using Ec gene as referents. No atpA homolog was found in the Ec genome. The genes were differentiated as mosaics of conserved and variable regions (Fig. 1).
 View Details | Fig. 1 Conserved (gray) and variable (open) regions in the three groups of orthologous genes. (a) Small subunit rRNA genes, (b) large subunit rRNA genes and (c) ATP synthase subunit A genes (missing in E. coli). 1–4. Conserved and variable regions of ct (wheat), Pm, Pu and Ec genes compared to the corresponding wheat mt gene (wheat mt gene coordinates). 5–8. Conserved and variable regions of mt (wheat), Pm, Pu and Ec genes compared to the corresponding wheat ct gene (wheat ct gene coordinates). |
The conserved regions of mt-rrn18, ct-, Pm- and Pu-rrn16, and Ec-rrsH, which encode a small subunit rRNA, were located at very similar positions; the exception was the Pm-rrn16/ct-rrn16 comparison, which revealed homology across the entire region of the genes (Fig. 1a). Mt-rrn18 showed higher sequence similarity to its Pm and Pu counterparts than to ct-rrn16 (Table 1). The positions of the conserved regions of mt-rrn26, ct-, Pm- and Pu-rrn23, and Ec-rrlH, which encode a large subunit rRNA, were almost the same in all comparisons (Fig. 1b). Mt-rrn26 showed higher sequence similarity to Pu and Ec genes than to its ct and Pm counterparts (Table 1; data for the Ec/mt comparison are not shown). The conserved regions of mt-atp1 and ct-, Pm- and Pu-atpA were located at almost the same positions in all comparisons, although the second conserved region was either greatly enlarged or enlarged and split into two segments in three comparisons, Pu/mt, Pm/ct and Pu/ct (Fig. 1c).
We investigated functional importance of the conserved regions using the wealth of information available on the 18S/16S rRNA genes. The regions of Ec 16S rRNA that are conserved in the 18S/16S rRNAs of the mt, ct, Pm and Pu genomes are illustrated using the secondary structure of the Ec 16S molecule taken from Yassin et al. (2005) (Fig. 2). Ghosh and Joseph (2005) numbered the helices, including loop and cap structures when present, from 1 to 45 plus 26a, and also the 5’ and 3’ ends of this molecule. Here we have added 7a, 23a, and 44a (Fig. 2).
 View Details | Fig. 2 Conserved regions of 18/16S rRNA molecules coded by wheat mt-rrn18 and wheat ct-, Pm- and Pu-rrn16, drawn side-by-side with the secondary conformation of the 16S rRNA molecule coded by the Ec-rrsH gene (redrawn from Yassin et al., 2005). The stems and stem-loop structures of the molecule are shown by the consecutive Arabic numerals in circles, 1–45, with the addition of 7a, 23a, and 44a. Nucleotides of the Ec 16S RNA molecule are numbered every 20th nucleotide with small Arabic numerals. Thick dark blue line: conserved in all mt and ct (both of wheat), Pm and Pu genes. Thin red, green, sky-blue and orange lines: conserved respectively in mt, ct, Pm and Pu genes. Colored dot: Point mutations affecting cell growth; mutations with a strong deleterious effect are shown in red, those with a moderate effect in blue, and those with a mild effect in yellow. |
A summary of the reported functions of these helices and ends is given in Table 2. Details of their position (rrsH-coordinates), strand makeup (conserved vs. non-conserved strands), and functions are given in Supplementary material 1. In this section, the term, “conserved”, is used to indicate Ec 16S rRNA segments that retained the sequence identity of 75% or higher to the corresponding segments of all four 18S/16S rRNA molecules encoded by wheat mt, wheat ct, Pm and Pu genes, whereas “non-conserved” is for those that showed less than 75% sequence identity to the corresponding region(s) of one or more of the four 18S/16S rRNA molecules. Of the 13 functions listed in Table 2, all but three are attributed to helices that consist of two conserved strands. The exceptions are RNA-RNA cross-linking and 30S subunit assembly, which involve an almost equal number of conserved and non-conserved helices. In total, 20 of the 29 fully conserved helices and three of the six semi-conserved helices (consisting of one conserved and one non-conserved strand) carry known functions, whereas only three of the 13 non-conserved helices have known functions. We conclude that functionally important regions of the Ec rRNA molecule show strong structural conservation in the genomes of the two other prokaryotes and two wheat organelles.
 View Details | Table 2 Functions reported for the helices of Ec 16S rRNA, excluding S-protein binding |
Yassin et al. (2005) determined the sites of 53 point mutations that caused cell growth retardation in E. coli. Powers and Noller (1990), O’Connor et al. (1992), and Dragon et al. (1996) reported one or two additional point mutations that also affected cell growth (Fig. 2). Fifty of the 57 reported mutations are located in regions conserved in the four other genomes. All sites that express strong mutation effects are located in these regions. We investigated the nucleotide sequences of the Pm, Pu, ct and mt rrn16/18 genes corresponding to those of the mutation sites in E. coli (Table 3). Fifty of the 57 mutation sites shared the same nucleotide sequences in all five rrn18/16 genes. The frequency of nucleotides that differed between Ec-rrsH and mt, ct, Pm or Pu genes ranged only from 3.5% for Pm-rrn16 to 7.0% for mt-rrn18. In contrast, the frequencies of sites having different nucleotides between Ec-rrsH and other rrn16/18 genes over the entire gene region were 45.4, 26.4, 26.5, and 27.2% for mt, ct, Pm and Pu genes, respectively (data not shown). Thus, there was considerably greater conservation of nucleotides within the 57 mutation sites than across the genes in general. This fact further indicates the evolutionary conservation of functionally important sites in the 18/16S rRNA genes.
 View Details | Table 3 Deleterious mutation sites in Ec rrsH gene and their corresponding nucleotides in the Pm, Pu, and wheat ct rrn16 gene and wheat mt rrn18 gene |
Orthologous genes encoding small and large subunit rRNAs and ATP synthase subunit A were found in the mt and ct genomes of wheat, and the Pu and Pm genomes. Here, we examined whether the present sequence data support the contemporary hypothesis that mt and ct genomes originated from an α-proteobacterium and a cyanobacterium, respectively. The mosaic patterns of conserved and variable segments in the mt and ct genes rrn18/16, rrn26/23 and atp1/A (Fig. 1), clearly indicated that the mt genes had greater similarity to the corresponding Pu than Pm and ct genes, whereas the ct genes had greater similarity to the Pm than Pu and mt genes.
The phylogenetic relationships of these genes were analyzed further by constructing neighbor-joining trees (Fig. 3). In all three trees, mt genes formed a clade with the Pu orthologs, and ct genes formed another clade with Pm orthologs. The branches defining these mt-Pu and ct-Pm clades were supported by 1,000/1,000 bootstrap probabilities. These results indicate that the three mt genes grouped with the α-proteobacterium genes and the corresponding ct genes grouped with the cyanobacterium genes; these analyses provide a corroborative support for the current hypothesis on the origin of the two plant organellar genomes.
 View Details | Fig. 3 Neighbor-joining trees of the orthologs of the wheat mt genes atp1, rrn18 and rrn26. The proportion of sites at which two genes have different nucleotides was used as the genetic distance. Numbers on the branches show the number of times a clade appeared in 1,000 bootstrap samples. a, b and c: Trees of atp1, rrn18 and rrn26 orthologs, respectively. |
Wheat, rice and maize belong to three different subfamilies of the monocot family Poaceae: Pooideae (wheat), Bambusoideae (rice) and Panicoideae (maize). This family is estimated to have evolved 65 million years ago (Prasad et al., 2005). We investigated the variable sites that exist in all mt genes of the three cereals, with tobacco as the referent (data not shown). Of the 28,148 sites examined, 1,985 (7.05%) were variable among the four species. A neighbor-joining tree based on these variable sites showed that the bootstrap support for the wheat-rice clade is low (53%) (Fig. 4a), indicating almost the same level of mutual differentiation of the cereal mt genes from those of their most recent common ancestor. A neighbor-joining tree also was constructed for ct genes by the same approach. Again the bootstrap support (88%) for the wheat-rice clade was not significant (P < 95%) (Fig. 4b).
 View Details | Fig. 4 Neighbor-joining trees of mt (a) and ct (b) genes based on the variable sites of the organellar protein genes of wheat, rice, maize and tobacco. The proportion of sites at which two species have different nucleotides was used as the genetic distance. The number on the branch shows the number of times a clade appeared in 1,000 bootstrap samples. |
We examined frequencies of transition and transversion occurred between all mt genes of the three cereals, which were compared to those of the ct genes (Table 4). Using these data, we estimated, after Kimura (1980), the number of base substitutions per site (Kimura’s distance) and the transition/transversion ratio for all genes in each of the mt and ct genomes (Table 5). In both of them, the number of base substitutions per site was lower in all genes pooled than protein genes alone, indicating lower frequencies of the base substitutions per site in RNA genes (data not shown).
 View Details | Table 4 Numbers of transitions (ts) and transversions (tv) observed between organellar genes of three cereals |
 View Details | Table 5 Number of base substitutions per site (Kimura’s distance, d; lower left-hand section) and transition/transversion ratio (R; upper right-hand section) observed between organellar genes of three cereals; estimated after Kimura (1980) |
In both gene categories, the number of base substitutions per site of the mt genes was only two-fifths of that of the ct genes (Table 5). These facts indicated that the cereal mt genes evolved much more slowly than their ct genes. It was known for a long time that the rate of nucleotide substitution is lower in the mt than ct genes (Wolfe et al., 1987; Palmer and Herbon, 1988). On the basis of the genome-wide comparison, the present results showed for the first time that this trend holds true for the cereal mt and ct genes.
Transition (ts)/transversion (tv) ratio of the cereal mt genes also was only two-fifths of that of the ct genes, of which range was between 0.7 and 0.9 for the former and between 2.0 and 2.3 for the latter (Table 5). Reason for the difference observed between the mt and ct genes is unknown. The ts/tv ratio is known to vary greatly between mt genes, up to 15 fold, comparing to a narrow variation range of nuclear genes between 0.5 and 2 (Nei and Kumar, 2000). The ts/tv ratio of cereal mt genes is much low, comparing to those known for animal mt genes, whereas that of the cereal ct genes was close to the upper bound reported for nuclear genes.
Nucleotides varied at 806 of the 35,973 sites examined in the mt genes of the three cereals (Table 6). The direction of nucleotide (or ‘base’) substitution at each variable site was inferred as follows: when two of the three cereals possessed nucleotide M in common and the third had nucleotide N, we assumed that M was the prototype nucleotide and that N originated from M by mutation. Our first step was to examine the validity of this assumption. Assuming that the three cereals diverged at almost the same time from their common ancestor (see above), presence of a common nucleotide, M, in two cereals and N in the third is unlikely to be due to a N-to-M substitution in the common lineage of the former two after separation of the third cereal. Another possibility is independent N-to-M substitutions in two cereals. This possibility is also unlikely because the substitution frequency per site was less than 0.02 for any change, with an average of 0.0083 for protein genes (Table 6). This indicates a nearly negligible likelihood (7.0 × 10⁻⁵) of the same substitution at identical sites in two cereals. The validity of our proposed assumption was further supported by comparison of the prototype nucleotides at variable sites in the cereals with those of tobacco (Table 7). We identified the corresponding nucleotides of tobacco mt genes at 542 of 723 variable sites in cereal mt genes. The nucleotides of the cereal prototype and the tobacco mt genes were the same at about 77% of the variable cereal sites. Thus, tobacco and cereal prototype genes retained common nucleotides at the majority of sites. Overall, therefore, we suggest that our assumption on the direction of base substitution at the variable sites of cereal mt genes is justified.
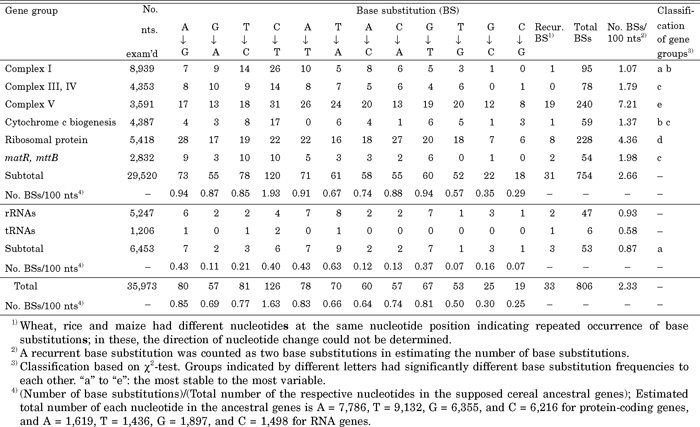 View Details | Table 6 Frequencies of the 12 types of base substitution (BS) observed in the eight mt gene groups of wheat, rice and maize |
 View Details | Table 7 Proportion of sites having the same nucleotides (nts) in mt protein genes of putative cereal prototype and tobacco, which correspond to the cereal variable sites |
All three cereals possessed different nucleotides at 33 sites, indicating recurrent substitutions at those sites. Counting such recurrent events as two substitutions, the overall base substitution frequency was 2.33/100 nts. This estimate is approximately one hundred times higher than that reported for five maize mitochondrial genomes, 1.65–7.04/10 kb (Allen et al., 2007), in agreement with a much longer divergence time between the three cereals compared to the five maize lines. The base substitution frequency of protein genes (2.66%) in the three cereals was three times higher than that of RNA genes (0.87%), indicating high evolutionary variability of protein genes in cereals. One possible cause of this high variability is the occurrence of synonymous base substitutions in protein genes (Nei and Kumar, 2000). The frequencies of base substitutions varied greatly between the five protein gene groups (1.07–7.21%). The Complex I gene group was as stable as the RNA genes, whereas Complex V was most variable; the ribosomal protein gene group showed the second highest variability, and the other groups had intermediate variability (Table 6).
On the basis of the assumption described above, we estimated the frequencies of the 12 possible base substitutions in cereal mt genes (Table 6). The total numbers of the four nucleotides in ancestral protein genes of cereals were estimated to be A = 7,786, T = 9,132, G = 6,355 and C = 6,216, and A = 1,619, T = 1,436, G = 1,897 and C = 1,498 for the ancestral RNA genes. Pair-wise χ2-tests revealed a high frequency of C-to-T base substitutions and a low frequency of C-to-G and G-to-C substitutions in protein genes. Other types of base substitution occurred at an intermediate level. The high incidence of C-to-T substitution was ascribed to C-to-U editing (see next section), but the reasons for the low rates of C-to-G and G-to-C substitutions were not clear.
RNA editing has been examined for all protein genes of rice (Notsu et al., 2002), 21 genes of wheat (references in footnote 1 of Table 8) and nine genes of maize (Clifton et al., 2004) (Table 8). Of the 120 sites at which a C-to-T transition was detected (ref. Table 6), 100 were examined for RNA editing in wheat, rice and/or maize. Similarly, RNA editing was examined at 46 of the 78 sites at which T-to-C transition occurred (Table 8). The numbers of synonymous and non-synonymous codon changes involving the four possible transitions at the DNA and edited RNA levels are shown in Fig. 5. For the A-to-G and G-to-A transitions, the frequencies of synonymous and non-synonymous codon changes at the DNA and RNA levels are the same because there is no editing of A and G residues. For C-to-T and T-to-C transitions, the frequencies of the changes differed between the DNA and RNA levels. At the edited RNA level, the proportion of non-synonymous base changes was reduced by C-to-U editing from 57.5% to 25.8% in C-to-T transitions and from 57.7% to 47.4% in T-to-C transitions. As a result, the numbers of non-synonymous base changes were almost the same at the edited RNA level between the four transitions, despite the extremely high frequency of C-to-T transitions at the DNA level. These facts suggest that C-to-U editing reduced selection pressure against C-to-T base changes, and to a lesser extent against T-to-C changes. As a consequence, the editing caused an excess accumulation of the C-to-T base change compared to A-to-G and G-to-A transitions in cereal mt genes (ref. Table 6).
 View Details | Table 8 Number of RNA editing sites in the mt genes of three cereals |
 View Details | Fig. 5 Numbers of transition-type base changes resulting in synonymous and non-synonymous codon changes before and after C-to-U RNA editing. D indicates DNA level, and R indicates RNA level after editing. |
C-to-U RNA editing enables protein structure to be maintained after a T-to-C mutation has occurred in the sense strand of the protein gene (Gualberto et al., 1989; McClean, 1998; Regina et al., 2002). This editing process can thus reduce selection pressure against this mutation. Editing of C residue at the T-to-C transition sites may bring about this effect in cereal mt genes. For this, we must expect that frequency of C-to-U editing is higher in the T-to-C than C-to-T transition sites. However, both the absolute and relative editing frequencies of C-residues at the C-to-T transition sites were about five times (43/9) and two times (43%/20%) higher than those in the T-to-C transition sites, respectively. It appears as if plants could foresee occurrence of C-to-T mutation and prepare for neutralization of its effect by initiating C-to-U editing for the C residues at the C-to-T transition sites.
Of course, we should not expect such ability of foresight for plant. To find out a reasonable explanation, we investigated past nucleotide changes in sites corresponding to the cereal C-to-T and T-to-C transition sites. The complete mt genome sequences were known for 11 tracheophyte (angiosperm) species, however, none of these species belonged to more primitive taxa than Poaceae in the angiosperm phylogenetic tree (ref. Soltis et al., 2000; Sanderson and McMahon, 2007). Complete mt genome sequences were reported for three lower taxa, Cycas taitungensis, a gymnosperm species (cycad) (Chaw et al., 2008) and two bryophyte species, Physcomitrella patens (moss) and Marchantia polymorpha (liverwort) (Terasawa et al., 2007; Oda et al., 1992). The types of the prototype nucleotides at the cereal C-to-T and T-to-C transition sites and those of cycad, moss and liverwort at the corresponding sites were investigated, with those at A-to-G and G-to-A transition sites as a reference (Supplementary material 2).
Totally, 326 cereal transition sites were examined (Table 9). Due to alignment difficulties, corresponding nucleotides could not be determined at 58 (18%), 176 (54%) and 171 (52%) sites in the comparisons with cycad, moss and liverwort, respectively. Frequency of unidentified nucleotides was three times higher in two bryophytes than cycad in parallel with their divergence time to angiosperm. Excluding those unidentified sites, frequencies in percentage of four nucleotides in cycad, moss and liverwort mt genes at the sites corresponding to six types of cereal transition sites were depicted (Fig. 6).
 View Details | Table 9 Frequencies of four nucleotides in the mt genes of Cycas taitungensis (cycad), Physcomitrella patens (moss) and Marchantia polymorpha (liverwort) at their sites corresponding to the cereal transition sites1) |
 View Details | Fig. 6 Frequencies in percent of four nucleotides in the mt protein genes of Marchantia polymorpha (Mp), Physcomitrella patens (Pp), Cycas taitungensis (Ct) and the putative cereal ancestor (Cr), which were identified at the sites corresponding to six types of cereal transition sites. Nucleotide sequences of the Marchantia, Physcomitrella and Cycas mt genes were referred to Oda et al. (1992), Terasawa et al. (2007) and Chaw et al. (2008), respectively. Number on each column top: Number of nucleotides identified in each material, C* and C: C residue subjected and not subjected to C-to-U RNA editing, respectively. |
Nucleotides corresponding to C*-to-T sites were mostly T residue in two bryophyte species, whereas most and all of them were C in cycad and cereal ancestor, respectively (Fig. 6a). All those C residues in the cereal ancestor mutated to T during cereal divergence. Malek et al. (1996) showed that a 381 nt region of mt cox3 gene of nine pteridophyte and three gymnosperm species has 11.9 C-to-U editing sites on the average, whereas the same cox3 region of six bryophytes has only 3.2 editing sites. Chaw et al. (2008) predicted more than 1,000 putative editing sites for 39 cycad protein genes, although they did not specify their sites within individual genes (this work is under way; Chaw’s personal communication). Those results altogether indicated that the majority of bryophyte T residues corresponding to the cereal C*-to-T transition sites mutated to C at early stage of vascular plant evolution, followed by initiation of C-to-U editing for the mutated C residues. Most C residues corresponding to cereal C*-to-T transition sites had prehistory of T-to-C transition. Thus, C-to-U editing of those C residues resulted in selective neutrality of the C-to-T back mutation. Our results also indicated that ca. 10% of cycad nucleotides corresponding to the cereal C*-to-T transition site were T residue (Fig. 6a). This fact may imply that ca. 10% of the cereal C*-to-T transition sites underwent T-to-C transition, followed by initiation of C-to-U editing, in the cereal common ancestor after separation of the angiosperm from gymnosperm lineage.
In contrast, bryophyte nucleotides at the sites corresponding to two types of the cereal transition sites, T-to-C* and T-to-C, were exclusively or almost exclusively T residues (Fig. 6c, d and Supplementary material 2). Some of those bryophyte T residues underwent T-to-C transition, probably followed by initiation of C-to-U editing, in emergence of gymnosperm (cycad), of which proportion was estimated to be about one-fourth of the bryophyte T residues from the pooled B-1 and B-2 data (Table 9; this pooling was done because B-1 alone did not give reliable estimate due to very small sample size.). The mutated cycad C residues mutated back to T before emergence of the cereal common ancestor. Majority of the remaining bryophyte T residues remained unchanged in gymnosperm and transmitted to the cereal common ancestor. All the T residues of the cereal common ancestor corresponding to the cereal T-to-C* and T-to-C transition sites underwent transition to C residue during cereal divergence.
Fig. 7 illustrates the origin of C-to-U RNA editing in land plant evolution, although the picture is coarse due to lack of sufficient editing information in lower land plants. In brief, ca. 90% of C-to-U editing occurring at the cereal C*-to-T transition sites was initiated in the early stage of vascular plant evolution and the remaining 10% in the angiosperm evolution before the emergence of the cereal common ancestor. On the contrary, about one-fourth of C-to-U editing at the cereal T-to-C* transition sites seems to have initiated in the early stage of vascular plant evolution and the remaining three-fourths along with cereal divergence. Significantly higher incidence (χ2 = 7.578, df = 1, P = 0.01) of C-to-U editing in the C-to-T transition sites (43 editing vs. 57 non-editing sites) than T-to-C transition sites (9 editing vs. 37 non-editing sites) is attributable to the difference in initiation time of the editing, most of the former being in emergence of the vascular plant, whereas most of the latter during cereal divergence.
 View Details | Fig. 7 Possible evolutionary origin of the C-to-U editing occurring at the C-to-T and T-to-C transition sites of cereal mt genes. Proportion: (Number of edited or non-edited sites)/(Total number of C-to-T or T-to-C transition sites examined for the editing). |
Fifty-five indels were found in a comparison of the mt genes between the three cereals (Table 10). Details of the sequence comparison for individual indels and their 15-bp 5’- and 3’-flanking regions are given in Supplementary material 3.
 View Details | Table 10 Indels and associated repeats observed in mt genes of wheat (W), rice (R), and maize (M) |
When two of the three cereals had a common sequence and the third had an insertion, deletion, or substitution, this indel was considered to have occurred in the lineage of the third cereal. In the present instance, “substitution” refers to the insertion into the gene under comparison of a segment of different size and sequence at a given site, but sandwiched by the same sequence-conserved segments; two examples are the sequences numbered 7 and 19 in Supplementary material 3. The sequences of six of the 55 indels were compared only between wheat and maize, and one between rice and maize only, because of deletion of the corresponding sequences in the third species. For this reason, the origin of those seven indels could not be determined (Table 11). The number of unique indels was 2.5 times larger in maize than wheat and rice. This difference was significant at the 1% probability level (χ2 = 11.375, df = 2, P = 0.01). This significantly higher rate of indels in maize indicated higher structural instability of the maize mt genes.
 View Details | Table 11 Number of indels unique for each of the three cereals |
The ratio of indels to base substitutions between five maize cytotypes fell within the range 0.73 to 1.45 (Allen et al., 2007), whereas it was 0.26 between two rice subspecies (Tian et al., 2006). Allen et al. (2007) argued that the difference between maize and rice might be due either to an unusually low substitution frequency or a particularly high indel frequency in maize. Our results indicated that the base substitution frequency did not differ between three cereals (Table 5), suggesting that the maize mt genome is characterized by high incidence of indels, in agreement to the above finding.
Indels ranged in size from 1 to 260 nucleotides (Table 12). In protein genes, in-frame indels (three or multiples of three nucleotides) accounted for 86% of the insertions and deletions and for 100% of the substitutions. As for the four out-of-frame indels, a 4-nt deletion in maize rps1, that was linked with a 1-nt insertion at the 6th nucleotide downstream, resulted in a single amino acid deletion and replacement of two amino acids; a 1-nt deletion in rice rps3 caused 23 and 21 amino-acid truncation of its product compared to wheat and maize genes, respectively; and a 5-nt insertion near the 3’-end of wheat ccmFN caused 5 and 31 amino-acid truncation of the product compared to rice and maize ccmFN, respectively. With regard to substitutions, insertions and deletions of variable sizes occurred in combination and, as a result, no frame shift was caused in any of the genes that carried the substitutions.
 View Details | Table 12 Size of indels observed in wheat, rice, and maize mt genes |
The nucleotide sequences of all 55 indels and their 5’- and 3’-flanking regions showed that most were associated with direct repeats, either tandem or non-tandem (Table 10). This association of indels with direct repeats is summarized in Table 13. Imperfect repeats are those that have an extra nucleotide in one of the two repeat sequences or those in which the repeat sequence stretches one nucleotide beyond the indel’s border. Of 55 indels, 31 (56%) were associated with perfect direct repeats, and 11 (20%) with imperfect repeats. The probability of the same dinucleotide sequence at both the 5’-end and the 3’-flanking region of an indel is 1/16, assuming random occurrence of the four nucleotides. The same probability is expected of the same dinucleotide at both the 3’-end and the 5’-flanking region of the indel. Thus, there is a 1/8 probability of having the same dinucleotide at either the 5’-end and 3’-flanking region or the 5’-flanking region and 3’-end of an indel. The actual frequency of perfect direct repeats (31/55) was significantly higher than the frequency expected from this probability (χ2 = 96.751, df = 1, P = 0.01). Additionally, 11 indels were associated with imperfect direct repeats. These facts together suggested that short direct repeats mediated production of most of the indels detected in the mt genes of the three cereals. Deletions result from intra-molecular recombination between direct repeat sequences in the mt master circle molecule, and insertions by inter-molecular recombination between repeat sequences that are present in a master and subgenomic circle which are known to exist in the plant mt genome (Lonsdale et al., 1988; Fauron et al., 1995). Substitutions may occur by combinations of deletions and insertions mediated by the same or different repeat sequences. In addition, the association of tandem direct repeats, perfect or imperfect, with eight indels suggested the possible involvement of slippage during DNA synthesis in the production of this type of indel (Schlotterer and Tautz, 1992).
 View Details | Table 13 Association of indels with direct repeats |
About 90% (37/42) of the repeats associated with indels were di- or trinucleotides in size. The 25 dinucleotide repeats contained 11 of the 16 possible dinucleotide sequences, CT(4), TG(4), CC(3), GG(3), AA(2), AG(2), TA(2), TC(2), AC, CG, and TT (the frequency of repeats that occurred twice or more is given in parentheses). Similarly, 10 of the 64 possible trinucleotide sequences were detected among 12 trinucleotide repeats, AAA(3), AGA, CTA, GAC, GAG, GCC, GCT, GTA, TGT, and TTT, with all but AAA occurring only once. Each of five repeats larger than a trinucleotide sequence also occurred only once. This indicated that there was no especial preference for involvement of direct repeats of particular sizes and sequences in the production of indels.
Valuable help and suggestions given by Naoyuki Takahata, Graduate University for Advanced Studies, Hayama, and Shozo Osawa and Hiroshi Hori (both Emeritus Professors), Nagoya University, Japan, are deeply appreciated. This work was supported by a Grant-in-Aid (No. 12309008, 2000–2002) from the Japan Society for the Promotion of Sciences and by research grants from the Iijima Memorial Foundation for the Promotion of Food Science and Technology (2003 and 2004), and the Nisshin Seifun Foundation (2001 and 2004), all given to K. Tsunewaki. Publication costs were covered by a grant for Scientific Research on Priority Areas, “Molecular Mechanism of Speciation”, from the Ministry of Education, Culture, Sports, Science and Technology, Japan, provided to Y. Ogihara.
|