| Edited by Koji Murai. Toshinobu Morikawa: Corresponding author. E-mail: morikawa@plant.osakafu-u.ac.jp |
The genus Avena consists of cultivated, wild, and weedy species, which form a polyploid series of diploids, tetraploids and hexaploids with a basic chromosome number of x = 7. The species are classified according to ploidy, genomic composition, and unit of dispersal (type of floret disarticulation). Species sharing common genomes are interfertile and are members of a single biological species. A classification such as that proposed by Ladizinsky and Zohary (1971) appears to be inconsistent with the biological species concept, impractical for easy identification and confusing for weed scientist and for the grain trade. Structural differentiation of chromosomes has played an important role in the evolution of the Aveneae at diploid level. Seven cytologically distinct genomes have been classified according to their karyotypes and paring behavior in their hybrids (Rajhathy and Thomas, 1974; Nishiyama and Yabuno, 1975). Diploid species have either the A or the C genome. Tetraploids have either the AB or the AC genomes and the hexaploids have the ACD genome designation. No diploid species have ever been identified with the B or D genome. The A genome diploid species consist of five different minor genomes, As, Al, Ad, Ap and Ac according to the different karyotypes and chromosome paring behavior in the interspecific hybrids. The C genome diploid species consist of two different minor genomes, Cv and Cp according to the different karyotypes. The main chromosome differentiation is observed between the species belonging to the A and C genomes which is revealed by genomic in situ hybridization (Hayasaki et al., 2000) and the failure of their crosses. A monograph of oats was published by Baum (1977) and all necessary taxonomic and nomenclatural keys were described according to the morphology, ecology and geographic distribution of the species. However, there is no system that facilitates easy identification and reflects important biological information about Avena species. Moreover, the genomic relationships between and the origin of the B genome of tetraploid and the D genome of hexaploid did not lead to identification of any likely progenitor species.
It is clear that molecular analyses have been successfully applied to many questions regarding the origin of crop plants. RFLP, AFLP and RAPD have been used to compare the genetic intra- and inter-specific relationships in a species like oat, as it is rich in repetitive DNA. No major clustering differences of the genus Avena were present between phenograms produced with AFLPs and RAPDs (Drossou et al., 2004). Slight differences in the A genome diploid oats were observed in the intra- and inter-specific relationships found with the two types of markers, RFLP and RAPD. The similarity coefficients were consistently higher in the RFLP analysis (Nocelli et al.,1999).
Linares et al. (1998) described molecular structure and chromosomal organization of the As120a repeated sequence isolated from the A. strigosa genome. The nucleotide sequence determination showed that the fragment was composed of a tandemly repeated DNA sequence adjacent to an unrelated sequence. The As120a sequence could be classified as a satellite DNA sequences. Satellite DNA has been shown to be preferentially located in constitutive heterochromatin (Smyth, 1991). It can be used extensively for clarifying the genome families that appear to have become differently organized during the evolution of oat species.
Seed storage protein can be used to determine relationships between genomes belonging to different species. Chesnut et al. (1989) reported that oat seed storage proteins, avenin (oat prolamine) and globulin both form a multi-gene family. The prolamine and globulin are a highly heterogenous fraction of cereal storage proteins. Due to high genotypic peculiarity, the RFLP of the avenin and globulin can be used as reliable genetic markers in variety identification, assessment of genetic diversity and evolution studies.
The main objectives of the present study were to determine if molecular marker distances among diploid, tetraploid and hexaploid species of Avena agree with genome divergences and to compare the genetic intra- and inter-ploidy relationships produced by RFLPs of repetitive DNA in oat, which is rich in repetitive DNAs.
Twenty three species consisted of 29 accessions are the subject of the present study. The accessions and their source are listed in Table 1. Eleven diploid species with 15 accessions, 8 tetraplod species with 9 accessions, and 4 hexaploid species with 5 accessions were included. A. damascena, A. hirtula, A. strigosa, A. ventricosa A. barbata and A. sativa are represented with 2 or 3 accessions since intraspecific polymorphism was found to exceed interspecific polymorphism.
 View Details | Table 1 List of Avena species analyzed in this study |
Seeds were germinated in a laboratory dish on a moistened filter paper. After the germination, seedlings were grown in a greenhouse under 12 h photoperiod at 25°C. Total DNA was extracted from young leaves of one-month-old seedlings. A bulk of five plants per accession was used. Total genomic DNA was extracted using the modified CTAB method by Gawel and Jarret (1991).
Primer sequences were taken from published nucleotide sequence data of avenin, prolamine (Shotwell et al., 1990) and 12S globulin (Shotwell et al., 1990), seed storage proteins of A. sativa L. and a satellite DNA sequence, As120a, specific to the A genome of A. sativa and A. strigosa (Linares et al., 1998) in a DNA database (GeneBank, http://www.genome.ad.jp/dbget-bin). The primer sequences used for the detection of polymorphism of PCR-RFLPs in Avena species are listed in Table 2. The primer sets were designed by using software GENETYX-MAC selecting primers from a DNA sequence.
 View Details | Table 2 PCR-RFLP primers used for the detection of polymorphism in Avena species |
Template genomic DNA 1.6 μl (20 ng/μl) was mixed with 0.4 μl of primers, 2 μl of 10 × Buffer for rTaq, 2 μl of 2 mM dNTPs mixture, 1.2 μl of 25 mM MgCl2, 0.2 μl of 5U rTaq polymerase (TOYOBO Biochemicals, Japan) and 12.2 μl of H2O in final volume of 20 μl for each sample. DNA was amplified under the following conditions: a 3-min denaturation at 94°C; 45 cycles of a 1-min denaturation at 94°C, a 1-min annealing at 62°C, and a 1-min extension at 72°C and a final extension at 72°C for 7 min. For DNA amplification of the globulin, the annealing temperature was lowered to 59°C and the extension time was prolonged to 2 min. The PCR products were electrophoresed on 2% agarose gel containing TAE buffer and stained with ethidium bromide. Following subclonings, the amplified PCR products of As120a in A. strigosa, avenin and globulin in A. sativa were sequenced by using ABI automatic genetic analyzer 3100. Specific amplification of the target sequences was confirmed by comparison of sequences with those in the GeneBank database by utilizing a program BLAST (Altschul et al.,1990). Their accessions were AJ00192 (As120a), J05486 (avenin) and J5485 (globulin).
For detecting the cleaved amplified polymorphic sequence, the PCR product was treated with 11 different restriction enzymes, BamHI, EcoRI, EcoRV, HaeIII, HindIII, HincII, HpaI, MspI, PstI, SacII and XhoI according to the manufacturer’s protocols. The digested samples were loaded on 3% agarose gel containing TAE buffer and run at 100 V for 60 h at room temperature, and the gel was stained with ethidium bromide.
Restdist, a module of PHYLIP computer package ver.3.67 (Felsenstein, 2007) was used to compute distance matrix from restriction sites or fragments. The Restdist reads the restriction sites format and computes a restriction fragments distance. It can also compute a restriction sites distance. The restriction sites distance data coded for the presence of absence of individual restriction sites. The distance starts by computing from the particular pair of species the fraction, f = n++/[n++ + 1/2 (n+– + n–+)], where n++ is the number of sites contained in both species, and n+– is the number sites present in the first of two species but not in the second, n–+ is the number of sites present in the second of two species but not in the first. The resulting distance should be numerically close to the original restriction sites distance of Nei and Li (1979) when divergence is small.
Cluster analyses were performed using neighbor-joining method of Neighbor ver. 3.67, a module of the PHYLIP computer package. The correlation between the distance matrices for each restriction sites was computed. Comparisons between the RFLP data produced with As120a, avenin, and globulin primers were carried out using the Mantel test (Mantel, 1967). All of the above analyses were performed using SAS statistical package ver. 9.1 for windows.
Drawgram, a module of the PHYLIP computer package was used to plot a phenogram, rooted tree diagram by utilizing the data matrix of the restriction fragment distances.
Amplification of three genomic repeated DNA sequences followed by digestion with 11 restriction enzymes generated a total 78 polymorphic fragments in the diploid Avena species. No polymorphisms were detected by digestion of amplified DNA with four restriction enzymes (BamHI, EcoRI, EcoRV and SacII) due to absence of the restriction sites (Table 3). The primer set for As120a was designed to amplify the 539 bp DNA sequence of A. strigosa containing two recognition sites of HincII and one site of HpaI (Fig. 1). The original PCR products of As120a were obtained from all the diploid, in which the number of amplified fragments detected by gel electrophoresis was one, two or three. This means that As120a is not a As genome specific repeated sequence, but was also present in all the other different genomes. The amplified DNAs of the As120a in the diploid species were digested with HindIII, HincII (Fig. 2a), HpaI and XhoI to examine polymorphisms. The As120a sequences involved restriction sites of HindIII and XhoI in the other diploid species than A. strigosa. Nineteen fragments were detected in the As genome, which were almost the same numbers as those in the Cp and Cv genome. A fewer number of amplified fragments were observed on the two diploid taxa, A. canariensis (Ac) and A. damascena (Ad). Percentage of polymorphic fragments was 81.8 in the As120a.
 View Details | Table 3 Number of fragments per primer, number of fragments per genome, and number of polymorphic fragments among the 15 samples and among the 7 diploid genomes of Avena species |
 View Details | Fig. 1 The restriction maps of the target DNA sequences of As120a in A. strigosa (As4), avenin in A. sativa (ACD4), and globulin in A. sativa (ACD4). Horizontal and vertical arrows indicate positions of primers and restriction sites, respectively. Sizes of amplified DNA are indicated above the map. |
 View Details | Fig. 2 PCR-RFLP patterns detected in the 15 accessions of 11 diploid oat species. PCR-amplified DNA fragments of As120a (a), avenin (b), and globulin (c) were digested with HincII, HaeIII, and HaeIII, respectively, and separated by gel electrophoresis. Each lane is indicated by code name according to Table 1. M indicates DNA molecular marker from 100 bp to 2000 bp. |
The primer set for avenin was designed to amplify the 529 bp DNA sequence of A. sativa involving two recognition sites of HaeIII, three sites of MspI and one site of PstI (Fig. 1). The original PCR product of avenin was detected as one band by electrophoresis in diploid species except for Ad genome (two bands). The amplified DNAs were digested with HaeIII (Fig. 2b), MspI, and PstI to detect restriction fragments. They produced a total of 28 fragments per primer, all of which were polymorphic (100%).
The primer set for globulin was designated to amplify the 1675 bp DNA of A. sativa involving one recognition site of HindIII and three sites of HaeIII (Fig. 1). The single original PCR product of globulin was detected by electrophoresis in all the species. The amplified DNA was digested with HpaI, HindIII and HaeIII (Fig. 2c) to detect restriction fragments. There was a HpaI restriction site in the parts of AB, AC and ACD genome polyploids but no site in diploid species. HpaI, HindIII and HaeIII produced a total of 26 fragments per a primer set, 88.5% of which were polymorphic fragments in the globulin.
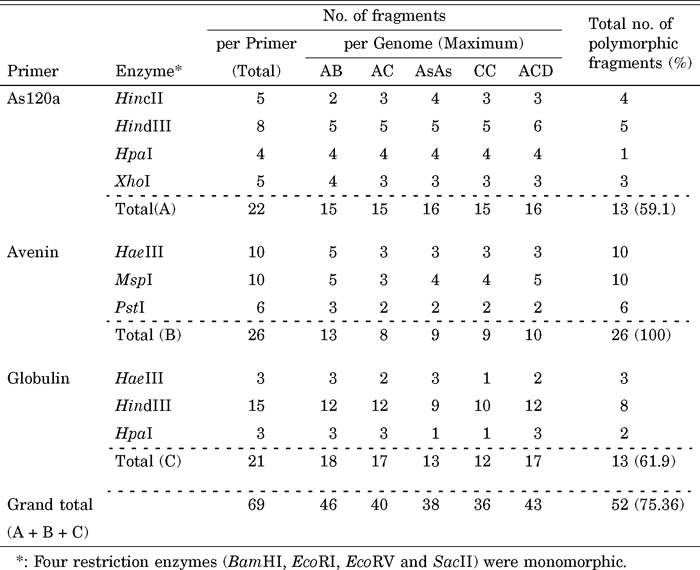
The three repeated DNA sequences, As120a, avenin and globulin, and seven restriction enzymes used produced a total of 69 polymorphic fragments in tetraploid and hexaploid Avena species (Table 4). The As120a sequences digested with HindIII, HincII (Fig. 3a), HpaI and XhoI enzymes produced a total of 22 fragments in the tetraploid and hexaploid genomes. Out of which, 13 fragments were polymorphic. The percentage of the polymorphic fragments was 59.1 in the tetraploids and hexaploids, which was lower than the diploids. The avenin sequences digested with HaeIII (Fig. 3b), MspI, and PstI in tetraploid and hexaploid species detected 26 polymorphic fragments, which produced the highest number of polymorphic fragments (100%) ranging from 8 to 13 in the three repeated DNA sequences used. The globulin sequences digested with HpaI, HindIII and HaeIII (Fig. 3c) produced a total of 21 fragments per primer, 61.9% of which were polymorphic fragments in the tetraploid and hexaploid species. The number of polymorphic fragments estimated over the 14 taxa of tetraploid and hexaploid reach a lower percentage (75.36%) than that observed in the 15 taxa of diploid species (89.7%). The results indicated that the repeated DNA sequences are a major component of oat plants. Additivity of parental repeated sequences patterns was not detected in hybrids and allopolyploids
 View Details | Table 4 Number of fragments per primer, number of fragments per genome, and number of polymorphic fragments among the 14 samples and among the 4 tetraploid and one hexaploid genomes of Avena species |
 View Details | Fig. 3 PCR-RFLP patterns detected in the nine tetraploid and five hexaploid oat species. PCR-amplified DNA fragments of As120a (a), avenin (b), and globulin (c) were digested with HincII, HaeIII, and HaeIII, respectively, and separated by gel electrophoresis. Each lane is indicated by code name according to Table 1. M indicates DNA molecular marker from 100 bp to 2000 bp. |
The comparisons among the restriction fragment distance matrices of the As120a, avenin and globulin sequences using the Mantel test revealed the presence of significant correlations among them. However, the correlation coefficients among As120a, avenin and globulin (r = 0.253*** between avenin and globulin; r = 0.346*** between avenin and As120a; r = 0.573*** between As120a and globulin) were significantly lower than the coefficient between AFLP and RAPD (r = 0.92; Drossou et al., 2004). The results indicated that some repetitive DNA sequences are common to many species, while others are restricted to single species or species group. They might, therefore, be used as different tools in the genome analysis of polyploid species.
We drew the dendrogram utilizing the combined distance data of three repetitive DNA sequences for clarifying the polyploid evolution of the genus Avena (Fig. 4). As expected, in the dendrogram the accessions were classified into groups, which were consistent with the classification according to the ploidy or species levels. The dendrogram grouped separately four sorts of the diploid genomes (Ac, Ad, Cp + Cv and 5As + Al + Ap). The Ac and Ad genomes of the diploid species separated distantly from the other A genome species, respectively. The Al and Ap genome species were clustered with the five As genome species. All the C genomes comprised the small group. The C genome diploids were separated distantly from the A. atlantica (As1) diploid species.
 View Details | Fig. 4 Dendrogram based on distances estimated by PCR-RFLP analysis of As120a, avenin and globulin. |
The artificial autotetraploid, A. strigosa (AsAs) closely related to the AB genome group rather than parental diploid species A. strigosa (As4). The AB genomes except for A. agadiriana (AB2) and A. vaviloviana (AB5) formed a cluster together with A.strigosa (AsAs). The AC and CC tetraploid species were involved in the two ACD hexaploid species groups.
The hexaploid genome (ACD) were separated into two groups, one comprised the cluster consisted of A. fatua (ACD2), A. sativa (ACD4) and A. maroccana (AC1), and another was the group consisted of A. sterilis (ACD5), A.byzantina (ACD1), A. sativa ssp. nuda(ACD3) and A. murphyi (AC2). It is interesting that A. macrostachya (CC) is related to A. maroccana (AC1). There was the similarity between groups of the same ploidy levels but was not between the same genome groups. It was assumed that the high degree of diversity would result after the genomic differentiation and polyploidization of diploid species had occurred.
Phylogentic relationships and genome affinities were investigated with using all the biological species consisting of the diploids, tetraploids, and hexaploids in the 29 taxa of the genus Avena. Three genomic repeated DNA sequences digested with six restriction enzymes revealed 130 polymorphic fragments out of 156 fragments generated by PCR-amplification followed by digestion with restriction enzyme. The number of fragments was almost the same as those among As120a (55 fragments), avenin (54 fragments) and globulin (47 fragments) and was unbiased in the genome groups. Based on all the fragment data, the dendrogram was constructed, which was more than the limited coverage of the specific genome. RAPD and AFLP have been widely used over past few years in the assessment of intra-specific and inter-specific genetic relationships (Wolfe and Liston, 1998). The high correlation value between the genetic similarity matrices of RAPD and AFLPs means that they are the similar coverage of the genomes in genus Avena (Drossou et al., 2004). Mantel test is a popular statistical method to examine relationship between polymorphic molecular markers. Significant and low correlation coefficients between them indicate good combinations of markers in the estimation of diversity. The Mantel test in this study indicated that As120a, avenin, and globulin covered different aspects of polymorphism of genus Avena. So, there is an advantage in focusing on repeated DNA and multiple gene family.
A tentative and schematic outline of the evolution of oat species was proposed by Rajhathy and Thomas (1974). The three basic genomes diverged from the archetype and from each other through major reorganization of the karyotype. Diploid species genomes A, B, C and D were postulated in the outline of speciation in Avena. The array of modified genomes within the basic group A and C evolved through minor repatternings. The outline of genomic evolution still has two major questions such that no diploid species have ever been identified with the B and D genomes. It is known from the literature that a positive correlation exists between the DNA sequence homology and chromosome paring as measured by the level of bivalents and multivalents, and the rate of crossing-over (Flavell, 1982). It is also known that cereal species are characterized by a considerable number of repeated DNA sequences, and that their rapid turnover and rearrangements are responsible for most of the changes in chromosome size and structure during the evolution of the species (Flavell, 1986).
With regard to the origin of the D genome of the hexaploid oats, molecular and cytogenetical analyses have not identified any likely progenitor species. The D genome of the hexaploids is considered to have substantial similarities with the A genome based on GISH results (Chen and Armstrong, 1994; Jellen et al., 1994; Hayasaki et al., 2000). On the other hand, discrimination of the closely related A and D genomes is possible using an A genome-specific AS120a sequence (Linares et al., 1998). The AC1 (A. maroccana) and AC2 tetraploid (A. murphyi) are always grouped with the ACD hexaploids. The fact that the hexaploids cluster with the AC tetraploids indicates that the D genome is not characterized by genetic differences sufficient to segregate the hexaploid from their putative AC tetraploid progenitors. In this case, it appears that all relevant wild species have not been discovered, or perhaps that they exist in germplasm collections but have yet to be analyzed. Nikoloudakis et al. (2008) sequenced and aligned Avena taxa 71 clones of the ITS1-5.8-ITS2 fragment and constructed a network. They revealed major genetic divergence between the A and C genomes, while distinction among the A and B/D genomes was not possible. Analysis of AFLP similarity suggested that the AC genome tetraploid A. maroccana was likely derived from the Cp genome diploid A. eriantha and the As genome diploid A. wiestii (Fu and Williams, 2008). These reports mentioned that all the species were clustered together according to their polyploidy levels. The same situation as ITS1-5.8-ITS2 and AFLP analysis was observed in this RFLP studies.
The tetraploid species are also clearly differentiated into two groups the AB and AsAs species carrying B genomes, and the AC, CC and ACD species carrying C genome. A RFLP analysis on tetraploid species relationships confirmed the differentiation of the maroccana-murphyi-agadiriana group from the barbata complex (Alicchio et al., 1995).
With regard to the origin of the B genome, the AB genome tetraploid species are thought to be an autotetraploid derived from A. strigosa (As4). The artificial autotetraploid (AsAs) was closely related to the AB genome species rather than the diploid of the As genomes in this study. Song et al. (1995) studied the natural and synthetic allopolyploids in Brassica and observed that the higher the degree of divergence between the parental diploid genomes, the greater the subsequent genomic change in the resulting polyploid. The GISH experiments using total A. strigosa genomic DNA as a probe uniformly hybridized all the AB chromosomes of A. barbata (Leggett and Markhand, 1995) and A. vaviloviana (Katsiotis et al., 1997). The results revealed that the origin of the B genome in Avena seemed to be derived from a wild species of the As genome. In this study, however, A. agadiriana (AB2) and A. vaviloviana (AB5) separated to the different groups. A possible reason is that the two species are endemic and, isolated from the other species in Agadir of Morocco and in Ethiopia, respectively.
The CC genome fell into either the AC1 genome tetraploid or the C genome diploids. The triploid hybrids between A. eriantha (Cp) and A. macrostachya (CC) showed a high frequency of multivalents at meiosis. The GISH experiments using total A. eriansa genomic DNA as a probe uniformly hybridized with all the CC chromosomes of A. macrostachya (Morikawa unpublished data; Leggett, 1992). The results supported that A. macrostachya is an autotetraploid belonging to the genus Avena shared the C genome. The AC genome species were derived directly from the allotetraploids between the A and C diploid genome species because they are always inter-located between these two diploids. Most of the species analyzed in this study contain the A genome (or its derivatives). Therefore, the species having the AC genome should be located in the proximity of the diploid species having the C genome. The tree topology, however, simply does not support this notion. The contribution of C-genome diploid species to the evolution of polyploidy oats was studied using C-genome ITS-specific primers (Nikoloudakis and Katsiotis, 2008). They reported that the C-genome sequences of the AACC and AACCDD revealed close proximity to A. ventricosa (Cv). However, the Cv genome was far from the C genomes of tetraploids and hexaploid species rather than the Cp genome in this study. The evolution of Avena did not follow the molecular clock. The path inferred is that the C genome is more ancient than the A and B genomes and closer to the genome of A. macrostachya (Peng et al., 2008). The same situation was observed in this study.
The A genome has been classified with seven groups based on karyotypes and chromosome pairing behavior. The major group is the As genome including the four diploid species A. atlantica, A. hirtula, A. strigosa and A. wiestii. The A. damascena (Ad) and A. canariensis (Ac) genomes were always separated distantly from each other, and from the other diploid species. A certain divergence was also observed between the two endemic species and the other diploid species with the A genome based on the RFLPs (Alicchio et al., 1995). It is the first report that the high level of genetic distance between them reflects their different morphology and reproductive isolation distributed in the Canary Islands and Damascus of Syria. Genetic similarities using satellite DNA sequences suggested that A. canariensis (Ac) was more closely related than A. longiglumis (Al) to the hexaploid species (Li et al., 2000), but this was not evident from the polymorphisms of the As120a satellite sequences in this study and receptor kinase genes (ALrk10) (Cheng et al., 2003). The results indicated that the Ad and Ac genomes are different from the As, Al, and Ap genome diploid species, and could not be involved in the origin of these tetraploids and hexaploids. The Al and Ap genomes were included or closely related to the As genome group. The Al and Ap genomes were thought to be produced by intra-genomic rearrangements of the As genome ancestor.
Seed storage proteins are generally encoded by multi-gene families (Shotwell and Larkins, 1989), and this is also the case for avenin and globulin protein in oats. There are different numbers of potential globulin coding sequences in different Avena species. Based on reconstruction hybridization, Chesnut et al. (1989) estimated that there were from 20 genes (A. hirtula) to at least 50 (A. fatua and A. sativa) genes per haploid genome. The number of potential avenin coding sequences also varied from as few as 6 (A. hirtula) and 8 (A. maroccana) to as many as 25 (A. sativa). There are generally 2 times to 4 times as many potential globulin genes as avenin genes. This is probably a valid assumption for the globulin coding sequences since they are highly conserved. They could be useful in clarifying inter-genomic and inter ployploid relationships. The As120a restriction fragments as well as globulin genes are generally conserved due to a significant correlation between the restriction fragments distances. This may not be so for avenin genes since there is more variability in their coding sequences. They could be used as a tool for estimating intra-genomic and intra-specific relationships. The three sorts of accessions of A. damascena, A. hirtula and A. barbata used in this study showed intra-specific variations only when restriction fragments containing avenin genes were used.
In conclusion, the present study extended our knowledge of the genomic and polyploidy relationships within genus Avena as follows. In the diploid species, A. damascena (Ad) and A.canariensis (Ac) are distantly differentiated from each other, and from the As, Al and Ap genome species. The A. longiglumis (Al) and A. prostrata (Ap) were separated from a common ancestor from the species with the A-modified genome. In the tetraploid species, the AB genome species are the nearly autotetraploids and the B genome seems to be derived from a wild As genome species. The A. macrostachya is an autotetraploid belonging to genus Avena shared the C genome. In the hexaploid (ACD) species, the D genome is not characterized by genetic differences sufficient to segregate the hexaploid from their putative AC tetraploid progenitors. There is a possibility that tetraploid and hexaploid species are divided into two groups, maroccana-fatua-sativa and murphyi-sterilis-byzantina derived from two different origins. This study also provided information on the divergence of repeated DNA sequences for clarifying the genomic and polyploidy relationships in genus Avena.
We would like to express our appreciation to Dr. Janice Y. Uchida, University of Hawaii, USA, for critical reading in improving the manuscript, Dr. M.Ueno for technical assistance, and two anonymous reviewers for valuable comments.