| Edited by Toshihiko Shiroishi. Weikuan Gu: Corresponding author. E-mail: wgu@utmem.edu. Yan Jiao, Chun Cai and Mohammad Habiby Kermany: Footnote: Those authors contribute equally to this work. |
An increasing number of naturally occurring mouse mutations and genetically-engineered or chemically-induced mouse mutants with hearing impairment have served as models for human deafness (Friedman and Griffith, 2003; Goldfarb and Avraham, 2002; Steel and Kros, 2001). However, only a limited number of mouse models have been identified (Kujawa and Liberman, 2006; Noben-Trauth et al., 2003) for age-related hearing loss (AHL or presbycusis) and noise-induced hearing loss (NIHL), that are prevalent disorders in humans with characteristic of high-frequency hearing loss (HFHL). N-ethyl-N-nitrosourea (ENU) is a strong chemical mutagen that predominantly introduces random single base-pair changes in the genome. ENU mutagenesis is complementary to other types of mutagenesis such as gene-trap insertional mutations or specific-gene knockouts achieved by homologous recombination in ES cells. Because approximately 70% of the 38,000 human mutations in over 1,500 genes that have been identified are of the single-base pair variety (http://www.hgmd.cf.ac.uk/ac/hahaha.php), mutants identified through ENU-based screens are more closely model these naturally occurring human mutations. The NIH funded neuromutagenesis program in the TMGC used an ENU mutagenesis scheme in which visible or molecular markers and specific mouse strains with inverted chromosomal regions were used to easily identify mice carrying the recessive mutations (Goldowitz et al., 2004; Jablonski et al., 2005) (http://www.tnmouse.org/neuromutagenesis/). A commonly used hearing test in humans and mice is far-field auditory brainstem evoked responses (ABR). However, nearly all other auditory screens in various mouse ENU mutagenesis programs used assays other than ABR, such as acoustic startle response (ASR), pre-pulse inhibition (PPI), or click-box (Hrabe de Angelis et al., 2000; Munroe et al., 2000; Nolan et al., 2000). While they are valuable in identifying auditory mutants, these assays do not characterize the response of mutant mice to high-frequency (> 20 kHz) stimuli, a critical characteristic of auditory function in adult mice. As a result, the genes involved in the high-frequency-specific hearing process were missed. Furthermore, because the stimuli used in these screens usually are at high levels (90–110 dB SPL), most of the mutants identified are profoundly deaf with severe inner ear defects. Therefore, mutants with mild hearing deficits had also been missed in these screens.
For the historical and technical reasons, phenotype-driven approach has been used in majority of the ENU-induced mutation screening. It focuses on discovery of novel phenotypes from which the relevant genes and pathways are subsequently identified. Thus, no assumptions are made about the underlying genes involved. Phenotype-driven approaches, however, require the application of appropriate screens to identify phenotypes of interest. The first and most simple protocol is to mate ENU-treated males to wild-type females and to score the F1 progeny for dominant and semi-dominant mutations. Mice carrying new phenotypes can be tested to confirm heritability, and affected progeny recovered can subsequently be intercrossed to examine mutant homozygotes and semi-dominance. Given the simplicity of the protocol, this approach is being widely adopted for the recovery of new mouse mutations. It has been the route by which a number of overt visible and other anomalies have been recovered (Beier and Herron, 2004; Brown, 1998). Several excellent reviews have summarized the recent achievements (Beier and Herron, 2004; Clark et al., 2004; Nolan et al., 2002; Justice et al., 1999).
In our auditory primary screen in the TMGC neuromutagenesis program, we used ABR to click and 8, 16, 32 kHz pure tone stimuli. In the past 3 years, we had screened a total of 285 pedigrees (1,819 mice) at the age of 8 to 11 weeks in mixed strain backgrounds (Kermany et al., 2006). A total of 17 pedigrees (~6%) were confirmed to display HFHL mostly at 32 kHz. The histology of 6 of the 9 mutant pedigrees we analyzed showed degeneration of spiral ganglia (SG), spiral ligament (SL) fibrocytes or inner hair cells, but not outer hair cells, in the high-frequency domain of the basal cochlea. These combined results verified the effectiveness and feasibility of our strategy to screen for frequency-specific hearing mutants using ABR and we indeed further identified novel mouse models for the HFHL, which is particularly prevalent in the aging and noise-exposed human population.
One of the unexpected findings in our study was the chromosomal locations of selected mutations. In our original ENU screening, an inversion-mediated screen of the distal portion of Chr 15 was conducted to ensure that the mutation on Chr 15 was selected (Noben-Trauth et al., 2003). However, many excellent mutations, including one mutation in this report, appeared to be not on Chr 15. Thus, genetic mapping of chromosomal locations are necessary for the identification of these mutated genes. In such a case, identification of mutated locus or loci is essential for understanding the genetic basis of the mutation. The strain 118 TNE was genomically stable after 6 or 7 generations of inbreeding in our previously study (Kermany et al., 2006). In this report, we describe the genetic mapping using a F2 population and determination of the genomic location of the ENU mutation in 118 TNE strain.
Animals were obtained from Mammalian Genetics & Genomics, Oak Ridge National Laboratory. A F2 population, called EM46, was produced by crossing two progenitor strains, 118 TNE and CAST/EJ (CAST). Experimental procedures and mouse husbandry were performed in accordance with the National Institutes of Health’s Guide for the Care and Use of Laboratory Animals and approved by the UTHSC and Oak Ridge National Laboratory Institutional Animal Care and Use Committee.
We recorded ABR to click and pure-tone stimuli at 8, 16 and 32 kHz for each of the EM46 F2 progeny. Due to the interaction of environment and mixed strain backgrounds of each progeny, we measured ABR thresholds of a large number of F2 mice in each project and compared their mean thresholds and standard deviations (SD). Overall, the mean and SD values for the 32 kHz stimulus were used.
Genomic DNAs (gDNA) were extracted from the livers of F2, 118 TNE mice, as well as from B6 and C3H mice by using a Qiagen Genomic-tip20/G (Qiagen, Alameda, CA) following the manufacturer's instructions. Quality and quantity of the DNA were measured in an Eppendorf photometer (Eppendorf Sciencetific, Westbury, NY). Total RNAs were extracted from inner ear by using Trizol reagent (Invitrogen, Carlsbad, CA), and the quality of the total RNA was checked by electrophoresis on a Spectronic Genesys spectrophotometer (Spectronic Instruments, Rochester, NY).
Genotype of each individual of the F2 population was done using microsatellite markers at TJL (Jiao et al., 2007). Microsatellite makers were first selected according to information provided by The Jackson Laboratory (http://www.informatics.jax.org). Polymorphisms of these markers were tested using genomic DNA from two progenitor strains, C3H, and four F1 mice. Polymorphic markers that differ from CAST to B6 and C3H, and show polymorphism among F2 population then were used for genotyping. PCR-based genotyping using microsatellite markers was performed as described previously (Jiao et al., 2007). DNA fragments were amplified by PCR. PCR products were analyzed on the Mega-Gel Dual High-Throughput Vertical Elctrophoresis systems (C.B.S. Scientific, Del Mar, CA).
The 108 selected markers were used to genotype every progeny in the F2 population. In order to determine whether the hearing loss in strain 118 TNE is controlled by a major locus or many loci, QTX (http://www.mapmanager.org/mmQTX.html) was used to initially analyze the genetic loci that regulate hearing loss. Data from hearing loss and genotypes were organized in patterns requested by the software and the procedure followed that in our previous report (Jiao et al., 2007).
Further location of ENU mutation locus was conducted using additional markers and linkage analysis. Deviations from the expected Mendelian segregation ratios were calculated based on chi-square contingency. Marker loci eventually showing segregation distortion were further analyzed for the nature of distortion, if B or C, based on chi-square conditional (Patricia et al., 2004): testing the hypothesis pp = qq = 1/2pq by the formula chi-square (GL = 1) = [(2np – n)4 + (2nq – n)4 + (2npq-n)4]/n [where p (AA) = (AA/2)/n, q (BB) = (BB/2)/n, pq (AB) = (AB/2)/n and n = total number of individuals].
Phenotype of F2 generation provided insinuation information on the inheritance of the mutation of hearing loss in 118 TNE. Although the 118 TNE seems stabilized after number of generations of inbreeding (Kermany et al., 2006), it is not clear how many loci that regulate the hearing loss in this strain. The segregation pattern of the disease phenotype in an F2 population is therefore critical to the genetic mapping of mutation. Fig. 1 shows the distribution of phenotype in 106 F2 populations, called EM46, a cross generated between 118 TNE and CAST. The phenotypes of the EM46 populations at 32 kHz fall into two distinct groups, 78 normal and 28 hearing loss mice with a 3:1 ratio (Fig. 1). The data suggest that the hearing loss in 118 TNE is caused by a single locus or possibly a single gene with recessive inheritance.
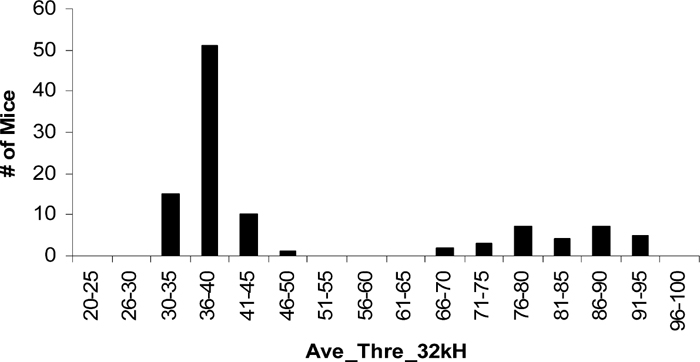 View Details | Fig. 1 Phenotype distribution of F2 population. The progeny falls into two groups, the normal response and abnormal response. The ratio of normal to hearing loss is approximately 3:1. |
To prepare for the genotyping of the F2 populations, we tested molecular markers that are segregating in EM46 population. Because 118 TNE was derived from a cross between C57BL/6 (B6) and C3H/HeJ (C3H), and because the F2 populating was created by crossing 118 TNE to CAST, we selected markers that are different among those three strains. We first selected 209 markers according to information provided from the Jackson laboratory; then we tested each primer using two samples from each of those three strains. Only those markers showing a clear difference among those three strains were finally selected for genotyping. A total of 108 molecular markers with average of genetic distance of 13.1 cM were used for genotyping in every chromosome except X and Y (Table 1).
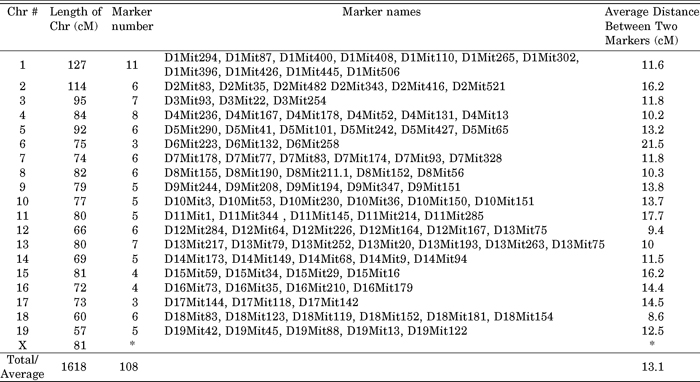 View Details | Table 1 Molecular markers Screened in F2 of EM46 populations |
For initial genotyping, used 96 well plates to conduct PCR amplification and then determine the genotype of each sample by electrophoresis. For the convenience, we used 90 samples from F2 populating. Within 90 samples, 67 had normal hearing while 23 had hearing loss. The rest of 6 wells include samples from each parental strain, F1s, and a molecular marker. Fig. 2 shows a molecular marker that is segregating among EM46 population.
 View Details | Fig. 2 Genetic loci that potentially regulate hearing loss in 118 TNE obtained from QTX analysis. Red line indicates recessive effect while the black line indicates the scale of likelihood ratio. 2A. Genetic loci that potentially regulate hearing loss in 118 TNE on chromosome 15. 2B. Genetic loci that potentially regulate hearing loss in 118 TNE on chromosome 16. |
Our initial focus was to find out whether one locus on chr 15 is segregating in the F2 population. We expected to detect one locus because of the 3:1 phenotypic segregation ratio observed in the F2 population. We expected to find the mutation located on chromosome 15 because an inversion-mediated screen of the distal portion of Chr 15 was used as a marker to select mutants in the initial ENU screening (Noben-Trauth et al., 2003; Kermany et al., 2006).
However, our initial mappings suggested that there are two loci, one on Chr 15 and one on Chr 16. We tried different models, including dominant, recessive, and additive, to further examine the effect of each of those two loci. Fig. 2 shows the loci identified from chromosome 15 and 16.
Given the 3:1 ratio of F2 segregation, finding two loci regulating hearing loss in our initial screening was a surprise. We suspected that one of the two loci was from the effect of genomic background. To test whether the effect of the locus on Chr 15 was from the genome background of CAST, we first examined the genotype of hearing loss individuals using the closest marker to the locus on Chr 15, the D15Mit34. As shown in Fig. 3, those individuals of hearing loss are mostly heterozygous or homozygous for CAST. The genotype of homozygous B6, heterozygous and homozygous CAST are 2, 7 and 14, respectively. Thus, among all the individuals with hearing loss, only two had B6 homozygous genotype while most homozygous markers were indeed from CAST. Assuming a 1:2:1 ratio of segregation of a single locus, chi square test produced a P score = 0.0003, indicating that there is a significant deviation from the normal segregation ratio. This segregation pattern suggested that this locus may not be the ENU-induced mutant locus because our ENU mutagenesis experiment was conducted using B6 mice, the recessive mutation for hearing loss should come from B6. We then examined the segregation pattern in health F2 population. The homozygous B6, heterozygous, and homozygous CAST are 11, 37 and 19, respectively. Using 1:2:1 ratio of segregation, chi-square test produced a P score = 0.2669, indicating that there is no significant deviation from the normal segregation ratio. Therefore, our data suggest that this locus on Chr 15 does not represent the ENU mutation locus. It is either a QTL from CAST or it interacts with ENU mutation locus.
 View Details | Fig. 3 Genotype distribution among hearing loss and healthy controls in the genetic locus mapped on chromosome 15. While three genotype, BB- homozygous B6 genotype, CC-homozygous CAST genotype, and heterozygous are normally segregated among healthy F2 progenies, CC genotype is dominant in hearing loss individuals. |
In contrast to the genotype analysis on Chr 15, Fig. 4 shows the genotype analysis of the closest marker to the locus on Chr 16. Among 67 normal F2s, there were 14 homozygous CAST, 13 B6, and 40 heterozygous. Using 1:2:1 ratio of segregation, chi-square test produced a P score = 0.279, indicating that there is no significant deviation from the normal segregation ratio. However, among 23 hearing-loss F2s, there were 12 homozygous B6, only 2 homozygous CAST, and 9 heterozygous. There is much higher frequency of B6 genotype than CAST in hearing-loss F2s. chi-square test produced a P score = 0.0075, indicating that there is a significant deviation from the normal segregation ratio. Two additional markers in this region showed the same patterns. We therefore believe that the locus on Chr 16 contains an ENU mutation that leads to hearing loss.
 View Details | Fig. 4 Genotype distribution among hearing loss and healthy controls in the genetic locus mapped on chromosome 16. While three genotype, BB, CC, and heterozygous are normally segregated among healthy F2 progenies, Majority hearing loss individuals are homozygous BB genotype. |
The establishment of the cause of hearing loss by a single mutation locus in 118 TNE strain provides promise foundation for the identification of the mutation and utilization of this mouse model. A major obstacle in the study of the ENU induced mutant of animal models has been the confirmation of the mutated locus. Many induced model have been caused by multiple mutations and are difficult to stabilize. The main difficulty is from the fact that the effect of the ENU mutation is small and most of them are single nucleotide polymorphisms (SNP), which occur in almost every several kbs in genome. Identification of the mutated gene for the trait of interest from hundreds of none-function relevant others in a large piece of genome area has proven to be extremely difficult. In this regard, it is clear that identifying QT genes have been limited by the availability of genetic-based data and technology. Today, this limitation still exists, but tremendous progress has been made in the technology and genome resource. With the single locus identified from the 118 TNE, searching of mutated gene in this model can be focused on the particular region defined by the molecular markers that are flanking the mutated genes.
We did not conduct a detailed analysis in our initial linkage mapping such as permutation test. We thought that, because of the potential 3:1 ratio, we could easily exclude other loci and quickly focus on one major locus. Nevertheless, we feel confident on the analysis of those two loci. Because of the complex of genomic background of 118 TNE, we eliminated almost half of the initially selected markers for the F2 genotype. The polymorphisms and segregation patterns of markers used in the study are all clear cut. We therefore did not have difficult to assign the genotype of individual mouse. Those markers will be useful for other F2 populations with such a genomic background. Markers on sex chromosomes are not selected for genotyping, though we do not know whether any locus on sex chromosome affects the hearing loss in this F2 population.
The genetic locus on chromosome 15 may contain a gene/genes that regulate hearing loss. Thus, we possibly identified a quantitative trait locus from chromosome 15 that is segregating within F2 population. First, because we made the F2 population between a hearing loss strain and normal health strain, theoretically, QTL of hearing loss can be identified by whole genome linkage analysis. Second, like many other ENU induced mutants, the mutation in 118 TNE is probably caused by a single nucleotide mutant, therefore the small phenotypic impact of the mutation is easily influenced by QTL loci. In addition, the initial selection of ENU mutants based on marker on chromosome 15 may or may not preserve such a genetic locus.
We believe that there may be interaction between the locus on chromosome 15 and the mutation on chromosome 16 in the F2 population. Although we obtained a 3:1 ratio of segregation between normal and hearing loss in F2 population, we did not see an extremely strong correlation between mutation locus on chromosome 16 and the hearing loss. Instead, we obtained significant correlation between hearing loss and each of those two loci. If this is true, it means that not 100% of the mutation will lead to hearing loss in F2 generation. In fact, the healthy to hearing loss individuals of 78:28 is 2.78:1, to be exact. This result may be due to the random error or birth errors or the influence of genetic locus on chromosome 15.
In summary, we have located the ENU mutation on chromosome 16 with a set of useful molecular markers. Further study to identify the actual mutated gene/s will be important for characterization of this mutant strain and its utilization in studying of high frequency hearing loss.
This work was supported by National Institute of Arthritis and Musculoskeletal and Skin Diseases, National Institutes of Health (R01 AR51190] to WG and by Veterans Administration Medical Center in Memphis. We thank Mr. Zhiping Jia for his excellent technical assistance.
|