ABSTRACT
This study examined the relationship between host plant and rhizospheric bacterial community structure, including composition and diversity, in Triticum and Aegilops species (12 and two accessions, respectively) as well as three closely related species, barley, rye and oat (four accessions), to explore the possibility that wheat root and rhizosphere interaction can be utilized for wheat breeding and biotechnology in the future. For this purpose, DNA was isolated from rhizospheric soil samples and one control non-rhizospheric soil sample, and the 16S rRNA gene region was amplified and subjected to DNA pyrosequencing. A total of 132,888 amplicons were analyzed. Bacterial composition at the phylum level was similar among the 18 rhizospheric samples; however, the proportion of Acidobacteria was much lower in these samples than in the control non-rhizospheric soil sample, indicating that rhizospheres influenced the bacterial composition even at the higher taxonomic level. Across host plant genome types (three levels of ploidy and three major genomes, A, B and D), there was no detectable difference in phylum composition or species diversity. Estimated bacterial species diversity was higher in the control soil sample than in plant rhizospheric soils, implying that bacterial species diversity was reduced in rhizospheres. A PCoA plot and UPGMA dendrogram based on the bacterial species composition showed that control soil was distantly located from the plant rhizospheric samples and that Triticum, Aegilops and related species were well separated. PERMANOVA analysis detected statistically significant differentiation among these four groups. Clustering of Triticum species suggested that the A genome was dominant over the B and D genomes, with respect to the influence on rhizospheric bacterial species composition. Although the cause was not investigated in this study, these results clearly indicated that the genetic constitution of the plant host exerted a strong influence on rhizospheric bacterial community structure.
INTRODUCTION
The rhizosphere is an interface between plant roots, the soil and the soil microbiome, in which all organisms interact (Peiffer et al., 2013). Many microorganisms associated with plant roots provide the host plant with critical nutrients and minerals, increase plant stress tolerance against biotic and abiotic factors, and promote plant growth directly and indirectly, while some soil bacteria are plant pathogens (Bais et al., 2006). On the other hand, plants produce nutrients that attract microorganisms, such as carbon-rich rhizodeposits (Bais et al., 2006), and change concentrations of toxic elements (e.g., aluminum) and pollutants (Hinsinger et al., 2006). Plants can also alter soil properties, including pH, redox potential and partial pressures of gases such as O2 and CO2 (Hinsinger et al., 2006).
These functions of host plants can directly affect the composition and diversity of rhizospheric microbial communities. It was reported that the microbial community structure varies significantly in rhizospheric soil associated with different plant species (Wieland et al., 2001; Kuske et al., 2002) or plant genotypes (Aira et al., 2010). In one study, microbial communities in rhizosphere and rhizoplane regions of leguminous plants were analyzed using temperature gradient gel electrophoresis of PCR-amplified 16S rRNA gene target sequences. The results showed that the type of plant species (clover, bean or alfalfa) had a greater effect on rhizosphere and rhizoplane microbe composition than soil type or plant development time (Wieland et al., 2001). Another study investigated bacterial communities in the rhizosphere of three grass species (Stipa hymenoides, Hilaria jamesii and Bromus tectorum) using terminal restriction fragment length polymorphism (TRF, also known as T-RFLP) of 16S rRNA genes. This study reported major differences in rhizospheric bacterial community structure among the three plant species, with respect to the Acidobacterium division (Kuske et al., 2002). In another study, microbial communities in maize rhizospheres were analyzed using phospholipid fatty acid content as well as basal respiration and microbial growth rate. This study identified differences in the microbial communities associated with maize genotype variants of the su1 and sh2 genes, which influence carbon storage (Aira et al., 2010). These results indicated that different plant species and genotypes of plant species could influence the structure (diversity and composition) of the root-associated microbial community. It was suggested that it would be valuable to understand these interactions between plants and microorganisms in root and to identify the plant alleles related to these interactions for future plant breeding and biotechnology (Peiffer et al., 2013).
Bread wheat (Triticum aestivum ssp. aestivum) is one of the most important crops in the world, providing the staple food source for 30% of the human population (International Wheat Genome Sequencing Consortium (IWGSC), 2014). Triticum aestivum is highly adaptable to different climatic and environmental conditions, which has been attributed, in part, to its allohexaploid genome structure (IWGSC, 2014). The bread wheat genome consists of three closely related subgenomes (A, B and D), derived from the three diploid species Triticum urartu (AA), an unknown close relative of Aegilops speltoides (SS) and Ae. tauschii (DD) (Miyashita et al., 1994; Salamini et al., 2002; Petersen et al., 2006; Marcussen et al., 2014). It has been proposed that the allopolyploidization of bread wheat reflects hybridization between two diploid species (AA as the paternal ancestor and BB as the maternal ancestor), followed by genome duplication, the result being tetraploid emmer wheat (AABB). Subsequently, the tetraploid species hybridized with Ae. tauschii (DD, as the paternal ancestor), resulting hexaploid common wheat (AABBDD) (Kihara, 1944; McFadden and Sears, 1944, 1946; Lilienfeld, 1951). The A, B and D genomes have been estimated to contain approximately 28,000, 38,000 and 36,000 genes, respectively (Choulet et al., 2010; Massa et al., 2011; Hernandez et al., 2012), and an average 97% gene sequence identity was reported between the A, B and D lineages of hexaploid subgenomes and the respective diploid genomes (IWGSC, 2014).
The relationship between wheat and its rhizospheric microbial community structure is poorly understood. A cross-year analysis (Donn et al., 2014) of the rhizospheric bacterial community was performed in the Janz and H45 cultivars of bread wheat using T-RFLP and pyrosequencing analyses of 16S rRNA genes. The results showed that bacterial composition was drastically different in rhizospheric samples from that in control soil, and that the differences could relate to adherence of bacteria to plant roots, plant age, field site and planting sequence. While differences in bacterial composition were observed between rhizospheric and non-rhizospheric soil samples, the bacterial communities associated with rhizospheric soil samples from the two bread wheat cultivars were largely similar in composition. To date, however, the composition and diversity of rhizospheric microbial communities associated with various wheat and wheat-related species have not been investigated.
This study reports the composition and diversity of rhizospheric bacterial communities associated with 14 accessions of Triticum and Aegilops and four accessions of barley, rye and oat. DNA pyrosequencing of the 16S rRNA gene region was used to characterize bacteria in each rhizospheric sample. The 14 Triticum and Aegilops species (denoted here as TA species) were classified according to genome type and ploidy, which are regarded as potential factors influencing rhizospheric bacterial community structure, the rationale for this being that genome type is a qualitative measure of genetic constitution while ploidy is a quantitative measure of gene dosage. These characteristics represent large genome-wide genetic differences, which could influence the interactions between microorganisms and the plant in the rhizosphere, leading to changes in bacterial community structure (diversity and composition).
Among the 14 Triticum and Aegilops samples, there were five diploid, five tetraploid and four hexaploid species, while 12 species had the A genome (Triticum species), eight had the B genome, and five had the D genome. As outgroups of the TA species, four wheat-related grass species (two- and six-rowed barley, rye and oat) were used, denoted here as non-TA (NTA) species.
This study also reveals for the first time the composition and diversity of rhizospheric bacterial communities of Triticum and Aegilops species as well as three closely related NTA species. The results could identify bacteria uniquely associated with rhizospheres of Triticum and Aegilops species, which may be useful for wheat breeding and future biotechnology applications. We also address whether plant host genome type and/or ploidy influence the composition and/or diversity of rhizospheric bacterial communities. This information is important for improving our understanding of the evolution and adaptability of Triticum species.
MATERIALS AND METHODS
Experimental design
Experimental soil used in this study was obtained from the farm field of the Laboratory of Plant Genetics in Kyoto University (Kyoto, Japan). To prepare the soil for this experiment, ca. 70 liters of soil, a handful of inorganic fertilizer (containing N, P and K), two-thirds of a film case of garden lime, and two-thirds of a bag of leaf mold were well mixed, as is usually done for growing wheat plants in our laboratory. Fourteen accessions of Triticum and Aegilops species and four closely related species were used in this study (Table 1). Most seeds were provided by the National BioResource Project-Wheat, which is supported in part by the National BioResource Project of MEXT, Japan. All seeds were surface-sterilized in 70% ethanol with 0.1% Triton X-100 for 1 min, soaked in 10% bleach with 0.1% Triton X-100 for 12 min, and then washed three times with sterile distilled water (sdH2O) as described (Lundberg et al., 2012). Seeds were placed in a Petri dish on sterilized filter paper moistened with sdH2O and allowed to germinate at room temperature, in the dark for three days. Each germinated seedling was planted in a plastic seedling pot, grown for one month, and then transplanted to a clay pot. Plants were grown in soil mix as described above, one plant per pot, and two replicates (two pots) per species. Pots were arranged randomly using a random number table (Steel and Torrie, 1980). A pot containing only soil was used as a negative control. Plants (pots) were watered when the surface of the soil dried (about every three days), and weeded manually. No fertilizer was added. Dates of experimental steps are presented in Supplementary Table S1.
Table 1. Summary of 18 species used in this study
| Species1 | Type2 | Genome | KU no. | Source |
|---|
| 1 | Triticum urartu | W | AA | KU199-12 | NBRP3 |
| 2 | T. boeoticum (T. monococcum ssp. boeoticum) | W | AA | KU101-3 | NBRP |
| 3 | T. monococcum (T. monococcum ssp. monococcum) | C | AA | KU3636 | Dr. S. Ohta4 |
| 4 | Aegilops speltoides | W | SS (BB) | KU2228B | NBRP |
| 5 | Ae. tauschii | W | DD | KU2080 | NBRP |
| 6 | T. dicoccoides (T. turgidum ssp. dicoccoides) | W | AABB | KU8736A | NBRP |
| 7 | T. dicoccum (T. turgidum ssp. dicoccum) | C | AABB | KU7309 | NBRP |
| 8 | T. durum (T. turgidum ssp. turgidum conv. durum cv. Langdon) | C | AABB | KU-2272 | NBRP |
| 9 | T. araraticum (T. timopheevi ssp. araraticum) | W | AAGG | KU196-1 | NBRP |
| 10 | T. timopheevi (T. timopheevi ssp. timopheevi) | C | AAGG | KU107-5 | NBRP |
| 11 | T. aestivum (T. aestivum ssp. aestivum cv. Chinese spring) | C | AABBDD | KU-2269 | NBRP |
| 12 | T. sphaerococcum (T. aestivum ssp. sphaerococcum var. rotundatum) | C | AABBDD | Tsujimoto #3S1509 | NBRP |
| 13 | T. macha (T. aestivum ssp. macha) | C | AABBDD | KU154 | NBRP |
| 14 | T. spelta (T. aestivum ssp. spelta) | C | AABBDD | Tsunewaki, k52 | NBRP |
| 15 | Hordeum vulgare ssp. vulgare (two-rowed barley) | C | HH | – | Commercially available |
| 16 | H. vulgare ssp. vulgare (six-rowed barley) | C | HH | – | Commercially available |
| 17 | Secale cereale (rye) | C | RR | – | Commercially available |
| 18 | Avena sativa (oat) | C | AACCDD* | – | Commercially available |
1Triticum and Aegilops classification is according to Jakubziner (1958) and classification of Mackey (1988) is shown in parenthesis, 2W: wild; C: cultivar, 3Wheat Genetic Resources Database in the National BioResource Project (NBRP), 4Fukui Prefectural University.
*Different from wheat genomes.
Rhizospheric soils were sampled on the heading date, when the first flower completely appeared from the flag leaf for each plant (Supplementary Table S1). Each plant was manually removed from the pot, and then root-attached soil was removed by rigorous shaking of the plant body. For each plant, two replicates of ca. 0.25 g of root segments and associated soil, at a depth of 5–10 cm below the rosette, were collected for DNA extraction. From the unplanted pot (the negative control), two replicate soil samples were collected in the same manner as for the planted pots. For each sample, DNA was extracted using a PowerSoil DNA Isolation Kit (MO BIO Laboratories, Carlsbad, CA, USA) according to the manufacturer’s instructions.
PCR amplification of bacterial 16S rRNA gene region
Extracted DNA was used as template for PCR amplification of the 16S rRNA gene region, as described (Miyashita et al., 2013; Miyashita, 2015; Ito et al., 2017). Briefly, two PCR primers were used: 9F 5′-GAGTTTGATCCTGGCTCAG-3′ and 533R 5′-TIACCGIIICTICTGGCAC-3′. These primers amplify a 510-bp fragment that includes three variable regions (V1, V2 and V3) of the 16S rRNA gene in bacteria, fungi and archaea (Baker et al., 2003). To distinguish the 19 samples from each other, a unique tag sequence was attached to the 5′ end of the forward and reverse primers (Supplementary Table S2). PCR solution (total 50 μl) contained 0.2 mM dNTPs, 1 unit of KAPA Taq EXtra (Kapa Biosystems, Wilmington, MA, USA), 1x Taq buffer, 2 mM MgCl2, 0.2 μM each of the forward and reverse primers, and ca. 40 ng of template DNA. The PCR conditions used were 94 ℃ for 3 min, 30 cycles of 94 ℃ for 30 s denaturation, 55 ℃ for 30 s annealing and 72 ℃ for 1 min extension, followed by 72 ℃ for 5 min extension. Amplified PCR products were quantified by agarose gel electrophoresis and equal amounts of PCR amplicons from the same plant species (four replicates) were pooled to represent the species sample. For the control soil sample, two replicates were pooled. From each of the 19 samples, ca. 600 ng of PCR amplicons was prepared for pyrosequencing. The PCR amplicons were cleaned using the QIAquick PCR Purification Kit (Qiagen, Venlo, Netherlands) following the manufacturer’s instructions.
Pyrosequencing and data processing
Pyrosequencing of pooled PCR amplicons of the 16S rRNA gene was performed using a 454 Life Sciences Genome Sequencer FLX Titanium in Hokkaido System Science (Sapporo, Japan). A total of 132,888 reads were obtained (Supplementary Table S3). After trimming 454 adapter, tag and primer sequences, PCR and pyrosequencing errors were corrected by a denoising procedure (Quince et al., 2009; Caporaso et al., 2010b) implemented in Quantitative Insights Into Microbial Ecology (QIIME) 1.4.0a (http://www.qiime.org). In this process, sequences shorter than 200 bp and/or of average quality score lower than 25 were also eliminated from the data set. To remove sequences of the plant 18S rRNA gene region, which could also be amplified with the two primers used, all of the sequences were searched using the 18S rRNA gene sequence of Triticum aestivum (NCBI accession K01229) as the query by the local BLAST tool downloaded from the National Center for Biotechnology Information (NCBI). The sequence data of the 18S rRNA gene region in T. aestivum was obtained from the DNA Data Bank of Japan (DDBJ). Sequences of the 18S rRNA gene identified with BLAST E value = 0.0 and other ambiguous sequences were eliminated from the data set. Because all the 16S and 18S rRNA gene reads derived from host plants were not necessarily removed, the proportion of Cyanobacteria/Chloroplast, described below, should be considered with caution. A total of 94,416 sequences were used for further analyses (Supplementary Table S3). All of the sequences were clustered into operational taxonomic units (OTUs) based on their sequence identity using the uclust method (Caporaso et al., 2010b) in QIIME. A cluster within 3% divergence was defined as a “species” (OTU) following conventional definitions (Bond et al., 1995; Schloss and Handelsman, 2005; Huber et al., 2007). For each OTU, a representative sequence that was the most abundant sequence in that OTU cluster was selected and a data set of the representative sequences was aligned using the PyNAST method in QIIME (Caporaso et al., 2010a). Chimeric sequences were identified in the data set of the representative sequences using ChimeraSlayer (http://microbiomeutil.sourceforge.net/#A_CS) in QIIME and OTUs represented by those chimeric sequences were excluded from all the downstream analyses. A total of 91,674 non-chimeric sequences were used for further analyses (Supplementary Table S3).
Analyses of α-diversity
Each OTU identified in samples was taxonomically assigned with reference to the 16S rRNA gene database in the Ribosomal Database Project release 11 (Cole et al., 2009) at Michigan State University using the uclust consensus taxonomy classifier in QIIME. The similarity of the taxonomic composition was examined using Spearman’s rank correlation for all pairwise comparisons between samples (19 × 18 / 2 = 171 combinations). To examine the effect of plant genetic constitution on the bacterial phylum composition in the rhizosphere, the proportion of each phylum in a plant sample was adjusted relative to that in the control soil, defined as (the proportion of a phylum in plant sample – that in the control soil) / that in the control soil. This relative ratio of proportions measures the change in the phylum composition in the rhizosphere relative to the control soil without a plant. In other words, if the proportion of a phylum in the rhizosphere were the same as that in the control soil, this ratio would be zero, while a positive or negative value would indicate an induction or repression effect on phylum composition due to the genetic constitution of the plant in the pot. The bacterial species diversity (α-diversity) in each sample was estimated based on the results of the cluster analysis. Bacterial species diversity was represented by two indices: the Chao1 index (Chao, 1984), which measures the minimum number of OTUs based on the observed number of OTUs, and the Shannon H’ index (Shannon, 1948), which indicates the evenness of OTU distribution. Estimation of the two indices and construction of rarefaction curves were performed by tools in QIIME. To normalize the effect of read number variation among the samples on the α-diversity estimates and to compare the α-diversity measures among plant rhizospheres, 2,810 sequences were randomly re-sampled 10 times from each sample. The number 2,810 for the re-sampling was chosen based on the result of rarefaction curve analysis, where among re-sampled data all the plant samples were included and the number of sequence reads was the highest. Since this number (2,810) is smaller than the minimum number of sequence reads (2,920 for T. monococcum) among all the samples, it was possible to conduct the re-sampling process for all the samples including the T. monococcum sample. For the 10 re-sampled sequence sets generated by the rarefaction analysis, the average values of bacterial α-diversity and abundance (the number of OTUs) were calculated over the 10 replicates. To compare the species diversity within a phylum among the samples with that of the control soil, the number of OTUs belonging to each phylum was adjusted to be relative to that of the control soil, defined as the ratio of the two number of OTUs (the plant/the control soil) – 1, as done above.
Analyses of β-diversity
To infer the level of differentiation among plant rhizospheres (β-diversity), the abundant Jaccard index (Chao et al., 2005), which measures similarity in OTU composition between communities, was calculated for all pairwise combinations between samples (171 combinations). Then, the obtained distance matrix based on 1 – the Jaccard index was subjected to principal coordinates analysis (PCoA) (Anderson and Willis, 2003). The distance matrix was also used to construct a dendrogram by the unweighted pair group method with arithmetic mean (UPGMA) method using a QIIME tool and FigTree (v1.3.1). Calculation of the abundant Jaccard index and construction of PCoA plots and UPGMA dendrograms were performed using QIIME tools. To test the effect of the plant genome on the β-diversity in terms of community structure (“location” and “dispersion”) within and between groups (Triticum, Aegilops, NTA and Control), permutational ANOVA (PERMANOVA, Anderson, 2001) was applied to the estimated triangular β-diversity matrix (1 – the Jaccard index), where one-way design for each of the groups, in which factors were fixed, was set up. Contrasts were set for comparisons of particular interest, such as (soil) vs. (Triticum, Aegilops, NTA (rhizosphere)), (Triticum, Aegilops) vs. (NTA), and (Triticum) vs. (Aegilops, NTA). To test statistical significance of the pseudo-F value, the distribution of pseudo-F statistics obtained by permutation of raw data 9,999 times by the unrestricted method was used (P (perm)). For comparisons with insufficient permutations, the Monte Carlo probability test (P (MC), Anderson and Robinson, 2003) was applied. To test the homogeneity of dispersion among the groups, PERMDISP (Anderson, 2006) was used for Triticum and NTA groups, because of the restriction of PERMDISP that the sample size per group must be greater than two. PERMANOVA and PERMDISP were performed using PRIMER v7 and the PERMANOVA+ add-on computer program (http://www.primer-e.com/). The 16S rRNA gene sequences have been deposited under DDBJ accession number DRA004199.
RESULTS
Bacterial composition at the phylum level
The phylum composition in rhizospheric bacterial communities was similar among 18 plant species and control soil (Fig. 1). The total number of phyla in all plant samples was 28 and the average number was 20.8, ranging from 19 (T. monococcum, T. dicoccoides, T. araraticum, T. macha and oat) to 24 (T. aestivum). Seventeen phyla (from Proteobacteria to candidate division WPS-1 in Fig. 1) were detected in all 19 samples, and an 18th phylum, Latescibacteria, was detected in 17 samples (all plant species except T. monococcum and T. sphaerococcum). Seven bacterial phyla (BRC1, Lentisphaerae, Hydrogenedentes, Deinococcus–Thermus, SR1, Tenericutes and Thermodesulfobacteria) were detected only in rhizospheric samples, and three phyla (SR1, Tenericutes and Thermodesulfobacteria) were singletons (represented by one sequence). No phylum was uniquely associated with the level of ploidy (diploid, tetraploid or hexaploid) or the genome (A, B or D). In the control soil sample, 21 bacterial phyla were detected, all of which were also represented in rhizospheric soil samples. There was no statistically significant correlation between the number of bacterial phyla and the number of sequence reads.
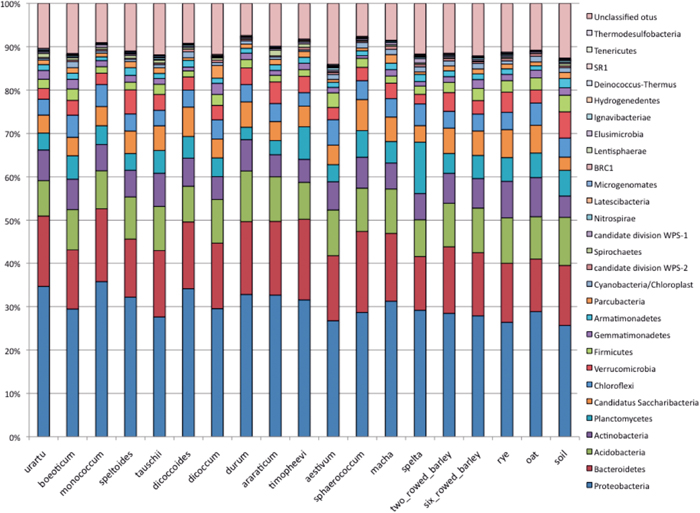
In each sample, the top three phyla (Proteobacteria, Bacteroidetes and Acidobacteria) accounted for more than 50–60% of the phyla detected (Fig. 1). Proteobacteria was the most dominant phylum in all samples (the average was 33.0%, ranging from 23.9% in T. aestivum to 44.1% in T. urartu), and Bacteroidetes and Acidobacteria were the second or third most dominant phyla in most samples (average 16.3% and 9.5%, respectively). Actinobacteria were highly represented in rye (10.2%) and oat (9.6%) and Planctomycetes were highly represented in T. spelta (7.6%). Nevertheless, the average representation of Actinobacteria and Planctomycetes was 5.2% and 2.3%, respectively. Unclassified bacteria (a group belonging to the domain Bacteria but not assigned to any existing phylum) ranged from 6.0% (control soil) to 21.4% (T. dicoccoides). For unclassified bacteria, there was a statistically significant and positive correlation between the percent representation and the number of sequence reads in each sample (r df = 17 = 0.70, P < 0.01). This suggested that the percent representation of unclassified bacteria, while correlated with read number, was not necessarily associated with host plant characteristics or features of a specific rhizospheric bacterial community.
Although there was some variation in composition of bacterial phyla among the samples, no drastic difference was detected (Fig. 1). Actually, a statistically significant rank correlation for the phylum composition was detected for all pairwise comparisons among 19 samples at the 0.01% level. The average value of rank correlation was 0.92, ranging from 0.80 (T. araraticum vs. oat) to 0.98 (T. durum vs. T. macha). This highly significant correlation is probably due to the fact that the most abundant 17 phyla were detected in all 19 samples, as noted above.
The phylum composition averaged for plant genome type (ploidy and genome) was similar (Supplementary Fig. S1). A statistically significant rank correlation was detected for all combinations of ploidy at the 0.01% significance level (the average value was 0.97, ranging from 0.96 for diploid vs. hexaploid to 0.98 for diploid vs. tetraploid) and genome type (the average value was 0.995, ranging from 0.993 for B vs. D to 0.996 for A vs. B). These results indicated that phylum composition was largely independent of the level of ploidy and wheat genome. However, as ploidy increased, the proportion of Proteobacteria seemed to decrease, while A, B and D genomes did not influence the proportion of Proteobacteria.
Bacterial composition at the class and order levels
At the class level, 58 taxa were detected (Supplementary Fig. S2). The number of classes ranged from 35 (T. macha) to 49 (T. aestivum and six-rowed barley), and 30 classes were detected in all 19 samples. No class was uniquely associated with ploidy or wheat genome (A, B or D). In the control soil sample, 47 classes were detected. The class Ardenticatenia, belonging to Chloroflexi, was uniquely detected as a singleton in the control soil sample. A statistically significant correlation was detected between the number of bacterial classes and the number of sequence reads (r df = 17 = 0.80, P < 0.01). This result indicates that the number of classes is likely to increase as sequence reads increase.
In each sample, the top five classes (Alphaproteobacteria, Betaproteobacteria, Acidobacteria_Gp4, Bacteroidetes_incertae_sedis and Sphingobacteria) accounted for about 40–50% of the classes detected, but frequencies of the top five varied by sample (Supplementary Fig. S2). Class composition in each of seven dominant phyla also varied among plant samples, and between plant samples and the control soil sample (Supplementary Figs. S3A–S3G). These results clearly indicated that rhizospheric bacteria community composition was influenced by the host plant. For example, for Proteobacteria (Supplementary Fig. S3A), the percentage of Deltaproteobacteria (12.3%) was higher in control soil than in rhizospheric soil samples (4.9% on average) except T. spelta (14.9%). For Bacteroidetes (Supplementary Fig. S3B), the percentage of class Bacteria_incertae_sedis tended to be lower in NTA samples (ranging from 13.6% to 21.9%) than in TA samples (44.5% on average, except for T. sphaerococcum (22.9%)). For Verrucomicrobia (Supplementary Fig. S3D), there was a large difference in class composition between the control soil sample and rhizospheric samples. The percentage of class Opitutae in the control soil sample (38.0%) was lower than in rhizospheric samples (80.3% on average, ranging from 54.5% in oat to 92.1% in T. monococcum), while that of class Subdivision 3 in the control soil sample (46.1%) was higher than in rhizospheric samples (10.5% on average, ranging from 5.6% in T. dicoccoides to 20.5% in oat). For the classes belonging to Chloroflexi, Firmicutes and Armatimonadetes (Supplementary Figs. S3E–S3G), class composition was variable among samples. However, no clear association was detected with sample type (control or rhizosphere) or plant genome type (ploidy and genome). Compared with the phylum composition (Fig. 1), the class composition was more variable. However, the composition averaged for genome type (ploidy and genome) was similar (Supplementary Fig. S4).
At the order level, 52 taxa were detected, but the percentage of unclassified sequences was high, at 20–40% (Supplementary Fig. S5A). It was noted that in the control soil sample, the percentage of Myxococcales (9.2%) belonging to Deltaproteobacteria was higher than in rhizospheric samples (1.9% on average). There was slight variation in the composition among samples. The composition averaged for genome ploidy and genome type was similar (Supplementary Fig. S5B).
Comparison of phylum composition among plant rhizospheres and control soil
To examine the effect of biological constitution of these grass species on rhizospheric bacterial community, phylum composition in each plant rhizosphere was adjusted relative to that of the control soil (Fig. 2). Compared with the control soil sample, the relative proportion of phyla generally tended to decrease in the rhizosphere of most of the plants examined, except for notable increases in the relative proportion for Spirochaetes in diploid and tetraploid species, but not in hexaploid or NTA species, and an increase for Cyanobacteria/Chloroplast in most species investigated. It was also noted for all plant samples that the proportion of Acidobacteria decreased and that the proportion of Actinobacteria and unclassified bacteria increased. In NTA plants, the relative ratio of Candidatus Saccharibacteria and Actinobacteria was high, whereas it was not necessarily high in TA species, indicating a differential effect on phylum composition between TA and NTA species.

As ploidy increases, the relative ratio of Bacteroidetes, Acidobacteria, Candidatus Saccharibacteria and candidate division WPS-2 increased, while the ratio of Verrucomicrobia and Spirochaetes decreased (Supplementary Fig. S6A). The Spearman’s correlation coefficients between ploidy level and relative ratio were not statistically significant, with one exception: Spirochaetes (r = − 0.999, df = 1, P < 0.05) showed a substantial increase in diploid and tetraploid species, but a decrease in hexaploid species, resulting in a significantly negative correlation (Fig. 2 and Supplementary Fig. S6A). The ratio was not correlated with the A, B or D genome, except for Spirochaetes, which showed an association between an extremely high ratio and the A genome (Supplementary Fig. S6B).
The relative proportion was converted to show results for each of 19 phyla and unclassified bacteria (Fig. 3). The proportion of most bacterial phyla changed in the same direction (relative to control) for the majority of plants examined. The relative proportions of Proteobacteria and Bacteroidetes, which were the most and second most abundant bacterial phyla detected in this study, were similar in rhizospheric and control soil samples. On the other hand, the relative proportion of Acidobacteria, the third most abundant phylum, was consistently lower in rhizospheric samples. The relative proportion of Candidatus Saccharibacteria and Actinobacteria increased in almost all samples, and that of Cyanobacteria/Chloroplast increased drastically, except for T. urartu and T. timopheevi. The range varied from unchanged (T. durum) to six times higher (T. monococcum and T. spelta). The relative proportion of Spirochaetes was especially high in T. urartu, T. boeoticum, Ae. tauschii, T. araraticum and T. timopheevi (four to 10 times higher than in control soil), while in the other plant samples the proportion was almost the same as or lower than in the soil sample. The relative proportion of unclassified bacteria was higher in all rhizospheric samples than in control soil. These results clearly indicated that different plant species had differential effects on the phylum composition of rhizospheric bacterial communities.

DNA sequence reads were subjected to cluster analysis using the criterion of 3% nonidentity to define an OTU (species). The data show that the rarefaction curve for each sample did not plateau, indicating that the observed number of OTUs was insufficient to represent the actual bacterial diversity of any sample (Supplementary Fig. S7). Estimated bacterial species diversity and abundance are summarized in Table 2. The total number of OTUs detected was 7,580, and the average number of OTUs per sample was 1,357, ranging from 925 (T. monococcum) to 1,951 (six-rowed barley). In all samples, the average number of sequences per OTU was 3.5, ranging from 2.8 (T. spelta) to 4.6 (Ae. speltoides). The estimated Chao1 index for the entire data set was 16,538.6, and the average Chao1 index was 2,363, ranging from 1,742 (T. dicoccoides) to 3,441 (soil). The average Shannon index was 6.3, ranging from 5.7 (T. dicoccoides) to 6.7 (T. dicoccum). The average percent singleton OTUs was high (51.7%), ranging from 46.2% (six-rowed barley) to 57.7% (T. timopheevi), indicating low density for each OTU in rhizospheric and control soil (Table 2). The high estimated Shannon indices indicated that distribution of OTUs was skewed toward low abundance, corresponding to the high proportion of singleton OTUs. The average percent OTUs unique to one sample was 15.4%, ranging from 10.8% (T. monococcum) to 23.5% (soil).
Table 2. Summary of bacterial diversity and abundance of total data
| Sample | Number of reads | Number of OTUs | Chao1 | Shannon | Number of singleton OTUs (%) | Number of specific OTUs (%) | Average number of reads per OTU (%) | Max number of reads per OTU (%) |
|---|
| T. urartu | 4035 | 1177 | 2049.8 | 6.23 | 623 | (52.9) | 156 | (13.3) | 3.4 | (0.08) | 175 | (4.3) |
| T. boeoticum | 4603 | 1409 | 2526.6 | 6.42 | 739 | (52.4) | 233 | (16.5) | 3.3 | (0.07) | 206 | (4.5) |
| T. monococcum | 2920 | 925 | 1770.8 | 5.88 | 524 | (56.6) | 100 | (10.8) | 3.2 | (0.11) | 226 | (7.7) |
| Ae. speltoides | 6251 | 1349 | 2318.7 | 6.06 | 664 | (49.2) | 213 | (15.8) | 4.6 | (0.07) | 388 | (6.2) |
| Ae. tauschii | 4813 | 1448 | 2418.2 | 6.57 | 727 | (50.2) | 183 | (12.6) | 3.3 | (0.07) | 82 | (1.7) |
| T. dicoccoides | 3964 | 1020 | 1741.9 | 5.68 | 527 | (51.7) | 118 | (11.6) | 3.9 | (0.10) | 453 | (11.4) |
| T. dicoccum | 5066 | 1572 | 2711.0 | 6.67 | 792 | (50.4) | 291 | (18.5) | 3.2 | (0.06) | 154 | (3.0) |
| T. durum | 3679 | 1149 | 2000.1 | 6.02 | 618 | (53.8) | 134 | (11.7) | 3.2 | (0.09) | 315 | (8.6) |
| T. araraticum | 3128 | 983 | 1769.4 | 6.03 | 537 | (54.6) | 123 | (12.5) | 3.2 | (0.10) | 198 | (6.3) |
| T. timopheevi | 3409 | 1093 | 2255.4 | 6.20 | 631 | (57.7) | 143 | (13.1) | 3.1 | (0.09) | 137 | (4.0) |
| T. aestivum | 6451 | 1600 | 2846.7 | 6.40 | 801 | (50.1) | 267 | (16.7) | 4.0 | (0.06) | 343 | (5.3) |
| T. sphaerococcum | 4580 | 1145 | 1951.2 | 5.82 | 592 | (51.7) | 162 | (14.1) | 4.0 | (0.09) | 369 | (8.1) |
| T. macha | 3547 | 1152 | 1873.0 | 6.24 | 590 | (51.2) | 160 | (13.9) | 3.1 | (0.09) | 209 | (5.9) |
| T. spelta | 3541 | 1259 | 2416.8 | 6.37 | 711 | (56.5) | 247 | (19.6) | 2.8 | (0.08) | 144 | (4.1) |
| two-rowed barley | 6364 | 1575 | 2459.5 | 6.32 | 747 | (47.4) | 251 | (15.9) | 4.0 | (0.06) | 337 | (5.3) |
| six-rowed barley | 8068 | 1951 | 3220.8 | 6.69 | 902 | (46.2) | 377 | (19.3) | 4.1 | (0.05) | 249 | (3.1) |
| rye | 6289 | 1735 | 2896.7 | 6.69 | 834 | (48.1) | 312 | (18.0) | 3.6 | (0.06) | 165 | (2.6) |
| oat | 4526 | 1362 | 2223.4 | 6.41 | 680 | (49.9) | 218 | (16.0) | 3.3 | (0.07) | 209 | (4.6) |
| soil | 6440 | 1871 | 3440.9 | 6.63 | 958 | (51.2) | 439 | (23.5) | 3.4 | (0.05) | 513 | (8.0) |
| Total | 91674 | 7580 | 16538.6 | 7.12 | 3710 | (48.9) | 4127 | (54.4) | 12.1 | (0.01) | 3611 | (3.9) |
| Average | 4825 | 1357 | 2362.7 | 6.28 | 695 | (51.7) | 217 | (15.4) | 3.5 | (0.08) | 256 | (5.5) |
Genome ploidy and type did not appear to influence bacterial species diversity in rhizospheric soil samples (Table 2). For three AA diploid species, T. urartu, T. boeoticum and T. monococcum, α-diversity in the rhizosphere was variable (1,177, 1,409 and 925 OTUs and 2,049.8, 2,526.6 and 1,770.8 Chao1 indices, respectively). For AABB tetraploid species, the estimated rhizospheric bacterial diversity was also variable, with OTUs and Chao1 indices as follows: T. dicoccoides, 1020 and 1,741.9; T. dicoccum, 1,572 and 2,711.0; and T. durum, 1,149 and 2,000.1. For AAGG tetraploid species, OTUs and Chao1 indices were as follows: T. araraticum, 983 and 1,769.4; T. timopheevi, 1,093 and 2,255.4. For the four hexaploid AABBDD species, OTUs and Chao1 indices were: T. aestivum, 1,600 and 2,846.7; T. sphaerococcum, 1,145 and 1,951.2; T. macha, 1,152 and 1,873.0; and T. spelta, 1,259 and 2,416.8. These results indicated that factor(s) other than genome ploidy and type influenced species diversity in rhizospheric bacterial communities. Since genome type is based on a qualitative measure of the similarity between two genomes (i.e., intensity of chromosome pairing in hybrids between two species), nucleotide substitutions, indels, chromosomal rearrangements and other forms of genetic variation can exist between two genomes with the same constitution. This genetic variation may be responsible for the variation in species diversity of rhizospheric bacterial communities among species with the same genome constitution.
Correlation coefficients between estimated α-diversity measures (Table 2) are summarized in Table 3. Statistically significant and positive correlation was detected between the number of sequence reads and α-diversity (Table 3), suggesting that read number variation influenced α-diversity. In other words, as the number of reads increases, estimated α-diversity increases. To eliminate this effect, α-diversity was recalculated, after resampling an identical number of sequence reads per sample (n = 2,810) (Supplementary Table S4). The results were similar to the results for the raw data (Table 2). The control soil sample had the highest number of OTUs (1,187) and the highest Chao1 index (2,335). The highest Shannon index (6.5) was estimated for T. dicoccum. Also, T. dicoccoides had the lowest number of OTUs (849), and the minimum Chao1 (1,548) and Shannon indices (5.6). Although there was some discrepancy in the rank of α-diversity estimates for the resampled data sets, the samples with high α-diversity in the raw data (such as soil and six-rowed barley) had high α-diversity after read number adjustment, and vice versa. For example, in both data sets, T dicoccum and T. durum had higher α-diversity, while T. monococcum and T. araraticum had lower α-diversity. Moreover, statistically significant, positive correlations were detected for bacterial diversity between raw and resampled data (r df = 17 = 0.78, P < 0.01 for the number of OTUs, r df = 17 = 0.82, P < 0.01 for Chao1 index and r df = 17 = 0.98, P < 0.01 for Shannon index). These results indicated that the relative relationships of bacterial diversity among samples were not influenced by the number of sequence reads per sample. It was concluded that bacterial α-diversity in the rhizosphere was influenced by unknown factor(s) inherent to each plant species. The number of OTUs and the Chao1 index averaged over plant genome type (Supplementary Table S5) were approximately 103 and 2,000, respectively, for all genome types (ploidy and genome), and hexaploid and D genome had higher estimated values than other ploidy or genome types. NTA samples had higher bacterial diversity than TA samples. Finally, it should be noted that in both data sets (raw and resampled), bacterial abundance was highest in the control soil sample (Table 2 and Supplementary Table S4), indicating that rhizospheres of the investigated plants influenced bacterial community structure, reducing the bacterial species diversity.
Table 3. Correlation coefficient between α-diversity measures
| Number of reads | Number of OTUs | Chao1 index | Shannon index | Number of singleton OTUs | Number of specific OTUs | Average number of reads per OTU |
|---|
| Number of OTUs | 0.909 ** | | | | | | |
| Chao1 index | 0.821 ** | 0.955 ** | | | | | |
| Shannon index | 0.591 ** | 0.845 ** | 0.840 ** | | | | |
| Number of singleton OTUs | 0.822 ** | 0.974 ** | 0.991 ** | 0.874 ** | | | |
| Number of specific OTUs | 0.815 ** | 0.948 ** | 0.963 ** | 0.802 ** | 0.968 ** | | |
| Average number of reads per OTU | 0.695 ** | 0.327 | 0.203 | −0.137 | 0.177 | 0.213 | |
| Max number of reads per OTU | 0.345 | 0.142 | 0.132 | −0.347 | 0.105 | 0.223 | 0.591 ** |
** significant at 1% level.
It was noted that the number of OTUs, Chao1 index, Shannon index, number of singleton OTUs and number of specific OTUs were mutually, significantly and positively correlated, in addition to the correlation between the number of sequence reads and number of OTUs noted above (Table 3). Notably, the Shannon index correlated positively with the Chao1 index and the number of singleton OTUs, indicating that the bias of OTU distribution was associated with overall OTU abundance and the abundance of rare OTUs.
Bacterial species diversity in rhizospheric and control soil
Bacterial species diversity (the number of OTUs) for each bacterial phylum, calculated using resampled data, is presented in Supplementary Fig. S8. The three most dominant phyla (Proteobacteria, Bacteroidetes and Acidobacteria) and unclassified bacteria had higher species diversity than other phyla in all samples. To eliminate the influence of the soil and to reveal the effect of plant species on rhizospheric bacterial community diversity, the number of OTUs for each phylum was adjusted relative to that of the control sample; the results are shown for each plant rhizosphere (Fig. 4). In general, the relative ratio for most bacterial phyla was lower in rhizospheric soil than in control soil, corresponding to the estimated higher bacterial species diversity in control soil (Table 2). On the other hand, a high relative ratio (> 2) was detected for some bacterial phyla (such as Microgenomates in T. urartu and Ae. tauschii, and candidate division WPS-1 in T. spelta), but specific bacterial phyla with a high ratio varied by plant.

The relative ratios of the 18 rhizospheric samples were converted to show results for each of 19 phyla and unclassified bacteria (Fig. 5). The ratio for the two dominant phyla, Proteobacteria and Bacteroidetes, was much lower than that for other phyla in all samples. In other words, the number of OTUs of these two dominant phyla was similar in rhizospheric soil and control soil (Supplementary Fig. S8). The ratio for the third most abundant phylum, Acidobacteria (also for Verrucomicrobia, Firmicutes, Armatimonadetes, Nitrospirae, Latescibacteria and unclassified bacteria), was negative in all rhizospheric samples (Fig. 5). This is similar to the results for the relative proportion of bacterial phyla in rhizospheric vs. control soil, except for unclassified bacteria, as presented in Fig. 3. On the other hand, in the phylum Candidatus Saccharibacteria, the ratio was higher in rhizospheric soil than in control soil, although the increase was not large. For Spirochaetes, whose proportion was high in some samples (T. urartu, T. boeoticum, Ae. tauschii, T. araraticum and T. timopheevi) compared with the soil sample (Fig. 3), the number of OTUs either did not change or decreased in most samples (Fig. 5). Similarly, the number of OTUs belonging to Cyanobacteria/Chloroplast was the same or lower in rhizospheric samples than in the control sample (Fig. 5), while the proportion of this phylum was higher in all the rhizospheric samples except two (T. urartu and T. timopheevi) (Fig. 3). These results indicated that the relative ratios of bacterial species diversity in rhizospheric vs. control soil were generally similar, with some exceptions. When averaged for plant genome types (ploidy and genome), the relative ratio to the soil sample was similar (Supplementary Fig. S9), indicating that plant genome type did not influence the relative bacterial species diversity, when analyzed (or stratified) by bacterial phylum.

The proportion of OTUs shared between different samples was determined for all pairwise combinations (Table 4). It is unlikely that OTUs detected in two rhizospheres reflect independent events, occurring during the course of this experiment (for example, water and wind). Therefore, we assumed that shared OTUs existed in the soil at the beginning and persisted until the end of the experiment. If this assumption is correct, the proportion of shared OTUs between samples could be a measure of how much the original OTU composition was retained in the rhizospheric bacterial community. In other words, a high proportion of shared OTUs could indicate similar influences (or weak selective pressure) of paired plants on their respective rhizospheric bacterial communities. The average proportion of shared OTUs between rhizospheres was 41.8%, ranging from 28.6% (Ae. speltoides vs. rye) to 58.8% (six-rowed barley vs. rye). Within each of Triticum, Aegilops and NTA species, the average proportion of shared OTUs was 49%, 52.6% and 55.8%, respectively, while between the three groups, the average values were 34.7% between Triticum and Aegilops, 31.9% between Triticum and NTA, and 51.9% between Aegilops and NTA. As expected from species classification, the proportion of shared OTUs within a group was higher than between groups. For comparisons involving control soil, the average proportion of shared OTUs over all the rhizospheric samples was 36.2%, which was lower than the overall average (41.3%), indicating that bacterial species (OTUs) were more likely to be eliminated in rhizospheric soil than in control soil. This is consistent with the result that bacterial species diversity was lower in plant rhizospheric soils than in the control soil (Table 2). This rhizospheric effect of reducing OTU diversity was different among plant groups. The average proportion of shared OTUs between control soil and Triticum species was 29.3%, which was much lower than that between control soil and Aegilops species (48.9%) or between control soil and NTA species (50.4%). This result indicated that in the Triticum rhizosphere, selection of bacterial species (OTUs) may be stronger than in Aegilops- or NTA species-associated rhizospheres. The results mentioned above were also confirmed after eliminating singleton OTUs from the dataset (Supplementary Table S6).
Table 4. Proportions of shared OTUs among samples for all pairwise combinations
| ura1 | boe2 | mon3 | splt4 | tau5 | dco6 | dcm7 | dur8 | ara9 | tim10 | aes11 | sph12 | mah13 | spa14 | two15 | six16 | rye | oat |
|---|
| T. boeoticum | 51.4 | | | | | | | | | | | | | | | | | |
| T. monococcum | 48.2 | 46.5 | | | | | | | | | | | | | | | | |
| Ae. speltoides | 34.8 | 34.4 | 32.5 | | | | | | | | | | | | | | | |
| Ae. tauschii | 36.3 | 36.3 | 32.3 | 52.6 | | | | | | | | | | | | | | |
| T. dicoccoides | 50.3 | 49.7 | 48.1 | 34.9 | 35.7 | | | | | | | | | | | | | |
| T. dicoccum | 51.8 | 52.3 | 45.1 | 34.3 | 36.1 | 47.7 | | | | | | | | | | | | |
| T. durum | 50.9 | 51.8 | 49.8 | 35.7 | 36.1 | 51.9 | 50.8 | | | | | | | | | | | |
| T. araraticum | 49.7 | 47.9 | 47.7 | 36.0 | 34.5 | 46.7 | 47.9 | 49.9 | | | | | | | | | | |
| T. timopheevi | 49.9 | 49.2 | 48.5 | 35.7 | 35.1 | 50.4 | 48.9 | 49.8 | 50.5 | | | | | | | | | |
| T. aestivum | 50.8 | 52.2 | 46.4 | 33.6 | 36.8 | 49.4 | 52.5 | 53.3 | 47.2 | 48.5 | | | | | | | | |
| T. sphaerococcum | 48.9 | 50.1 | 45.6 | 32.9 | 35.4 | 52.3 | 49.2 | 51.5 | 47.2 | 47.5 | 50.5 | | | | | | | |
| T. macha | 50.2 | 51.0 | 48.4 | 34.2 | 34.4 | 49.6 | 51.2 | 51.0 | 49.1 | 48.5 | 50.1 | 48.9 | | | | | | |
| T. spelta | 44.7 | 49.1 | 45.7 | 32.5 | 33.3 | 46.0 | 46.6 | 46.1 | 45.5 | 44.8 | 46.7 | 47.0 | 47.4 | | | | | |
| barley (two) | 33.9 | 33.4 | 29.6 | 50.3 | 54.8 | 34.1 | 33.8 | 33.8 | 30.6 | 31.6 | 35.7 | 34.3 | 31.5 | 30.6 | | | | |
| barley (six) | 32.4 | 32.9 | 28.6 | 49.9 | 54.5 | 31.7 | 34.0 | 33.3 | 29.0 | 30.8 | 36.0 | 33.0 | 30.4 | 30.2 | 57.9 | | | |
| rye | 33.1 | 32.3 | 28.6 | 49.6 | 55.2 | 32.5 | 33.7 | 32.7 | 29.0 | 30.8 | 34.7 | 33.8 | 31.0 | 30.2 | 56.0 | 58.8 | | |
| oat | 31.2 | 31.4 | 28.8 | 48.0 | 52.5 | 32.7 | 31.6 | 33.0 | 29.1 | 29.5 | 34.1 | 32.7 | 31.7 | 29.9 | 53.2 | 54.2 | 54.4 | |
| soil | 29.7 | 31.7 | 26.2 | 47.1 | 50.6 | 28.5 | 32.3 | 30.2 | 27.2 | 27.9 | 32.0 | 29.4 | 28.7 | 27.9 | 50.3 | 53.4 | 51.2 | 46.5 |
1T. urartu, 2T. boeoticum, 3T. monococcum, 4Ae. speltoides, 5Ae. tauschii, 6T. dicoccoides, 7T. dicoccum, 8T. durum, 9T. araraticum, 10T. timopheevi, 11T. aestivum, 12T. sphaerococcum, 13T. macha, 14T. spelta, 15two-rowed barley, 16six-rowed barley.
To investigate relative divergence of bacterial composition among samples, PCoA plots (Fig. 6) and UPGMA dendrograms (Supplementary Fig. S10) were constructed based on the 1 – abundant Jaccard index, which measures dissimilarity of OTU composition between samples. In the PCoA plot, four groups, 12 Triticum samples with A genome, two Aegilops samples (Ae. tauschii with D genome and Ae. speltoides with S (B) genome), four NTA samples, and the control soil sample, were clearly separated from each other. The control soil sample was well separated from the rhizospheric samples, at the far-upper end of the 2nd quadrant. The Triticum group was on the positive side of the PC1 axis, which explained 28.9% of the total variation, and the Triticum samples were scattered on the positive and negative sides of the PC2 axis, which explained approximately 11.0% of the total variation. This result implied that B and D genomes and ploidy in the Triticum species had secondary effects on rhizospheric bacterial community structure. In contrast, the A genome could be regarded as dominant over the B and D genomes, with respect to the effect on composition of the rhizospheric bacterial community. The Aegilops and NTA groups were on the negative side of the PCI axis, and on the positive and negative sides of the PC2 axis, respectively.
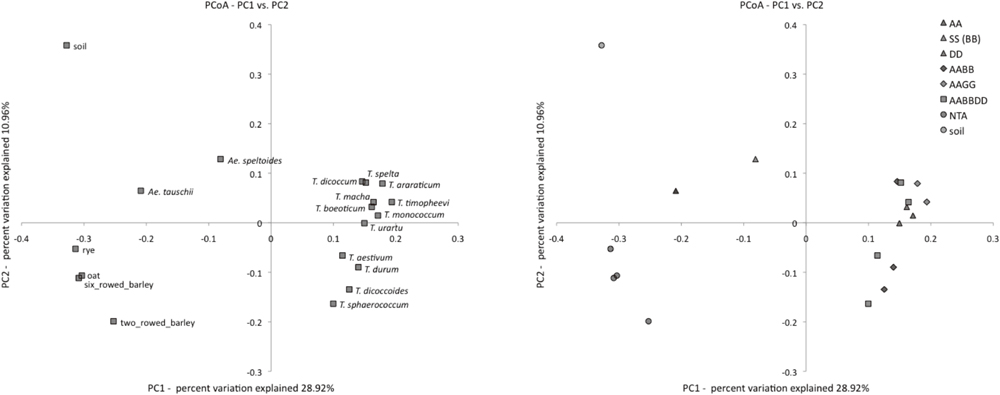
In the UPGMA dendrogram using the abundant Jaccard index (Supplementary Fig. S10), 12 Triticum samples were monophyletically clustered, and other samples (Aegilops and NTA) formed two different clusters. The control soil sample was located on the outermost branch of the non-Triticum cluster. In the Triticum cluster, genome type (ploidy and genome (B, D)) did not seem to influence clustering among the Triticum samples, but T. araraticum and T. timopheevi, both of which have the same genome type (AAGG), were close to each other. In the non-Triticum cluster, two Ageilops samples formed a subcluster, but their external branches were long. These results were basically consistent with those obtained from the PCoA analysis (above), and clearly showed that the bacterial composition of control soil and rhizospheric soil were distinct and demonstrated plant species-specific influences (e.g., plant genetics and physiology).
To test the statistical significance of these observations, PERMANOVA was applied to the distance matrix based on the abundant Jaccard index (Table 5). The 19 samples were classified into four groups (Triticum, Aegilops, NTA and Control). The overall analysis indicated highly significant differentiation in bacterial composition among the four groups, as expected from the PCoA and dendrogram analysis described above (Fig. 6 and Supplementary Fig. S10). Although the soil sample was distantly located from rhizospheric samples in the PCoA plot (Fig. 6), comparison between the control soil and rhizosphere (contrast, S vs. (T, A, R)) was marginally significant by the permutation test and significant by the Monte Carlo probability test. In pairwise comparisons, the Triticum group was highly divergent from the Aegilops and NTA groups. None of the tests involving the soil sample were significant. This was due to low statistical power. PERMDISP analysis indicated that Triticum had a larger dispersion than NTA (F = 8.24, df1 = 1, df2 = 14, P = 0.012), as expected from the difference in dispersion between groups (Fig. 6).
Table 5. PERMANOVA analysis to test the differentiation of bacterial species composition among the 19 samples including control soil
| a) Overall analysis |
|---|
| Source | df | SS | MS | Pseudo-
F | P (perm) | # of unique
perm. | P (MC) |
|---|
| Group | 3 | 1.16 | 0.39 | 3.77 | 0.0001 | 9858 | 0.0001 |
| S vs. (T, A, R) | 1 | 0.30 | 0.30 | 2.13 | 0.0532 | 19 | 0.0399 |
| (T, A) vs. R | 1 | 0.57 | 0.57 | 4.99 | 0.0002 | 2946 | 0.0004 |
| T vs. (A, R) | 1 | 0.66 | 0.66 | 6.03 | 0.0001 | 7597 | 0.0002 |
| Residual | 15 | 1.55 | 0.10 | | | | |
| Total | 18 | 2.71 | | | | | |
Contrasts are shown below Group.
Abbreviations in contrast are S: soil; T: Triticum; A: Aegilops; R: NTA.
perm.: permutations.
| b) Pairwise analysis |
|---|
| Comparison | t | P (perm) | # of unique
perm. | P (MC) |
|---|
| Triticum vs. Aegilops | 1.67 | 0.0104 | 91 | 0.004 |
| Triticum vs. NTA | 2.50 | 0.0007 | 1808 | 0.0001 |
| Triticum vs. Control soil | 1.90 | 0.0699 | 13 | 0.0019 |
| Aegilops vs. NTA | 1.41 | 0.067 | 15 | 0.1375 |
| Aegilops vs. Control soil | 1.29 | 0.3356 | 3 | 0.3735 |
| NTA vs. Control soil | 1.54 | 0.1986 | 5 | 0.121 |
DISCUSSION
Bacterial phylum composition in rhizospheres and control soil
In this study, Proteobacteria, Bacteroidetes and Acidobacteria were the three top-ranked dominant phyla in most rhizospheric samples as well as control soil, accounting for 50–60% of detected phyla. This largely agrees with the results of a pyrosequencing study (Donn et al., 2014) of the 16S rRNA gene on the bread wheat rhizosphere in which Proteobacteria, Bacteroidetes and Actinobacteria were dominant, while the proportion of Acidobacteria was low (less than 10%). A pyrosequencing analysis of the 16S rRNA gene on rhizospheric bacterial communities of A. thaliana showed that the dominant phyla were Proteobacteria, Bacteroidetes and Actinobacteria, and that Acidobacteria was the fourth dominant phylum (Lundberg et al., 2012). Another study of A. thaliana has shown that Proteobacteria, Acidobacteria, and Planctomycetes were the three dominant phyla in the rhizosphere, but their proportions were different between two soils used for the study, clay- and silt-rich soil and sand-rich soil (Bulgarelli et al., 2012). In maize rhizospheres, Proteobacteria and Bacteroidetes were dominant (Peiffer et al., 2013), and in rice rhizospheres, Proteobacteria and Acidobacteria were dominant (Spence et al., 2014), based also on pyrosequencing analyses of the 16S rRNA gene. These differences in the rhizospheric bacterial community composition may be related to the variability of host plants, experimental and soil conditions or other unknown factors.
In this study, the phylum composition in rhizospheres was similar for Triticum, Aegilops and NTA species. However, the relative proportions of phyla were variable and different from control soil, indicating that the biological constitution of the host plant clearly influences the rhizospheric bacterial community structure at the phylum level. Compared with control soil, the proportion of some phyla varied in rhizospheric samples. For example, the proportion of Actinobacteria (ranked 6th overall) and Spirochaetes (ranked 12th) was drastically increased in some plant rhizospheres (rye and barley for Actinobacteria, and T. urartu, T. boeoticum, Ae. tauschii, T. araraticum and T. timopheevi for Spirochaetes; Fig. 2), while for other rhizospheric samples, the proportion was almost the same as or less than for control soil. These changes may reflect host plant-specific effects, although the nature of such effects is not clear. The proportions of Proteobacteria and Bacteroidetes, the two most dominant phyla, were almost the same in rhizospheric samples and the control (Fig. 3). As a result, a rank correlation test showed that phylum composition is similar in all 19 samples. The proportion of Acidobacteria, the third most dominant phylum, was lower in rhizospheres, while Actinobacteria and Candidatus Saccharibacteria (ranked 4th) were higher. Acidobacteria is abundant in soil all over the world (Chu et al., 2010; Singh et al., 2012; Tripathi et al., 2012; Miyashita et al., 2013; Ito et al., 2017). Actinobacteria was also detected in rhizospheres (Donn et al., 2014) and the endophytic compartment of roots of A. thaliana (Bulgarelli et al., 2012; Lundberg et al., 2012). The lower abundance of Acidobacteria and higher abundance of Actinobacteria (negative correlation between the abundance of these phyla) may reflect distinct responses to the root environment.
It is possible that the rhizospheric samples investigated in this study include endophytic bacteria and/or inner contents of roots; in fact, Cyanobacteria (potentially from plant chloroplasts) were more abundant in most rhizospheric samples than in control soil (Fig. 3). In addition, the higher proportion of unclassified bacteria in rhizospheric soil (Fig. 3) might reflect the presence of plant material in the rhizospheric samples. This is consistent with the significant positive correlation between the number of sequence reads and the proportion of unclassified bacteria.
Bacterial species diversity in rhizospheres and control soil
This study has shown that the bacterial species diversity and evenness in the rhizospheres were reduced in all rhizospheric samples (Table 3), indicating an influence of the host plant on the structure of the rhizospheric bacterial community. This result was contrary to the original ‘rhizosphere effect’ described by Hiltner (1904), which assumed that the number (diversity) and activity of microbes in the vicinity of plant roots would be stimulated (i.e., increased) by root exudation (Bais et al., 2006). Differences in bacterial diversity between rhizospheric and non-rhizospheric soil were reported previously, i.e., in studies of dicot Rumex patientia and monocot Firitillaria thunbergii rhizospheres using PCR–denaturing gradient gel electrophoresis analysis of the 16S rRNA gene (Shi et al., 2011; Qi et al., 2012). The authors concluded that the root exudate would promote accumulation of some but not all bacteria, leading to higher bacterial diversity in the rhizosphere (Qi et al., 2012). Lower bacterial species diversity detected might be specific to the grass species used in this study, or might reflect specific experimental conditions. Additional studies are needed to investigate rhizospheric bacterial community structure in a more diverse group of plant species; such studies would provide greater insight into the ‘rhizosphere effect’.
This study also showed that species diversity of some bacterial phyla (e.g., Candidatus Saccharibacteria and Actinobacteria) was higher in the rhizosphere than in control soil, while for other bacterial phyla, such as Spirochaetes, which was more abundant in rhizospheric soil (Fig. 3), species diversity was lower. These results suggested that the host plant differentially influenced specific OTUs, and that some OTUs are more highly adapted to the rhizospheric environment than others. The estimated evenness of bacterial diversity (Shannon index) was slightly lower in rhizospheric samples (6.3 on average; Table 3) than in the control sample (6.6). This indicated that frequencies of some OTUs in rhizospheres increased, decreasing the OTU distribution bias in the rhizosphere. In other words, lower OTU distribution bias might also reflect adaptation of OTUs to the rhizospheric environment.
In the comparison between rhizosphere and control soil, some OTUs were detected only in rhizospheric samples, some were detected only in the control sample (both specific OTUs in Table 2) and some were detected in both rhizospheres and the control (Table 4). Specific OTUs might have survived in one sample but not the other, reflecting adaptation to one environment but not the other. It was noted that the percentages of specific OTUs in rhizospheres were lower than in the control (Table 2), suggesting stronger selection on the rhizospheric bacterial community. On the other hand, shared OTUs could be a measure of how much the original OTU composition was retained under the influence of plant biology, as mentioned above. In this case, the average proportion of shared OTUs for Triticum species was lower than for Aegilops or NTA species (Table 4), which suggested stronger selective pressure on bacterial community structure in Triticum rhizospheres. Finally, the possibility that some OTUs are of external origin could not be excluded. Possible external sources of OTUs included tap water used for watering, and the greenhouse itself (air), which was not hermetically sealed. Therefore, caution is needed in discussing and interpreting the behavior of specific OTUs in the present study. Unfortunately, the bacterial community in the bulk potting soil was not analyzed before its use in the present experiment, and this information could be important for understanding and interpreting the results of the present study.
Effect of host plant genome type (ploidy and genome) on rhizospheric bacterial community structure
Bread wheat (T. aestivum) has undergone large-scale genetic modification, including two polyploidization events and a long history of artificial breeding (Brenchley et al., 2012). Selective breeding of wheat varieties for specific traits has led to the adaptability of the species for cultivation all over the world. Triticum species were originally classified morphologically, and later found to possess the A genome (Schulz, 1913), common to all species in the genus (Lilienfeld, 1951), indicating a critical role of the A genome in wheat evolution.
This study detected strong selective pressure on bacterial diversity in Triticum rhizospheres (Table 4). Triticum species with the A genome showed the lowest proportion of shared OTUs in comparisons within the plant group and between plants and the control soil. These results suggested that Triticum rhizospheres restricted their bacterial diversity more than those of the B and D genomes, although the exact reason is not clear. Also, the 12 Triticum species used in this study were similar in bacterial species composition, indicated by the close clustering on the PC1 axis in the PCoA plot (Fig. 6) and dendrogram (Supplementary Fig. S10). The Triticum group was differentiated from the Aegilops group (Ae. speltoides and Ae. tauschii), as confirmed by pairwise PERMANOVA analysis. These results indicated that the A genome in the Triticum species has a major effect on rhizospheric bacterial community structure and implies dominance of the A genome over the B and D genomes.
Aira et al. (2010) reported that two genes of maize (su1 and sh2), involved in the plant’s carbon allocation strategy, greatly modified the structure and activity of the maize rhizospheric bacterial community. They proposed that the modification was caused by different root exudates from the two genotypes, since root exudation serves as an important carbon and energy source for microorganisms in the rhizosphere (Bertin et al., 2003). Root exudates containing root-specific metabolites have large influences on soil microbiota and the whole plant itself. By the exudation of a wide variety of compounds, roots influence the microbial community in the rhizosphere, provide resistance to pests, help beneficial symbioses, and inhibit the growth of competing plant species (Bertin et al., 2003; Bais et al., 2006).
Considering the genic effect on the maize rhizospheric bacterial community (Aira et al., 2010), different genomes of Triticum would be expected to exert a much larger effect on rhizospheric bacterial community structure. The strong A genome effects on rhizospheric bacterial community structure detected in this study could be related to diversification in exudates, as well as root architecture and root development, which influence the whole root environment (Bertin et al., 2003; de Graaff et al., 2013). Such influences of the A genome on rhizospheric bacterial community structure might be linked to the critical role of the A genome in wheat evolution and could have been advantageous, leading to wheat cultivation worldwide as an important agricultural food crop.
Although ploidy did not influence the overall bacterial composition or species diversity, the composition and diversity of particular taxa changed with ploidy. The proportion of Proteobacteria decreased as host plant ploidy increased (Supplementary Fig. S1). As ploidy increases, the relative ratio of Bacteroidetes, Acidobacteria, Candidatus Saccharibacteria and candidate division WPS-2 increased, while the ratio of Verrucomicrobia and Spirochaetes decreased (Supplementary Fig. S6A). In the hexaploid, the relative ratio of the number of OTUs of Spirochaetes decreased and that of candidate division WPS-1 increased (Supplementary Fig. S9A). These results suggested that the ploidy effect was not null but did influence rhizospheric bacterial community structure. In A. thaliana, root ploidy controlled potassium uptake and was related to salinity tolerance (Chao et al., 2013), suggesting that polyploidy was advantageous in plant expansion of habitable areas. Similarly, wheat ploidy could have influenced the rhizospheric bacterial community structure, which might have contributed to wheat evolution. However, the exact genetic or physiological basis for the effects of wheat genomes and ploidy on rhizospheric bacterial community structure was not investigated in this study. In future, the relationship between the wheat genomes and rhizospheric bacterial community structure must be clarified based on plant and root physiology, in order to effectively utilize the interaction between wheat root and rhizosphere for wheat breeding and biotechnology.
ACKNOWLEDGMENTS
This paper is contribution #622 from the Laboratory of Plant Genetics, Kyoto University, Japan.
REFERENCES
- Aira, M., Gómez-Brandón, M., Lazcano, C., Bååth, E., and Domínguez, J. (2010) Plant genotype strongly modifies the structure and growth of maize rhizosphere microbial communities. Soil Biol. Biochem. 42, 2276–2281.
- Anderson, M. J. (2001) A new method for non-parametric multivariate analysis of variance. Austral Ecol. 26, 32–46.
- Anderson, M. J. (2006) Distance-based tests for homogeneity of multivariate dispersions. Biometrics 62, 245–253.
- Anderson, M. J., and Robinson, J. (2003) Generalized discriminant analysis based on distance. Aust. N. Z. J. Stat. 45, 301–318.
- Anderson. M. J., and Willis, T. J. (2003) Canonical analysis of principal coordinates: a useful method of constrained ordination for ecology. Ecology 84, 511–525.
- Bais, H. P., Weir, T. L., Perry, L. G., Gilroy, S., and Vivanco, J. M. (2006) The role of root exudates in rhizosphere interactions with plants and other organisms. Annu. Rev. Plant Biol. 57, 233–266.
- Baker, G. C., Smith, J. J., and Cowan, D. A. (2003) Review and re-analysis of domain-specific 16S primers. J. Microbiol. Methods 55, 541–555.
- Bertin, C., Yang, X., and Weston, L. A. (2003) The role of root exudates and allelochemicals in the rhizosphere. Plant Soil 256, 67–83.
- Bond, P. L., Hugenholtz, P., Keller, J., and Blackall, L. L. (1995) Bacterial community structures of phosphate-removing and non-phosphate-removing activated sludges from sequencing batch reactors. Appl. Environ. Microbiol. 61, 1910–1916.
- Brenchley, R., Spannagl, M., Pfeifer, M., Baker, G. L. A., D’Amore, R., Allen, A. M., McKenzie, N., Kramer, M., Kerhornou, A., Bolser, D., et al. (2012) Analysis of the bread wheat genome using whole-genome shotgun sequencing. Nature 491, 705–710.
- Bulgarelli, D., Rott, M., Schlaeppi, K., Ver Loren van Themaat, E., Ahmadinejad, N., Assenza, F., Rauf, P., Huettel, B., Reinhart, R., Schmelzer, E., et al. (2012) Revealing structure and assembly cues for Arabidopsis root-inhabiting bacterial microbiota. Nature 488, 91–95.
- Caporaso, J. G., Bittinger, K., Bushman, F. D., DeSantis, T. Z., Andersen, G. L., and Knight, R. (2010a) PyNAST: a flexible tool for aligning sequences to a template alignment. Bioinformatics 26, 266–267.
- Caporaso, J. G., Kuczynski, J., Stombaugh, J., Bittinger, K., Bushman, F. D., Costello, E. K., Fierer, N., Peña, A. G., Goodrich, J. K., Gordon, J. I., et al. (2010b) QIIME allows analysis of high-throughput community sequencing data. Nat. Methods 7, 335–336.
- Chao, A. (1984) Nonparametric estimation of the number of classes in a population. Scand. J. Statist. 11, 265–270.
- Chao, A., Chazdone, R. L., Colwell, R. K., and Shen, T.-J. (2005) A new statistical approach for assessing similarity of species composition. Ecol. Lett. 8, 148–159.
- Chao, D.-Y., Dilkes, B., Luo, H., Douglas, A., Yakubova, E., Lahner, B., and Salt, D. E. (2013) Polyploids exhibit higher potassium uptake and salinity tolerance in Arabidopsis. Science 341, 658–659.
- Choulet, F., Wicker, T., Rustenholz, C., Paux, E., Salse, J., Leroy, P., Schlub, S., Le Paslier, M.-C., Magdelenat, G., Gonthier, C., et al. (2010) Megabase level sequencing reveals contrasted organization and evolution patterns of the wheat gene and transposable element spaces. Plant Cell 22, 1686–1701.
- Chu, H., Fierer, N., Lauber, C. L., Caporaso, J. G., Knight, R., and Grogan, P. (2010) Soil bacterial diversity in the Arctic is not fundamentally different from that found in other biomes. Environ. Microbiol. 12, 2998–3006.
- Cole, J. R., Wang, Q., Cardenas, E., Fish, J., Chai, B., Farris, R. J., Kulam-Syed-Mohideen, A. S., McGarrell, D. M., Marsh, T., Garrity, G. M., et al. (2009) The Ribosomal Database Project: improved alignments and new tools for rRNA analysis. Nucleic Acids Res. 37, D141–D145.
- de Graaff, M.-A., Six, J., Jastrow, J. D., Schadt, C. W., and Wullschleger, S. D. (2013) Variation in root architecture among switchgrass cultivars impacts root decomposition rates. Soil Biol. Biochem. 58, 198–206.
- Donn, S., Kirkegaard, J. A., Perera, G., Richardson, A. E., and Watt, M. (2014) Evolution of bacterial communities in the wheat crop rhizopshere. Environ. Microbiol. 17, 610–621.
- Hernandez, P., Martis, M., Dorado, G., Pfeifer, M., Gálvez, S., Schaaf, S., Jouve, N., Šimková, H., Valárik, M., Doležel, J., et al. (2012) Next-generation sequencing and syntenic integration of flow-sorted arms of wheat chromosome 4A exposes the chromosome structure and gene content. Plant J. 69, 377–386.
- Hiltner, L. (1904) Über neuere erfahrungen und probleme auf dem gebiete der bodenbakteriologie unter besonderer berücksichtigung der gründüngung und brache. Arb. DLG 98, 59–78.
- Hinsinger, P., Plassard, C., and Jaillard, B. (2006) Rhizosphere: a new frontier for soil biogeochemistry. J. Geochem. Explor. 88, 210–213.
- Huber, J. A., Mark Welch, D. B., Morrison, H. G., Huse, S. M., Neal, P. R., Butterfield, D. A., and Sogin, M. L. (2007) Microbial population structures in the deep marine biosphere. Science 318, 97–100.
- International Wheat Genome Sequencing Consortium (IWGSC) (2014) A chromosome-based draft sequence of the hexaploid bread wheat (Triticum aestivum) genome. Science 345, 1251788.
- Ito, N., Iwanaga, H., Charles, S., Diway, B., Sabang, J., Chong, L., Nanami, S., Kamiya, K., Lum, S., Siregar, U. J., et al. (2017) Geographical variation in soil bacterial community structure in tropical forests in Southeast Asia and temperate forests in Japan based on pyrosequencing analysis of 16S rRNA. Genes Genet. Syst. 92, 1–20.
- Jakubziner, M. M. (1958) New wheat species. In Proc. 1st Int. Wheat Genet. Symp. pp. 207–220. Winnipeg, Canada.
- Kihara, H. (1944) Discovery of the DD-analyser, one of the ancestors of Triticum vulgare. Agric. Hortic, 19, 889–890 (in Japanese).
- Kuske, C. R., Ticknor, L. O., Miller, M. E., Dunbar, J. M., Davis, J. A., Barns, S. M., and Belnap, J. (2002) Comparison of soil bacterial communities in rhizospheres of three plant species and the interspaces in an arid grassland. Appl. Environ. Microbiol. 68, 1854–1863.
- Lilienfeld, F. A. (1951) H. Kihara: Genome-Analysis in Triticum and Aegilops. X. Concluding review. Cytologia 16, 101–123.
- Lundberg, D. S., Lebeis, S. L., Paredes, S. H., Yourstone, S., Gehring, J., Malfatti, S., Tremblay, J., Engelbrektson, A., Kunin, V., Del Rio, T. G., et al. (2012) Defining the core Arabidopsis thaliana root microbiome. Nature 488, 86–90.
- MacKey, J. (1988) A plant breeder’s perspective on taxonomy of cultivated plants. Biol. Zentralbl. 107, 369–379.
- McFadden, E. S., and Sears, E. R. (1944) The artificial synthesis of Triticum spelta. Rec. Genet. Soc. Am. 13, 26–27.
- McFadden, E. S., and Sears, E. R. (1946) The origin of Triticum spelta and its free-threshing hexaploid relatives. J. Hered. 37, 81–89.
- Marcussen, T., Sandve, S. R., Heier, L., Spannagl, M., Pfeifer, M., International Wheat Genome Sequencing Consortium, Jakobsen, K. S., Wulff, B. B. H., Steuernagel, B., Mayer, K. F., et al. (2014) Ancient hybridizations among the ancestral genomes of bread wheat. Science 345, 1250092.
- Massa, A. N., Wanjugi, H., Deal, K. R., O’Brien, K., You, F. M., Maiti, R., Chan, A. P., Gu, Y. Q., Luo, M. C., Anderson, O. D., et al. (2011) Gene space dynamics during the evolution of Aegilops tauschii, Brachypodium distachyon, Oryza sativa, and Sorghum bicolor genomes. Mol. Biol. Evol. 28, 2537–2547.
- Miyashita, N. T. (2015) Contrasting soil bacterial community structure between the phyla Acidobacteria and Proteobacteria in tropical Southeast Asian and temperate Japanese forests. Genes Genet. Syst. 90, 61–77.
- Miyashita, N. T., Iwanaga, H., Charles, S., Diway, B., Sabang, J., and Chong, L. (2013) Soil bacterial community structure in five tropical forests in Malaysia and one temperate forest in Japan revealed by pyrosequencing analyses of 16S rRNA gene sequence variation. Genes Genet. Syst. 88, 93–103.
- Miyashita, N. T., Mori, N., and Tsunewaki, K. (1994) Molecular variation in chloroplast DNA regions in ancestral species of wheat. Genetics 137, 883–889.
- Peiffer, J. A., Spor, A., Koren, O., Jin, Z., Tringe, S. G., Dangl, J. L., Buckler, E. S., and Ley, R. E. (2013) Diversity and heritability of the maize rhizosphere microbiome under field conditions. Proc. Natl. Acad. Sci. USA 110, 6548–6553.
- Petersen, G., Seberg, O., Yde, M., and Berthelsen, K. (2006) Phylogenetic relationships of Triticum and Aegilops and evidence for the origin of the A, B, and D genomes of common wheat (Triticum aestivum). Mol. Phylogenet. Evol. 39, 70–82.
- Qi, X., Wang, E., Xing, M., Zhao, W., and Chen, X. (2012) Rhizosphere and non-rhizosphere bacterial community composition of the wild medicinal plant Rumex patientia. World J. Microbiol. Biotechnol. 28, 2257–2265.
- Quince, C., Lanzén, A., Curtis, T. P., Davenport, R. J., Hall, N., Head, I. M., Read, L. F., and Sloan, W. T. (2009) Accurate determination of microbial diversity from 454 pyrosequencing data. Nat. Methods 6, 639–641.
- Salamini, F., Özkan, H., Brandolini, A., Schäfer-Pregl, R., and Martin, W. (2002) Genetics and geography of wild cereal domestication in the near east. Nat. Rev. Genet. 3, 429–441.
- Schloss, P. D., and Handelsman, J. (2005) Introducing DOTUR, a computer program for defining operational taxonomic units and estimating species richness. Appl. Environ. Microbiol. 71, 1501–1506.
- Schulz, A. (1913) Die Geschichte der kultivierten Getreide. Louis Neberts Verlag, Halle an der Saale, Germany (in German).
- Shannon, C. E. (1948) A mathematical theory of communication. Bell Syst. Tech. J. 27, 379–423.
- Shi, J.-Y., Yuan, X.-F., Lin, H.-R., Yang, Y.-Q., and Li, Z.-Y. (2011) Differences in soil properties and bacterial communities between the rhizosphere and bulk soil and among different production areas of the medicinal plant Fritillaria thunbergii. Int. J. Mol. Sci. 12, 3770–3785.
- Singh, D., Takahashi, K., Kim, M., Chun, J., and Adams, J. M. (2012) A hump-backed trend in bacterial diversity with elevation of Mount Fuji, Japan. Microb. Ecol. 62, 429–437.
- Spence, C., Alff, E., Johnson, C., Ramos, C., Donofrio, N., Sundaresan, V., and Bais, H. (2014) Natural rice rhizospheric microbes suppress rice blast infections. BMC Plant Biol. 14, 130.
- Steel, R. G. D., and Torrie, J. H. (1980) Principles and Procedures of Statistics. McGraw-Hill, NY, USA.
- Tripathi, B. M., Kim, M., Singh, D., Lee-Cruz, L., Lai-Hoe, A., Ainuddin, A. N., Go, R., Rahim, R. A., Husni, M. H. A., Chun, J., et al. (2012) Tropical soil bacterial communities in Malaysia: pH dominates in the equatorial tropics too. Microb. Ecol. 64, 474–484.
- Wieland, G., Neumann, R., and Backhaus, H. (2001) Variation of microbial communities in soil, rhizosphere, and rhizoplane in response to crop species, soil type, and crop development. Appl. Environ. Microbiol. 67, 5849–5854.
