総説
植物のトランスポゾンと高出力シーケンサーを利用した遺伝解析への適用
2015 年 84 巻 4 号 p. 283-294

詳細
2015 年 84 巻 4 号 p. 283-294
Transposable elements (TEs) are mobile genetic elements in the eukaryotic genome. They are divided into two classes (class I: retrotransposons and class II: DNA transposons) based on their structure and manner of transposition. TEs are major components of the eukaryotic genome and retrotransposons are especially abundant in higher-plant genomes. As retrotransposon insertions with high copy numbers are dispersed throughout the genome and are inherited genetically, insertion polymorphisms among crop cultivars have been used as molecular markers. Recently, we developed an efficient method for screening the long terminal repeats (LTRs) of retrotransposon families that exhibit high levels of insertion polymorphisms among crop cultivars using a next-generation sequencing (NGS) platform. This method focuses on the primer binding site (PBS) that is adjacent to the 5' LTR and has a conserved DNA sequence among different LTR retrotransposon families. Construction of a sequencing library through PCR amplification using the PBS conserved sequence allowed us to acquire a large number of LTR sequences and their insertion sites throughout the genome. From our data analysis, we screened the LTR sequences that showed high levels of insertion polymorphism among closely related cultivars. In addition, we identified the insertion sites of these identified LTR retrotransposon families at the genome-wide scale in a number of cultivars with an NGS platform, which enabled us to reveal the genetic relationships among the cultivars and acquire a number of molecular markers for cultivar screening. Our results indicated that the target sequencing of these retrotransposon insertion sites was highly effective for DNA genotyping and marker development without requiring any whole-genome sequence information. This review describes the genomic structure and evolutionary aspects of TEs and discusses the development of molecular markers based on retrotransposon insertion polymorphisms.
Transposable elements (TEs) are a major component of eukaryotic genomes, including those of plants, animals and fungi, and have been considered as an important source of genome diversification and evolution. Barbara McClintock was awarded the Nobel Prize in Physiology or Medicine in 1983 for her discovery of TEs through the study of genetics and cytogenetics in maize (Zea mays) (McClintock, 1950, 1984). After this discovery was confirmed through molecular genetic studies, much research related to these mobile DNAs has been conducted. In addition, we now know that TEs may induce mutations through insertion into protein-coding genes, affect gene transcription via insertion into promoter regions and change gene structure by altering splicing and polyadenylation patterns; TEs can also cause chromosome breakage, illegitimate recombination and genomic rearrangement (Feschotte and Pritham, 2007; Feschotte et al., 2002; Kumar and Bennetzen, 1999; Levin and Moran, 2011; Wessler, 2006).
TEs are divided into two classes (class I and class II) based on their structure and manner of transposition (Fig. 1) (Feschotte et al., 2002; Kumar and Bennetzen, 1999; Wessler, 2006). Retrotransposons belong to class I and transpose by the “copy and paste” method, which involves the reverse transcription of an RNA intermediate and the integration of a cDNA fragment. In contrast, class II (DNA transposon) elements are excised and integrated into new genomic locations through a process called “cut and paste” transposition. Both classes contain autonomous and nonautonomous elements: autonomous elements encode the protein required for their transposition, while nonautonomous elements do not encode any protein and require the protein provided from autonomous elements for their transposition (Fig. 1). Class II contains special element types such as the miniature inverted repeat transposable element (MITE) (Feschotte et al., 2002; Wessler et al., 1995) and Helitron (Kapitonov and Jurka, 2001) (Fig. 1). Although the first TEs, discovered by Barbara McClintock through the observation of kernel pigment mutants in maize, were DNA transposons, determining the whole-genome sequences of several plant species revealed that retrotransposons constitute a much larger fraction of higher-plant genomes. For example, TEs constitute approximately 84% of the barley (Hordeum vulgare) genome, 76% of which consists of retrotransposons (Mayer et al., 2012). In addition, over 75% of the maize genome consists of retrotransposons, whereas DNA transposons occupy only 8.6% of the genome (Schnable et al., 2009). This situation is likely due to the “copy and paste” transposition mechanism of retrotransposons, which increases their copy numbers dramatically and contributes to the expansion of plant genomes (Bento et al., 2013; Kumar and Bennetzen, 1999). Thus, multiple and diverse retrotransposon families with high copy numbers exist in present genomes.

TE classification and structure. LTR: long terminal repeat, CP: capsid protein, PR: protease, IN: integrase, RT: reverse transcriptase, RH: RNaseH, UTR: untranslated region, EN: endonuclease, TIR: terminal inverted repeat. The LTR retrotransposon has LTR sequences (represented as a green box with a yellow triangle inside) at the 5' and 3' ends. The red box and the white box within the LTR retrotransposon indicate a primer binding site (PBS) and polypurine tract (PPT), respectively. Non-LTR retrotransposon has no LTR sequence, but it has a poly(A) tail sequence (represented as an orange box). DNA transposon has TIR sequences (represented as a blue triangle) at both ends. Autonomous elements encode the transposase inside, whereas non-autonomous elements have a mutated transposase (breakage is represented as a red line) or no transposase, such as MITE. Helitron encodes replicase and helicase proteins (represented as a yellow box), and has a small hairpin structure near the 3' end.
Retrotransposons are separated into two major subclasses based on the transposition mechanism and their structure: long terminal repeat (LTR) retrotransposons and non-LTR retrotransposons (Fig. 1) (Feschotte et al., 2002; Havecker et al., 2004; Kumar and Bennetzen, 1999). LTR retrotransposons have LTR sequences at their 5' and 3' ends, and are further classified into Ty1-copia and Ty3-gypsy classes according to the order of their coding proteins, which consist of capsid protein (CP), protease (PR), integrase (INT), reverse transcriptase (RT), and RNaseH (Fig. 1) (Havecker et al., 2004; Kumar and Bennetzen, 1999). Additionally, several nonautonomous elements, such as terminal repeat retrotransposons in miniature (TRIMs) (Antonius-Klemola et al., 2006; Witte et al., 2001) and large retrotransposon derivatives (LARDs) (Kalendar et al., 2004), are known as distinctive members of the LTR retrotransposons (Fig. 1). In the genomes of most plant species, LTR retrotransposons are the most abundant component and are likely responsible for genome expansion and diversification. Non-LTR retrotransposons lack LTR sequences and are divided into long interspersed nuclear elements (LINEs) and short interspersed nuclear elements (SINEs) (Fig. 1) (Feschotte et al., 2002; Kumar and Bennetzen, 1999). Typical LINEs encode RNA binding protein in ORF1, and endonuclease (EN) and reverse transcriptase (RT) in ORF2 (Fig. 1). SINEs are nonautonomous elements, requiring the proteins produced from autonomous elements for their transposition. Both LINEs and SINEs terminate with a poly(A) tail sequence (Fig. 1). In the human genome, the most common retrotransposon is the Alu SINE element, which is 300 bp in length and present in over 1.1 million copies, representing over 10% of the human genome (David et al., 2013; Hormozdiari et al., 2011).
As many retrotransposon insertions are dispersed throughout the genome and are genetically inherited, insertion polymorphisms among crop cultivars have been used for the development of molecular markers for phylogenetic analysis and genetic diversity studies (Kalendar, 2011; Kalendar et al., 2011; Kumar and Hirochika, 2001; Poczai et al., 2013; Schulman et al., 2004). Several kinds of molecular marker have been developed based on these retrotransposon insertion polymorphisms (Fig. 2), including inter-retrotransposon amplification polymorphism (IRAP) (Antonius-Klemola et al., 2006; Belyayev et al., 2010; Kalendar et al., 1999; Nasri et al., 2013; Smýkal et al., 2011), retrotransposon microsatellite amplification polymorphism (REMAP) (Antonius-Klemola et al., 2006; Kalendar et al., 1999, 2000; Nasri et al., 2013), retrotransposon-based insertion polymorphism (RBIP) (Flavell et al., 1998) and sequence-specific amplified polymorphism (S-SAP) (Konovalov et al., 2010; Lou and Chen, 2007; Melnikova et al., 2012; Petit et al., 2010; Syed et al., 2005; Waugh et al., 1997).

Molecular markers based on the retrotransposon insertion polymorphism. IRAP and REMAP amplify the intervening regions between two LTR sequences and between the LTR sequence and the SSR, respectively. RBIP focuses on one insertion site by using primers for its flanking regions. In this method, we use LTR sequence-specific and flanking region-specific primer sets for PCR amplification. S-SAP amplifies the genomic region from the LTR sequence to the nearest restriction site using LTR sequence-specific and adaptor sequence-specific primer sets. The black arrows indicate PCR primers. The pink highlights represent the regions amplified by PCR.
IRAP and REMAP markers were developed by Kalendar et al. (1999) and have been used for DNA fingerprinting in several crop species (Antonius-Klemola et al., 2006; Belyayev et al., 2010; Kalendar et al., 2000; Nasri et al., 2013; Smýkal et al., 2011). Both techniques detect the polymorphism of LTR retrotransposon insertion sites. While IRAP amplifies the intervening genomic region between two LTR sequences by designing one or two PCR primer(s) specific to the LTR sequences, REMAP amplifies the DNA segment between an LTR sequence and a simple sequence repeat (SSR) using LTR-specific and SSR (such as (GA)n or (CT)n sequences)-specific primer combinations (Fig. 2). Although both techniques produce multiple reliable and reproducible bands, they require characterization of the LTR sequences before proceeding with marker development. Thus, the availability of these methods is dependent upon whether suitable LTR sequences have been characterized.
Alternatively, RBIP markers target one retrotransposon insertion at a particular site by employing PCR primers for the flanking regions of an individual insertion site (Fig. 2) (Flavell et al., 1998). In the case of an allele with a retrotransposon insertion, the genomic region is amplified using LTR-specific and flanking region-specific primer sets (Fig. 2), and no amplification is observed with the 5' and 3' flanking region primers because the entire LTR retrotransposon is usually over several thousand bases long. In contrast, an allele containing no retrotransposon insertion produces a PCR band with the 5' and 3' flanking region primers (Fig. 2). This marker can be employed as a codominant marker using three primer sets (LTR-, 5' and 3' flanking region-specific primer sets) at each insertion site, and genotyping may be conducted based on the presence or absence of individual insertions. However, this method requires not only the LTR sequences but also those of the 5' and 3' flanking regions for marker development.
S-SAP was developed through modification of the AFLP method, which has been widely used in several plant species (Konovalov et al., 2010; Lou and Chen, 2007; Melnikova et al., 2012; Petit et al., 2010; Syed et al., 2005; Waugh et al., 1997). After genomic DNA is digested with a restriction enzyme, an adaptor is ligated to the digested DNA fragments. PCR amplification for S-SAP is performed with LTR sequence-specific and adaptor sequence-specific primer combinations (Fig. 2). Transposon display (TD), which is quite similar to S-SAP, has also been widely used (Casa et al., 2000; Hirano et al., 2011; Karki et al., 2009; Shan et al., 2009; Takagi et al., 2007; Van den Broeck et al., 1998; Zhang et al., 2001). These methods differ only in the target TE: S-SAP is used for LTR retrotransposon and TD for DNA transposon. In a single reaction, these methods detect the polymorphism of the distance between the TE insertion site and the nearest restriction cutting site, and display a number of polymorphic bands, with each band representing an individual insertion. In these methods, we can detect different insertion sites in the genome by the selection of restriction enzymes and also adjust the number of generated bands by using PCR primers containing the selective bases. Before these methods are applied, however, the LTR or DNA transposon terminal sequences must be determined. Thus, all of the above techniques rely largely on the availability of LTR sequences. The LTR sequences have been cloned by the PCR amplification of conserved protein-coding domains of the retrotransposons such as RT and INT using degenerate sequence primers followed by genome walking toward the LTR (Tahara et al., 2004). This work can be tedious and time-consuming. More importantly, the insertion polymorphism of the cloned LTR among cultivars must also be investigated because LTR sequences that do not show high levels of insertion polymorphism among cultivars cannot be used for marker development.
Although a large number of retrotransposon families exist in higher-plant genomes, most retrotransposon families with high copy number are currently transpositionally inactive (Feschotte et al., 2002; Kumar and Bennetzen, 1999; Lisch, 2009; Slotkin and Martienssen, 2007). Because TEs are potentially highly mutagenic, host genomes are thought to have evolved epigenetic defense mechanisms against TE transpositional activity, such as DNA methylation and chromatin modification (Blumenstiel, 2011; Lippman et al., 2004; Lisch, 2009; Saze and Kakutani, 2010; Slotkin and Martienssen, 2007; Zhang, 2008; Zhang et al., 2006). In addition, TE activity may be abolished by the accumulation of mutations and deletions within the TE sequence, including its protein-coding region (Slotkin and Martienssen, 2007). For these reasons, most TE families have lost their transpositional activity in present genomes and exhibit low levels of insertion polymorphism among modern crop cultivars. Thus, the identification of these families has been challenging.
Recently, we developed an efficient screening method of those LTR retrotransposon families that show high levels of insertion polymorphism among closely related cultivars using a high-throughput sequencing platform (Monden et al., 2014a, e). We tested this approach in the strawberry (Fragaria × ananassa Duchesne) genome, and determined 24 LTR retrotransposon family candidates. Among them, several families were experimentally confirmed for their high levels of insertion polymorphism among closely related cultivars. We focused on the primer binding site (PBS), the DNA sequence of which is nearly universally conserved among different LTR retrotransposon families. The PBS is located adjacent to the 5' LTR and the site where tRNA binds to the transcribed LTR retrotransposon, and initiates cDNA synthesis of the retrotransposon in the 5' LTR direction. The initiator Met tRNA (iMet tRNA) is most commonly used by many LTR retrotransposon families. Therefore, these families have a common PBS sequence, which is complementary to the 3' end sequence of the iMet tRNA of each species (Hizi, 2008; Kelly et al., 2003; Mak and Kleiman, 1997; Marquet et al., 1995). In a previous study, Kalendar et al. (2010) developed a novel DNA fingerprinting method, which is named iPBS. This method was shown to be highly effective for isolating a wide range of LTR retrotransposon families using only sets of PBS primers and directly visualized the polymorphism among cultivars.
To screen diverse LTR retrotransposon families at a genome-wide scale, we exploited an iPBS method using the Illumina HiSeq 2000 sequencing platform. We constructed a sequencing library based on a conserved PBS motif through PCR amplification with a multiplex barcoding system, which produced a large number of LTR sequences with their inserted site sequences in eight strawberry cultivars (Fig. 3). Paired-end reads of 101 bp were generated on an Illumina HiSeq 2000 platform: the reads from one side (PBS reads) contained the sequences of the PBS and LTR junction, whereas the reads from the other side (non-PBS reads) contained the insertion site sequences or the 5' side LTR sequences in the case of the families with long LTR (Fig. 3). Thus, we mapped the filtered non-PBS reads from each cultivar to the Fragaria vesca reference genome to identify the insertion sites of the LTR sequences (Fig. 3). If the non-PBS read is mapped to more than one site of the same cultivar, the read sequence is a repeat and likely the 5' side LTR. On the other hand, if the non-PBS read is detected only at one site in a single cultivar but not in other cultivars (Fig. 3), this type of insertion should have occurred recently because it has not existed for long enough to be shared among cultivars through sexual propagation. Thus, LTR families containing these unique insertions may have undergone recent transpositional activity. The pooling and clustering of LTR sequences corresponding to these unique insertion sites led to the acquisition of 24 LTR sequence candidates. Finally, the S-SAP analysis confirmed that the identified LTR sequences produced multiple bands, which show high insertion polymorphism among closely related strawberry cultivars (Fig. 3). Thus, our technique provides LTR sequence information that is useful in the development of molecular markers for genetic analyses, construction of linkage maps and cultivar fingerprinting. We also applied this method to obtain suitable LTR sequences in other crop species, including citrus (Citrus clementina, C. sinensis), apple (Malus domestica), and soybean (Glycine max) (unpublished data).

The workflow of our method for identifying the LTR families with high insertion polymorphism using high-throughput sequencing. The black arrows indicate the primers for PCR amplification.
Additionally, we identified a large number of insertion sites for retrotransposon families that showed diverse insertion patterns using high-throughput sequencing (Monden et al., 2014b, c, f; Yamane et al., 2012). To date, we have developed retrotransposon markers for cultivar discrimination and genetic diversity analyses in several crop species, including wheat (Triticum aestivum), sweetpotato (Ipomoea batatas), azuki bean (Vigna angularis), and cultivated strawberry (Akitake et al., 2013; Monden et al., 2013; Nakagawa et al., 2009; Tahara et al., 2007; Takai and Tahara, 2011; Tanaka et al., 2011; Yamane et al., 2012; Yamashita et al., 2008). Here, we describe a successful example in sweetpotato, which is a typical non-model crop species for which whole-genome sequence information is still unavailable (Monden et al., 2014f). We conducted DNA fingerprinting based on the insertion polymorphism of two active retrotransposon families (Rtsp-1 and LIb) (Tahara et al., 2004; Yamashita and Tahara, 2006) that show high insertion polymorphism among sweetpotato cultivars. An Illumina MiSeq library was constructed through the PCR amplification of Rtsp-1 and LIb insertion sites in a number of cultivars, and the sequenced reads were analyzed to identify the insertion sites at which a copy of Rtsp-1 or LIb was determined in at least one cultivar (Fig. 4). We then obtained the genotyping data for the presence or absence of an insertion at each site for the cultivars. Out of these identified insertion sites, we focused on a putative cultivar-specific insertion site that was assumed to exist only in one cultivar and designed PCR primers based on the insertion site sequence (Fig. 5). PCR amplification using the primers of the retrotransposon and inserted site sequences produced a single, reproducible clear band specifically in the target cultivar for this insertion site. This PCR is directly converted into a cultivar-specific sequence-characterized amplified region (SCAR) marker and can be used for cultivar identification (Fig. 5). This marker exploits the uniqueness of a retrotransposon insertion site that is not shared by any other cultivars. Applying this method in several crop species (apple, strawberry, and citrus), we have developed several SCAR markers for cultivar identification (unpublished data). Table 1 shows some of the cultivar-specific SCAR markers developed in our recent studies. In addition, the genetic distance among sweetpotato cultivars was calculated based on the insertion polymorphism of Rtsp-1 and LIb retrotransposons, which revealed their phylogenetic relationships. Our results showed that 76,912 genotyping data points (2,024 retrotransposon insertion loci for 38 cultivars) were obtained from one run of MiSeq sequencing. Thus, this method could achieve efficient DNA fingerprinting of cultivars at a genome-wide scale without requiring whole-genome sequence information.

Target sequencing of retrotransposon insertion sites for DNA fingerprinting. (1) A sequencing library is constructed by PCR amplification with retrotransposon sequence and adaptor sequence-specific primer sets. A multiplex barcoding system allowed for the pooling of multiplex samples in one sequencing run. (2) The constructed library is sequenced on a high-throughput sequencing platform. (3) The sequenced reads are analyzed to identify retrotransposon insertion sites in the cultivars. The black arrows indicate the primers. The boxes bound to the black arrows represent the barcodes for sample discrimination. The pink highlight indicates the amplified genomic region.
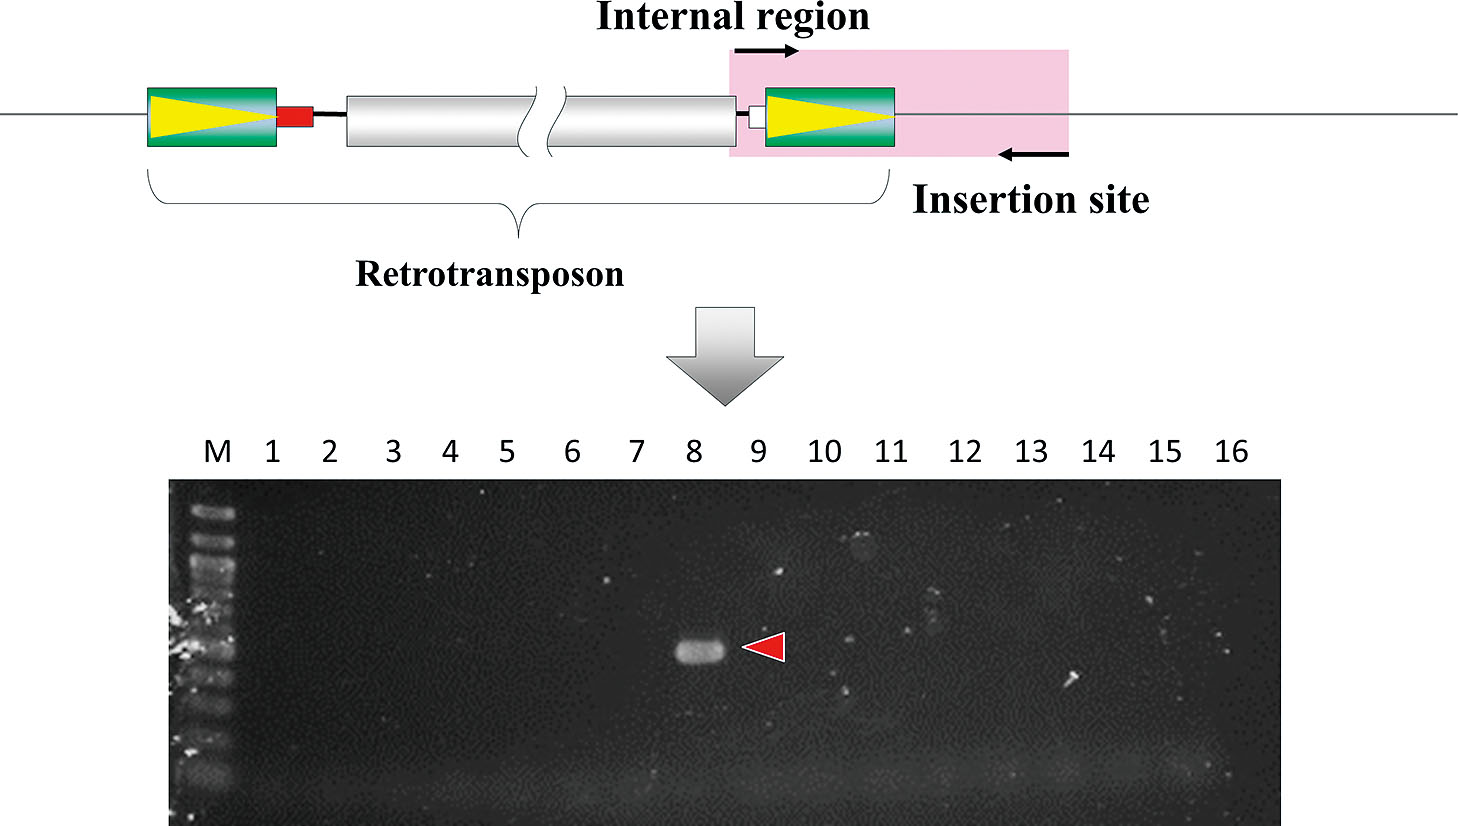
SCAR marker developed for screening sweetpotato cultivars. PCR amplification was performed with retrotransposon-specific and insertion site-specific primer sets. This insertion site sequence was identified by the method shown in Figure 4. The black arrows indicate the PCR primers. The pink highlight represents the region amplified by PCR. M: 100 bp ladder, 1: Hoshikirari, 2: Hoshikogane, 3: Tamaotome, 4: Koganesengan, 5: Konahomare, 6: Daichinoyume, 7: Konamizuki, 8: Joy white, 9: Satsumamasari, 10: Koganemasari, 11: Ayakomachi, 12: Tamaakane, 13: J-Red, 14: Okikogane, 15: Kyushu166gou, 16: 90IDN-47.

List of the horticultural crop cultivars with cultivar-specific identification SCAR markers developed by a retrotransposon insertion site unique to each cultivar.
In addition, we describe one example regarding the retrotransposon-based cultivar discrimination system in strawberry, which is one of the most economically important fruit crops in the world. We focused on the FaRE1 retrotransposon, which has been identified as an active retrotransposon family (He et al., 2010; Melnikova et al., 2012). We applied the S-SAP method to investigate the FaRE1 insertion polymorphism among 32 Japanese cultivars. Our results revealed that this family showed high levels of insertion polymorphisms even among Japanese cultivars, which are known to be genetically closely related (Akitake et al., 2013). After cloning and sequencing of a number of DNA fragments derived from FaRE1 insertion sites, we identified eight insertion sites by considering combinations of their polymorphisms for discriminating 32 strawberry cultivars (Table 2). Our results indicated that the amplification of these eight insertion sites allowed the precise discrimination of strawberry cultivars (Akitake et al., 2013). Moreover, we recently applied a novel method, namely, the single tag hybridization (STH) chromatographic printed array strip (PAS), for DNA signal detection of these eight PCR amplicons (Fig. 6) (Monden et al., 2014d). This novel detection system has some major advantages over standard DNA detection methods, including agarose/acrylamide gel electrophoresis, because it produces multiplex signals for DNA detection with dramatically higher sensitivity in a shorter time without any preparation or staining of a gel. In fact, we successfully evaluated strawberry cultivars based on the multiplex DNA signals that were derived from the amplicons of the FaRE1 retrotransposon and visualized using STH chromatographic PAS (Fig. 6). This method is considered to facilitate rapid, efficient and highly reliable cultivar discrimination of plant materials and agricultural products.

Genotyping data based on eight FaRE1 insertion sites for cultivar discrimination.

Experimental steps for signal detection using STH chromatographic PAS. 1, PCR amplification of cultivar-specific DNA fragments. PCR primers containing the single-stranded tag and spacer sequences were used (for detail, see Monden et al., 2014d). 2, Chromatographic reaction using membrane stick. PCR products were mixed with the dye and developing solution, and membrane stick was dipped into this mixture for 15 min. 3, Signal detection. Blue signal could be detected on the membrane. Patterns of signals determined the target cultivars precisely (for detail, see Monden et al., 2014d).
More recently, we constructed a linkage map using retrotransposon insertion sites in the mapping populations derived from a cross between two different cultivars. We found that these insertion sites were quite useful for linkage map construction in polyploid species, as most heterogenic insertion sites of the parents segregated at a simple ratio (1:1) in hexaploid sweetpotato (2n = 6x = 90) mapping populations (Monden et al., 2015). In outcrossing hexaploid species such as sweetpotato, a two-way pseudo-test cross method has been applied for linkage map construction, which was developed by Grattapaglia and Sederoff (1994). Using this method, two separate linkage maps for each parent are constructed based on the expected segregation ratios of the dominant marker in the mapping progeny. In the hexaploid mapping progeny, several variations in segregation ratio were detected based on allele dosages (simplex, duplex, and triplex) and cytological characteristics (autohexaploid, tetradiploid, and allohexaploid) (Table 3) (Jones, 1967). Out of these markers, simplex markers show a simple segregation ratio (1:1) for any cytological characteristic (Table 3), indicating their appropriateness as molecular markers for linkage map construction. To date, five studies have constructed genetic linkage maps in sweetpotato using RAPD, SRAP, SSR, and AFLP markers (Cervantes-Flores et al., 2008; Kriegner et al., 2003; Li et al., 2010; Ukoskit and Thompson, 1997; Zhao et al., 2013). These studies have employed simplex markers to construct a framework map and then inserted duplex and triplex markers into this map. Thus, obtaining a large number of simplex markers is important for linkage map construction in polyploid species. It was shown that retrotransposon based molecular markers showed an extremely high proportion of simplex markers (~ 90%) in comparison with other molecular marker methods used in sweetpotato (Table 4), which indicates their utility for linkage map construction in this polyploid species. We expect that the identification of a large number of retrotransposon insertion sites will facilitate linkage map construction in polyploid species for quantitative trait locus (QTL) mapping and marker-assisted selection for plant breeding.

The expected segregation ratio (presence: absence) of alleles in a hexaploid.

Summary of the simplex marker ratios of molecular markers analyzed in sweetpotato.
When first discovered, TEs were considered as selfish or junk DNA, but they are now recognized as key components of genome evolution and diversification, as well as gene regulation (Feschotte and Pritham, 2007; Volff, 2006). TEs constitute a considerable fraction of the eukaryotic genome, and LTR retrotransposons are particularly abundant in higher-plant genomes (Bento et al., 2013; Tenaillon et al., 2010). Wide variations of genome size exist among plant species, and a difference of over 2000-fold has been reported between Genlisea margaretae Hutch. (63.4 Mbp) and Paris japonica (149,000 Mbp) (Pellicer et al., 2010); these differences are thought to have been driven by factors such as polyploidization and TE amplification (Bento et al., 2013; Tenaillon et al., 2010). In fact, plant genome size and TE (especially retrotransposon) content are well correlated (Tenaillon et al., 2010): plant species with huge genomes, such as maize and barley, tend to have higher proportions of TEs (> 85%), whereas plant species with smaller genomes, such as Arabidopsis thaliana and Brachypodium distachyon, show lower levels (20%–30%). Insertion sites of retrotransposons with high copy numbers are dispersed throughout the entire genome and are genetically inherited, making their insertion polymorphisms valuable as molecular markers for genetic analysis (Kalendar, 2011; Kalendar et al., 2011; Kumar and Hirochika, 2001; Poczai et al., 2013; Schulman et al., 2004). Although a number of studies regarding the development of molecular markers based on retrotransposon insertion polymorphism have been reported, existing techniques have some limitations; most methods (IRAP, REMAP, RBIP, and S-SAP markers) require known LTR sequences, and can visualize limited numbers of loci through agarose or acrylamide electrophoresis.
With the development of NGS technologies, it is now possible to acquire a vast amount of sequencing data in a short time and at a low cost, which has accelerated genomic and genetic research (Lister et al., 2009). These NGS platforms have also had a significant impact in the field of TE research because a larger number of TE insertion sites for targeted families can now be screened on a genome-wide scale (David et al., 2013; Ewing and Kazazian, 2011; Hormozdiari et al., 2011; Iskow et al., 2010; Kofler et al., 2012; Naito et al., 2009; Urbański et al., 2012; Williams-Carrier et al., 2010; Witherspoon et al., 2010; Xing et al., 2013). Our recent studies have employed these powerful NGS platforms for DNA genotyping and marker development by screening comprehensive LTR sequences and their insertion sites in a number of cultivars, and these insertion sites have proven quite useful for genetic analyses. In fact, we acquired a functional molecular marker for cultivar discrimination using a “unique” insertion site present only in a target cultivar, and we also revealed the genetic relationships among the cultivars of a nonmodel crop species based on the retrotransposon insertion polymorphism, without employing any whole-genome sequence information (Monden et al., 2014f). More recently, we successfully constructed a linkage map based on the retrotransposon insertion sites in a mapping population (Monden et al., 2015). The advent of NGS technologies has led to the development of a number of genetic approaches, including genome-wide association studies (GWAS), restriction-site-associated DNA (RAD) sequencing and MutMap (Abe et al., 2012; Baxter et al., 2011; Elshire et al., 2011; Fekih et al., 2013; Harper et al., 2012; Huang et al., 2010; Morishige et al., 2013; Takagi et al., 2013; Tian et al., 2011). Now, we can employ these effective approaches to speed up plant genetic analysis and promote the isolation of agronomically important genes for plant breeding in a wide range of plant species with the characteristics of polyploidy and huge genome size, even in non-model plant species.