Abstract
The number of leaves in ‘Delaware’ grape is an excellent indicator to determine the optimal timing for gibberellic acid (GA3) application to fruit clusters to induce seedless berries. To predict the optimal timing for GA3 application to ‘Delaware’ grape, we aimed to develop a method to estimate the accumulated leaf number (LN) on the second shoot (which grows from the second dormant bud from the end of the fruiting mother shoot) from the air temperature. This was undertaken using leafing data from a vineyard in Osaka, Japan from 1987 to 2019. Base temperature (Tb, °C), ranging from −2.5 to 12.5°C with step increases of 2.5°C, was estimated using the coefficient of regression determination (R2) between LN and effective accumulative temperature (EAT, °C·day) and two types of root mean square error (RMSE) (RMSE of LN and RMSE of the day when LN reached 10.0 leaves). The LN showed a good fit in linear regression with EAT at every Tb (−2.5 to 12.5°C); in particular, a Tb of 7.5°C yielded the highest R2 and the lowest RMSE. From these results, we determined that the Tb for leaf emergence of ‘Delaware’ grape was 7.5°C. We then compared the estimation accuracy in predicting leaf emergence using EAT (Tb of 7.5°C) (proposed method) and constant leaf emergence rate per day of 0.36 leaves·day−1 (conventional method). As the RMSE when using the proposed method was lower than the RMSE when using the conventional method, the proposed method was more suitable to predict of optimal timing for GA3 application than the conventional method. The findings of this study could be used to predict the optimal timing for GA3 application with high accuracy using LN on the measurement date and forecast values for temperature. Furthermore, the coefficient of the developed equation suggests that the ‘Delaware’ grape develops 4.0 leaves per EAT of 100°C·day with a Tb of 7.5°C.
Introduction
The number of leaves on a plant is related to its development; therefore, it is an excellent indicator for the timing of cultivation management practices, such as fertilization and pest control, in many crops (Gao et al., 1992; Haun, 1973; Inman-Bamber, 1994). The ‘Delaware’ (Vitis labruscana Bailey) is the main table grape cultivar in Japan. An indicator of the optimal timing for gibberellic acid (GA3, 100 ppm) application to fruit clusters of this cultivar to induce seedless berries is the accumulated leaf number (LN) on the second shoot, which grows from the second dormant bud from the end of the fruiting mother shoot (second shoot), finally reaching 10.0 leaves (Kamimori et al., 2020). This method is easy to adopt and most commonly used compared to other methods, such as observation of flower clusters or pollen grains (Kofu city Gibberellin-treatment Committee, 1978). The LN is a result of the integration of the leaf emergence rate (LER, leaves·day−1) over time; thus, the prediction of the LER is useful to estimate the optimal timing for GA3 application using LN (1.0 leaves ≤ LN < 10.0 leaves) on the measurement date.
In many annual crops, the LER is primarily influenced by air temperature among environmental factors (Inman-Bamber, 1994; Ritchie and Nesmith, 1991). Many studies have shown that LN is linearly related to effective accumulative temperature (EAT, °C·day) in some development stages (Boone et al., 1990; Dwyer and Stewart, 1986; Lancaster et al., 1996; Muchow and Carberry, 1989). However, temperature sensitivity was different in each plant studied and there was a threshold or base temperature (Tb, °C) affecting leaf development. Thus, the Tb for calculating the EAT is crucial for high predictive accuracy (Chuine et al., 2003). Although some studies have investigated Tb for leaf emergence using cuttings of grapes in growth chambers (Buttrose, 1969; Moncur et al., 1989), studies on the relationship between leaf emergence and air temperature in fruit trees, including grapes, are limited.
Since 1987, the Research Institute of Environment, Agriculture and Fisheries, Osaka Prefecture (O-REAF) has announced its prediction of the optimal timing for GA3 application to ‘Delaware’ grapes each year using a measurement of the LN from April to May; the days have been predicted assuming that the LN increases with an LER (LN per day) of 0.35 leaves·day−1 from 1.0–10.0 leaves (O-REAF; <http://www.kannousuiken-osaka.or.jp/nourin/gijutsu/techinfo_delaware/index.html>, Accessed: June 1, 2020). If LER, or LN per day can be estimated from air temperature, it will be possible to predict the optimal timing for GA3 application more accurately than this conventional method.
In this study, we aimed to develop a method to estimate leaf emergence from air temperature to predict GA3 application using a dataset of LN for ‘Delaware’ grapes spanning 30 years in Osaka, Japan. We determined the regression between LN and EAT and analyzed the Tb for EAT from these data and the daily mean temperature. Furthermore, the discrepancy between observed value at the vineyard and predicted value by the air temperature or the conventional method were compared.
Materials and Methods
Plant materials and LN measurements
From 1987 to 2019 (except for 1996, 2008, and 2011), we selected three to four ‘Delaware’ grapevines (more than 5 years old) trained on a horizontal trellis with long cane pruning for our experiments. These vines were grown under open field conditions at the O-REAF, located at 34°32' N, 135°35' E, and 70 m altitude. Soil type at the field (vineyard O-REAF) was a fine-textured terrace yellow soil (Cultivated Soil Classification Committee, 1995). Approximately eight-second shoots per vine of three to four vines (20–30 second shoots in total) were selected as targets for measurement. Accumulated leaf number per second shoot (LN, leaves/shoot) was recorded by visual observation every 3–5 days from April to May. This was performed until the LN reached approximately 9.0–10.0 leaves because the optimal timing for GA3 application is when the LN reaches 10.0 leaves. In 2019, to test the range of LN to which a single regression equation could be applied, we continued the measurement until the LN reached approximately 20.0 leaves to investigate changes in sensitivity to temperature.
Moreover, in 2019, to test the adaptability of this method in vineyards under different growing conditions, we conducted a similar survey at another ‘Delaware’ vineyard (vineyard A) under open field conditions in Osaka Prefecture (Located at 34°34' N, 135°37' E, and 58 m altitude). Soil type at vineyard A was classified as coarse-medium-textured haplic brown forest soil (Cultivated Soil Classification Committee, 1995). We selected eight second shoots from one vine (estimated age of the vine was over 10 years) trained on a horizontal trellis with long cane pruning, and the LN was recorded every 4–7 days from April 22 to May 10 (four measurements in total).
Climate data
For air temperature each year, we used the daily mean temperature in the AMGSD system operated by the National Agricultural Research Organization (NARO), Japan, which is a climate dataset with 1-km resolution estimated using statistics from meteorological observation stations of the Japan Meteorological Agency (Ohno et al., 2016). We entered the latitude and longitude of each vineyard into the AMGSD and obtained the daily mean temperature of a 1 km × 1 km mesh.
Data analysis
The effective accumulative temperature (EAT, °C·day) was calculated according to Eq. 1;
|
EAT=∑Tmean-Tb
ifTmean<TbthenTmean=Tb
| (1) |
where Tmean (°C) is daily mean temperature from the starting date to each measurement date, and Tb (°C) is the base temperature. The starting date of the calculation was when the LN reached over 1.0 leaf because a previous study showed high linearity in LN and EAT after the LN was over 1.0 leaf (
Usuki et al., 2019). The Tb in Eq. 1 was estimated using the coefficient of regression determination (
R2) between LN and EAT on the date of LN measurement and two types of root mean square error (RMSE) in a leave-one-out cross validation method: RMSE for LN (RMSE (leaves)) and RMSE for the day when the LN reached 10.0 leaves (optimal timing for GA
3 application) (RMSE (days)). The RMSE (leaves) was calculated according to Eq. 2;
|
RMSE(leaves)
=∑(observed LN (leaves)-predicted LN (leaves))2n
| (2) |
where the observed LN is the observed value of LN, the predicted LN is the predicted value obtained by the equation in the leave-one-out cross validation method for each year, and n is the number of measurements for each year. The RMSE (days) was calculated according to Eq. 3;
|
RMSE(days)
=∑observation date (day)-predicted date (day)2n
| (3) |
where observation date is the day when LN reached 10.0 leaves, the predicted date is predicted using the equation in leave-one-out cross validation method for each year, and n is the number of survey years (30 years). In addition, observation dates were estimated using the average LER over 30 survey years (0.36 leaves·day
−1) (see
Table 1), when the measurement was stopped before the LN reached 10.0 leaves, or when the LN was much higher than 10.0 leaves.
We used Tb values ranging from −2.5 to 12.5°C, with step increases of 2.5°C to calculate EAT. The Tb that yields the highest R2 and the lowest RMSE is assumed to be the best. We calculated the R2 and RMSE using data from 1987 to 2019 (30 years in total in vineyard O-REAF). The rate of LN increase per EAT (leaves/°C·day) was defined as the value of the regression slope between the LN and EAT.
Moreover, the goodness of fit of leaf emergence estimation from EAT (Tb of 7.5°C) was evaluated using R2 and RMSE (leaves) between observed LN and predicted LN in vineyard A. The predicted LN was estimated using Eq. 4 developed from the data of vineyard O-REAF;
|
LN=0.040×EATTbof7.5℃+InitialLN
| (4) |
where 0.040 is the 30-year average value of the regression slope between the LN and EAT (Tb of 7.5°C) in vineyard O-REAF, and Initial LN is LN of the first date of the measurement (in this case, it was 2.0 leaves).
Comparison of estimation from air temperature and the conventional method to predict the optimal timing for GA3 application
We validated whether estimation of leaf emergence from EAT (Tb of 7.5°C) (proposed method) improves the accuracy of predicting the optimal timing for GA3 application compared to the conventional method (using the constant LER; 0.36 leaves·day−1 (see Table 1)). We calculated the RMSE (leaves) and RMSE (days) from 1987 to 2019 data using the proposed and conventional methods. We applied leave-one-out cross validation to calculate RMSE (leaves) and RMSE (days) in the proposed method, and the observed air temperature was used to calculate EAT (Tb of 7.5°C). The prediction starting date was the first measurement date each year (LN ≥ 1.0 leaves).
Results
LN curves of 1987 to 2019
The average values of observed daily mean temperatures in 1987 to 2019 from April to May increased steadily from 11.0°C on April 1 to 20.6°C on May 31. The observed LN curves for the 30 years from 1987 to 2019 are shown in Figure 1. During the experimental years, the earliest day of the year when the LN reached 10.0 (optimal timing for GA3 application) was May 2, and the latest day of the year was May 17.
Relationship between LN and EAT
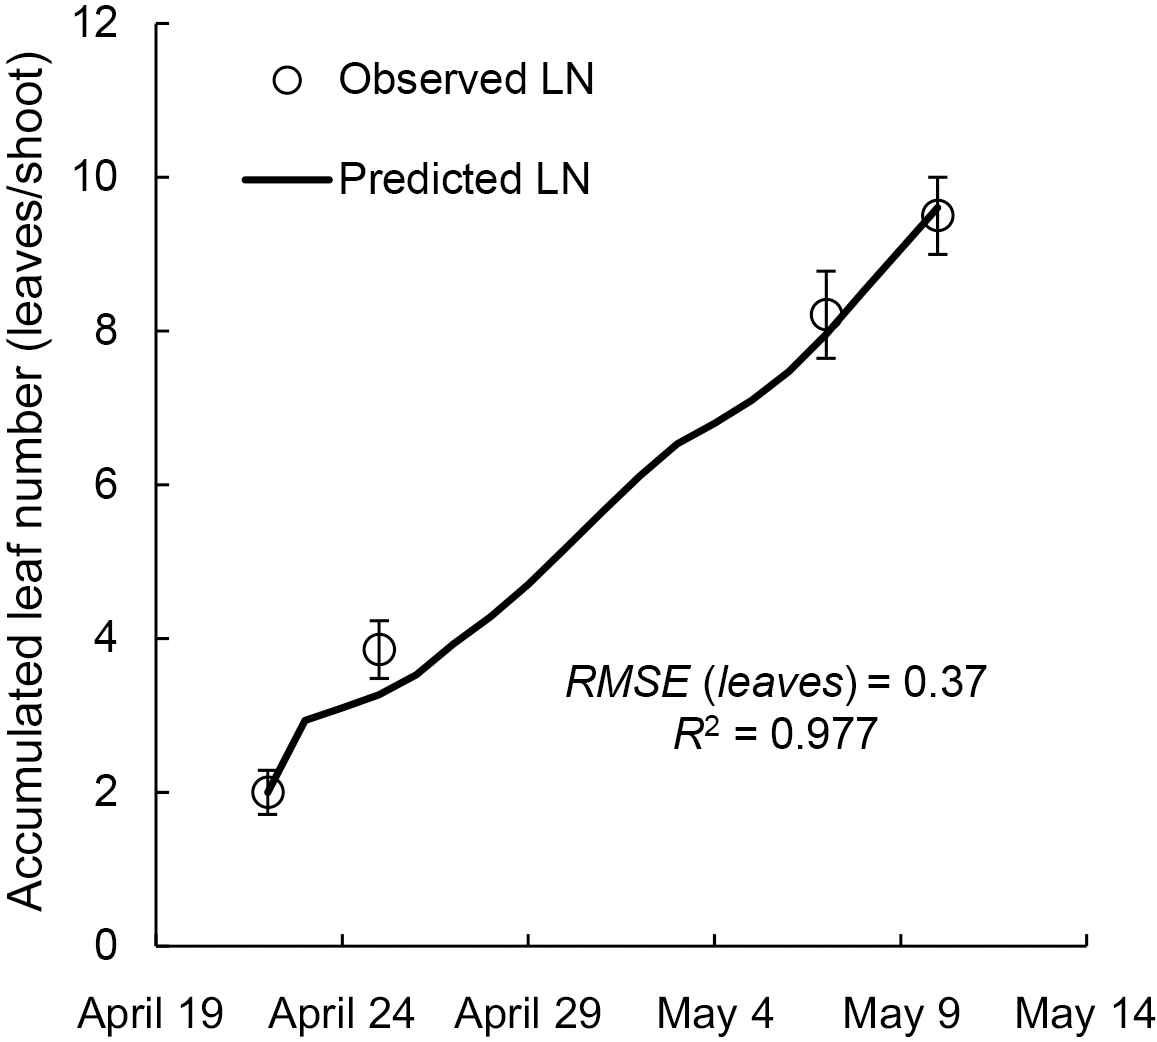
The LN was highly correlated with EAT in each year from 1987 to 2019, and the correlation coefficients were similar even if the Tb changed with step increases of 2.5°C from −2.5 to 12.5°C (Table 1). The mean values of R2 at Tb of −2.5°C, 0°C, 2.5°C, 5.0°C, 7.5°C, 10.0°C, and 12.5°C were 0.993, 0.993, 0.994, 0.995, 0.996, 0.995, and 0.988, respectively. The RMSE values (leaves) for each Tb from 1987 to 2019 are shown in Table 2. The mean values of RMSE (leaves) at Tb of −2.5°C, 0°C, 2.5°C, 5.0°C, 7.5°C, 10.0°C, and 12.5°C were 0.48, 0.45, 0.42, 0.37, 0.35, 0.45, and 0.76 leaves, respectively. The RMSE (days) for each Tb from 1987 to 2019 are shown in Table 3. The RMSE values (days) at Tb of −2.5°C, 0°C, 2.5°C, 5.0°C, 7.5°C, 10.0°C, and 12.5°C were 1.72, 1.66, 1.54, 1.53, 1.47, 1.80, and 2.35 days, respectively. From these results, the Tb of 7.5°C yielded the highest R2 and the lowest RMSE; thus, we adopted a Tb of 7.5°C and a slope of 0.040 (which is the 30-year average value in vineyard O-REAF) for the equation. The prediction of leaf emergence curve in vineyard A using EAT (Tb of 7.5°C) is shown in Figure 2. The predicted leaf emergence curve using EAT (Tb of 7.5°C) and Eq. 4 was in good agreement with the observed LN; the R2 was 0.977 and the RMSE (leaves) was 0.37 leaves.

Meanwhile, in 2019, when we continued the measurements until the LN reached approximately 20.0 in vineyard O-REAF, the relationship between LN and EAT (Tb of 7.5°C) fit two regressions (Fig. 3). With an LN of approximately 10.0, there was a change in slope from 0.043 to 0.029 leaves/°C·day.
Comparison of the conventional and proposed method to predict the optimal timing for GA3 application
The RMSE values (leaves) for the conventional and proposed methods are shown in Figure 4. The mean RMSE value (leaves) for the 30 years using the proposed method (0.35 leaves) was lower than the mean value of RMSE (leaves) using the conventional method (0.69 leaves). The relationship between the observed date and predicted date by the conventional and proposed methods is shown in Figure 5. The RMSE (days) in the proposed method (1.47 days) was lower than that in the conventional method (2.79 days). The difference between the observed and predicted date for the 30 years in the proposed method (≤ 3 days) was lower than that in the conventional method (≤ 5 days).
Discussion
The day that the LN (accumulated leaf number per second shoot) reached 10.0 varied from year to year; when comparing the earliest and the latest years, there was a difference of approximately two weeks (Fig. 1). This may be because the progress of leaf emergence was affected by the timing of bud break and the temperature characteristics after bud break of each particular year. We analyzed the relationship between leaf emergence and air temperature, and found a good fit in the linear regression between LN and EAT (effective accumulative temperature) (Table 1). This indicates that air temperature is the main variable driving leaf emergence in ‘Delaware’, and that the estimation of leaf emergence using the regression approach is appropriate. A linear relationship between air temperature and leaf emergence is generally observed in many annual crops (Boone et al., 1990; Dwyer and Stewart, 1986; Lancaster et al., 1996; Muchow and Carberry, 1989; Usuki et al., 2019). Our findings are consistent with these results.
Next, to allow the LN estimation of ‘Delaware’ using air temperature, we selected the optimal Tb, ranging from −2.5 to 12.5°C, because there is a threshold for plant development. Although the R2 values of LN versus EAT were very high at any Tb (R2 ≥ 0.988), the mean RMSE (leaves) and RMSE (days) of Tb at 7.5°C were the lowest (Tables 2 and 3). From these results, we determined that the Tb for leaf emergence in ‘Delaware’ was 7.5°C. A similar value of Tb (5.0–8.0°C) was reported in wine grape cultivars using cutting tests (Moncur et al., 1989).
Furthermore, as the Tb of ‘Delaware’ is 7.5°C, the slope of the regression equation was calculated to determine the rate of LN increase per EAT (leaves/°C·day) of ‘Delaware’ in the O-REAF vineyard. The mean, minimum, and maximum values and standard deviation of the slope of the regression equation for 30 years were 0.040, 0.034, 0.046, and 0.003 leaves per °C·day, respectively, indicating that the parameters were very stable (Table 1). The developed equation (LN = 0.040 × EAT (Tb of 7.5°C) + Initial LN) adopting a slope of 0.040, the 30-year average value of O-REAF, additionally provided a good estimation of data in vineyard A (Fig. 2), which was not used to determining parameters. Therefore, it seems that the equation well represents the ‘Delaware’ leaf emergence response to air temperature and could be used to estimate leaf emergence in vineyards with different growing conditions. The equation additionally suggests that the ’Delaware’ grape develops 4.0 leaves (0.040 leaves/°C·day × 100°C·day) per EAT of 100°C·day with a Tb of 7.5°C.
Incidentally, in this study, we aimed to estimate the day when the LN reached 10.0 leaves from LN on the measurement date (1.0 leaves ≤ LN < 10.0 leaves), so we mainly focused our research on the period when the LN of ‘Delaware’ increased from 1.0 to 10.0 leaves. However, the sensitivity of the grapes to temperature may change during development; therefore, in 2019 we explored the relationship between LN and EAT (Tb of 7.5°C) until the LN reached approximately 20.0 leaves. As a result, the slope of the regression equation decreased at an LN of approximately 10.0 leaves (Fig. 3). This coincides with a decline in the rate of LN increase with increasing accumulative temperature observed in wine grape cultivars (Schultz, 1992), peach, nectarine (Kervella et al., 1995), and strawberry (Rosa et al., 2011). This change may have been attributable to developmental changes such as flowering, which causes competition for photosynthates between leaves and flower clusters (Moncur et al., 1989; Rosa et al., 2011). In ‘Delaware’, pollen grains are formed when the LN is approximately 10.0 (Kodera et al., 1971); therefore, leaves and flower clusters could experience increased competition at this time. In future estimations of the LN of ‘Delaware’ after the LN has reached 10.0, changes in sensitivity to temperature due to changes in developmental stages such as those above should be considered. However, for our study which was to predict the best timing for the application of GA3 to ‘Delaware’ using an LN of up to 10.0 that increases linearly with EAT, it was favorable because one simple equation can be used to predict.
From the results obtained, a highly accurate rate of LN increase can be estimated from the air temperature. Thus, we compared applying the proposed method (EAT (Tb of 7.5°C)) to the conventional method (constant LER, 0.36 leaves·day−1) to predict of leaf emergence in ‘Delaware’. The RMSE values (days) of the proposed and conventional methods were lower than the standard deviation of the observation date (4.64 days) (Table 3); therefore, both methods produce practical predictions. However, the RMSE values (leaves) in the proposed method were lower than when using the conventional method (Fig. 4), and the proposed method was a better match to the observation date than the conventional method (Fig. 5). In the future, by estimating leaf emergence using forecast values for temperature provided by AMGSD, it will be possible to more accurately predict the optimal timing for GA3 application than using the conventional method.
In conclusion, the Tb with the highest estimation accuracy of leaf emergence in ‘Delaware’ grape is 7.5°C. The coefficient of the estimated formula suggests that ‘Delaware’ grapes develop 4.0 leaves per EAT of 100°C·day with a Tb of 7.5°C. Furthermore, when applying the estimation of rate of LN increase from EAT (Tb of 7.5°C) to predict the optimal timing for GA3 application, the prediction error was lower than that of the conventional method using the constant LER. This method could be useful for ‘Delaware’ growers to plan cultivation management. Since increases in air temperature are expected to continue (IPCC, 2013), further research efforts are needed to explore the upper-temperature limit that shows suppression effects to enable good estimates for leaf emergence in ‘Delaware’ grapes.
Literature Cited
- Boone, M., F. Whisler and R. Rickman. 1990. Leaf appearance rates of two winter wheat cultivars under high carbon dioxide conditions. Agron. J. 82: 718–724.
- Buttrose, M. S. 1969. Vegetative growth of grapevine varieties under controlled temperature and light intensity. Vitis 8: 280–285.
- Chuine, I., K. Kramer and H. Hänninen. 2003. Plant development models. p. 217–235. In: M. D. Schwartz (eds.). Phenology: An integrative environmental science. Kluwer Academic Publishers, Dordrecht.
- Cultivated Soil Classification Committee. 1995. Classification of cultivated soils in Japan, 3rd approximation (In Japanese). Misc. Publ. Natl. Inst. Agro-Environ. Sci., Tsukuba.
- Dwyer, L. M. and D. W. Stewart. 1986. Leaf area development in field-grown maize. Agron. J. 78: 334–343.
- Gao, L., Z. Jin, Y. Huang and L. Zhang. 1992. Rice clock model: a computer model to simulate rice development. Agric. For. Meteorol. 60: 1–16.
- Haun, J. R. 1973. Visual quantification of wheat development. Agron. J. 65: 116–117.
- Inman-Bamber, N. G. 1994. Temperature and seasonal effects on canopy development and light interception of sugarcane. Field Crops Res. 36: 41–51.
- Intergovernmental Panel on Climate Change (IPCC). 2013. Summary for policymakers. p. 1–30. In: T. F. Stocker, D. Qin, G. K. Plattner, M. Tignor, S. K. Allen, J. Boschung, A. Nauels, Y. Xia, V. Bex and P. M. Midgley (eds.). Climate change 2013: The physical science basis. Contribution of working group I to the fifth assessment report of the intergovernmental panel on climate change. Cambridge University Press, Cambridge, United Kingdom and New York, NY.
- Kamimori, M., Y. Miwa, T. Isobe and A. Hosomi. 2020. An experimental study of a simple sampling method for determining the optimal timing for gibberellin application to field-grown ‘Delaware’ grape from the number of leaves. New Kinki Chugoku Shikoku Agricultural Research 3: 36–45 (In Japanese with English abstract).
- Kervella, J., L. Pagès and M. Génard. 1995. Genotypic differences in the leaf emergence rate of young peach trees. J. Am. Soc. Hortic. Sci. 120: 278–282.
- Kodera, M., Y. Okuda and M. Dan. 1971. Studies on the forcing culture by heating in Delaware grapes [2] on the index for deciding the first gibberellin treating period. Bull. Osaka Agr. Res. Cent. 8: 103–105 (In Japanese).
- Kofu city Gibberellin-treatment Committee. 1978. Delaware-no-gibberellin-shori (In Japanese). Kofu city Gibberellin-treatment Committee, Yamanashi.
- Lancaster, J. E., C. M. Triggs, J. M. De Ruiter and P. W. Gandar. 1996. Bulbing in onions: Photoperiod and temperature requirements and prediction of bulb size and maturity. Ann. Bot. 78: 423–430.
- Moncur, M. W., K. Rattigan, D. H. Mackenzie and G. N. Mcintyre. 1989. Base temperatures for budbreak and leaf appearance of grapevines. Am. J. Enol. Vitic. 40: 21–26.
- Muchow, R. C. and P. S. Carberry. 1989. Environmental control of phenology and leaf growth in a tropically adapted maize. Field Crops Res. 23: 221–237.
- Ohno, H., K. Sasaki, G. Ohara and K. Nakazono. 2016. Development of grid square air temperature and precipitation data compiled from observed, forecasted, and climatic normal data. Climate in Biosphere 16: 71–79 (In Japanese).
- Ritchie, J. T and D. S. Nesmith. 1991. Temperature and crop development. p. 5–29. In: R. J. Hanks and J. T. Ritchie (eds.). Modeling plant and soil systems. American Society of Agronomy, Crop Science Society of America, Soil Science Society of America, Madison.
- Rosa, H. T., L. C. Walter, N. A. Streck, J. L. Andriolo, M. Rocha da Silva and J. A. Langner. 2011. Base temperature for leaf appearance and phyllochron of selected strawberry cultivars in a subtropical environment. Bragantia 70: 939–945.
- Schultz, H. R. 1992. An empirical model for the simulation of leaf appearance and leaf area development of primary shoots of several grapevine (Vitis vinifera L.) canopy-systems. Sci. Hortic. 52: 179–200.
- Usuki, K., T. Muro, T. Suesada, Y. Higashino, H. Kawashiro, N. Morita and Y. Morinaga. 2019. Consideration of methods to estimate the leaf number of direct seeding onions (Allium cepa L.) using air temperature. Hort. Res. (Japan) 18: 17–23 (In Japanese with English abstract).