Original Articles
Psychosocial Work Factors, Blood Pressure and Psychological Strain in Male Bus Operators
2014 Volume 52 Issue 4 Pages 279-288

Details
2014 Volume 52 Issue 4 Pages 279-288
The research aim was to predict the bus operators’ blood pressure (BP) and psychological strain using a combination of the Job-Demand Control (JDC) and Effort-Reward Imbalance (ERI) models. The study was conducted with a sample of 139 bus operators in the city of Bogotá (Colombia), who answered a questionnaire that included the Job Content Questionnaire (JCQ), the ERI Questionnaire, and the General Health Questionnaire (GHQ). Four consecutive BP readings taken in the workplace were averaged to calculate an estimation of the bus operators’ BP. By conducting multiple linear regressions it was found that, taken together, JDC and ERI models explain 10% (F(11,139)=2,502; p=0.00) of systolic BP variance, and 34% (F(6,139)=8,638; p=0.00) of psychological strain variance. These results suggest that the JDC and ERI predictors provide complementary information which increases the probability of accurately model the bus operators’ health.
Empirical evidence accumulated over the last 50 yr indicates that compared to other occupational groups, bus operators are more at risk of suffering from cardiovascular, muscular-skeletal, gastrointestinal and psychological problems (anxiety, depression and post-traumatic stress disorder)1, 2). Furthermore, it has been found that these health results are associated with specific working conditions, especially psychosocial work stressors3, 4).
It is known that some specific demands of the professional drivers’ job such as the contradiction between time pressure and the need of compliance with traffic regulations, as well as the frequent recurrence of situations that hinder efficient driving (e.g. volume of traffic, high passenger levels and bad weather), are associated with high levels of psychological and physical strain that, in turn, make it more difficult to drive safely1, 3,4,5,6,7).
The mechanisms explaining the association between work stress and disease are not fully understood. However, at the psycho-physiological level it is known that chronic stress is associated with disturbances in the circadian rhythm of cortisol, which in turn increase blood pressure8, 9) reduces heart rate variability9, 10), and contribute to the development of metabolic syndrome11,12,13) and emotional problems such as anxiety14) and depression15). It is also known that work stress may affect health indirectly through unhealthy behaviors. For instance, work-related stress leads bus operators to frequently engage in risk behaviors such as alcohol and drug consumptions16,17,18), and has negative consequences at the organizational level, such as absenteeism19), accidents caused by human error19), and high employee turnover20).
This study examines the association between the bus operators work stressors and two health results: a) blood pressure (BP) and b) psychological strain. Specifically, work-related stress is operationalized combining the Job-Demand-Control (JDC)21) and Effort Reward Imbalance (ERI) models22). While the association of these two models with the health of commercial drivers has been explored separately2, 3, 6, 23,24,25), their combined effect on psychological well-being has not yet been examined in this occupational group, and to date very few studies have used a combined work stress model to predict BP in any occupational groups26).
Moreover, the few studies that have examined the association between specific work stressors and BP in bus operators have reported inconsistent results6, 23), and have been further limited by an exclusive reliance on clinical readings of BP, which are not consistently associated with work stress27). This study corrects prior limitations in research by focusing not only on the joint influence of the JDC and ERI models, but also employs multiple casual BP measurements taken in the workplace, in order to achieve better estimates of the bus operators ambulatory BP.
The job demand-control modelThe JDC model focuses on two factors of the work environment: job demands, which are understood as the physical and mental load of the work; and job control or decision latitude, which is defined as the combination between the workers’ skill discretion and decision authority21). The JDC model predicts that, either jointly or by themselves, psychological demands and decision latitude are associated with psychological and physical strain. In particular, the main JDC hypothesis states that “high strain jobs”, characterized by high psychological demands and low decision latitude, are associated with adverse health results. Additionally, the most important extension of the JDC model suggests that social support27, 28) is central for the explanation of the employees’ health. The literature indicates that jobs with low levels of social support, high demands and low control are associated with the greatest risk for physical and mental disease29, 30).
Numerous studies have classified bus operators as an occupational group exposed to high job demands, such as time pressures and prolonged working days, and low decision latitude, specially related to the lack of autonomy in deciding how to use the time assigned them to accomplish with their duties17, 31, 32). Moreover, Evans and Johansson33) report that bus operators perceive low levels of social support due to their lack of time available to establish interpersonal relationships inside and outside the workplace.
A considerable amount of evidence supports the association between the JDC model and both BP34,35,36,37,38,39,40,41,42,43,44,45,46,47) and psychological distress36, 48,49,50,51,52,53,54,55, 73) in numerous occupations. Nevertheless, only two studies have specifically examined the association between the JDC model and BP among bus operators6, 23), and the results of these two studies are not consistent with the JDC model hypotheses. Both Winkleby, Ragland and Syme23) and Albright et al.6) found an inverse association between work strain and BP. By contrast with these studies, the current research seeks to produce a broader characterization of the workplace conditions of bus operators by combining the JDC and ERI models, and it is also hoped to obtain a more reliable estimate of BP by carrying out multiple measurements in the workplace, instead clinic measurements which are vulnerable to observer bias and the “white coat effect”26).
The effort/reward imbalance modelThe ERI model states that the absence of reciprocal exchange in the workplace is associated with high levels of work strain. According to Siegrist22), the work role is associated with repeated options for personal development, but only if the efforts of the employee are duly rewarded in terms of promotion (including salary), esteem or recognition, and job security. Specifically, the ERI model suggests that the lack of reciprocity between levels of effort (high) and rewards (low) predisposes neuroendocrine reactions (e.g. the secretion of catecholamines and cortisol), that lead to disease56). Moreover, at an individual level the ERI model states that employees with motivational patterns that imply work over-commitment are in greater risk of adverse health results, especially in conditions of high efforts and low rewards22).
In regard with bus operators, it has been found that high efforts and low rewards are associated with self-reported psychosomatic symptoms24). Similarly, Tse, Flynn and Mears2) found that low levels of reward and high levels of over-commitment are the principal factors associated with psychological strain among bus operators. Nevertheless, no epidemiological study has examined the association of the ERI model with the bus drivers BP, and in general the available evidence is not sufficient to characterize the effort-reward imbalance profile of this occupational group.
Combining the JDC and ERI modelsRelatively few studies have examined the JDC and ERI models as complementary analytical tools and amongst those that have, only a few have focused on the employees’ health26, 56,57,58,59,60,61,62). The existing literature indicates that a combined stress model (involving the JDC and ERI models) improves the estimates of the risk of cardiovascular disease26, 59, 60), insomnia58), absenteeism61), psychological strain and reduced satisfaction with life57, 62). Conceptually, the strength of a combined model of work stress lies in the fact that while there are important theoretical similarities between the two models, there are two clear differences between them. Firstly, the JDC model focuses on the relation between the quantitative demands and decision latitude, while the ERI model is focused on the contractual characteristics of the work. Secondly, the JDC model is focused explicitly on the environmental characteristics of work, while the ERI model includes both environmental (extrinsic) and individual (intrinsic) components. Thus, combining the two models might offer the advantage of providing broader insights into the multiple workplace factors that potentially affect occupational health.
All participants were randomly selected. A total of 400 questionnaires were delivered to the bus operators from three bus depots of a transport company in Bogotá, Colombia. The bus depots sizes vary from 230 to 350 bus operators. 142 urban bus operators returned their questionnaires fully completed (response rate=35.5%). Three female drivers were removed from the sample in order to eliminate any effect of gender in the data analysis. The average age of the final data set (n=139 male bus operators) was 40.1 yr. 75% of the sample reported having completed secondary studies, 20% technical further education and 5% having attended university. At the point when the information was gathered, the bus operators had been working in the company for more than six months. Therefore, it is assumed that that the levels of work stress found responded specifically to repeated exposure to the psychological risks associated with professional driving.
Instruments and measurements Work stress modelsJDC Model. A Spanish version of the Job Content Questionnaire (JCQ) previously validated for Colombia63) was used. The JCQ used in this study was made of 22 items grouped into five factors: skill discretion (6 items, α=0.70), decision authority (3 items, α=0.49), psychological demands (5 items, α=0.64), support from management (4 items, α=0.81), and support from colleagues (4 items, α=0.75). All the questions were answered using a Likert Scale from 1 to 4 where one meant “totally disagree” and 4 meant “totally agree”. Decision latitude (α=0.67) was calculated as the sum of skill discretion and decision authority subscales, and social support (α=0.86) as the sum of support from management and support from colleague’s subscales.
ERI Model. A Spanish version of the “Effort-Reward Imbalance (ERI) Questionnaire”, validated for Colombia was used64). The scale was made of 23 items grouped in three factors: extrinsic effort (11 items, α=0.74), rewards (6 items α=0.85) and over-commitment (6 items, α=0.71). The 11 items included in the intrinsic effort scale, as well as the 6 in the reward scale, were answered in a 5 point Likert scale, where 1 meant “Disagree”, 2 “Agree, and I am not at all distressed”, 3 “Agree, and I am somewhat distressed”, 4 “Agree, and I am distressed”, and 5 “Agree, and I am very distressed”. The over-commitment scale contained 6 Likert items from 1 to 4, where 1 meant that the situation “strongly disagree” and 4 that “strongly agree”.
Health resultsPsychological strain. Psychological strain was measured using Golberg’s General Health Questionnaire (GHQ-28) in the Spanish version validated by Lobo, Pérez-Echeverría and Artal65). The 28 items of the questionnaire are grouped in four factors: somatic symptoms (α=0.85), anxiety (α=0.83), social dysfunction (α=0.72) and depression (α=0.77). For each of the 28 questions interviewees were asked to indicate any symptoms they had experienced in recent weeks using a 4 level Likert scale where 1 signified the absence of symptoms (“none at all”) and 4 “a lot more than usual”. A general score of psychological strain was calculated by averaging the 28 items of the GHQ.
Blood Pressure. HEM 670IT OMRON® digital wrist blood pressure monitors were used to measure BP. This instrument has been validated and used successfully for research purposes66,67,68), and reliability was increased by taking multiple readings (4 measurements in each bus operator) and using the mean for each individual’s BP as the estimate of their BP at work.
Sociodemographic Variables. Information on age, weight, height, seniority (number of years in the work), neighborhood income level (in Colombia, neighborhoods are classified in 6 economical strata according with their income level and geographic location. Neighborhoods in the level 6 are the higher in socioeconomic status), physical activity (sedentary/non-sedentary), alcohol consumption (daily/occasional) and tobacco use (yes/no) was self-reported by participants in an initial section of the questionnaire.
ProcedureAll participants agreed to collaborate with the study and signed an informed consent. The study was approved by the Ethical Committee of Los Andes University (Bogotá, Colombia) Psychology Department. The questionnaire was completed outside work hours and subsequently handed in to the research team. When the questionnaires were delivered, four consecutive BP readings in the left wrist were taken from each driver at one minute intervals. The readings were taken at the end of the night shift (between 9:30 pm. and 12:30 pm), inside the vehicle with the engine turned off, once it had been parked in the company depots. The drivers remained seated in the driver’s cabin while the BP readings were taken. During the BP readings, the bus operators were asked to hold their arm keeping the wrist monitor at the hearth level (the device have a position sensor that stop the readings when the position of the wrist is not correct). Invalid readings were automatically excluded by the wrist devices and were replaced by a new reading taken a minute after the invalid one. All readings were taken on working days during which no events had occurred that might have altered regular driver routines.
Statistical analysisHierarchical linear regressions were used to examine the combined effect of the JDC and ERI models on BP and psychological strain. The JDC model was operationalized using a “job strain score”, calculated through the ratio between psychological demands and decision latitude (demands/decision latitude). Likewise, an E/R imbalance score was calculated through the algorithm e/r*c, where “e” and “r” are the scores of the effort and reward scales respectively and “c” a correction factor (0.5454) for the different number of items in the numerator and denominator. Job strain, E/R imbalance, social support and over commitment were included in the second step of the regression models, after controlling for age, BMI, drinking (frequent/infrequent), smoking (yes/no), physical activity (sedentary/non-sedentary), neighborhood income level and seniority in the case of BP, and after controlling for BMI and neighborhood income level in the case of psychological strain. Given that JDC and ERI models were introduced simultaneously in the second step of the regressions, the tolerance and VIF statistics were observed in order to discard problems of multicollinearity. High levels of tolerance and low statistical VIF values were found in all the regressions. Additionally, an analysis of bivariate Pearson correlations revealed that the highest correlation between variables of the JDC and ERI models was 0.36 (between extrinsic rewards and social support, Table 1). Thus, no statistical arguments were found against including the two models simultaneously in the regressions.
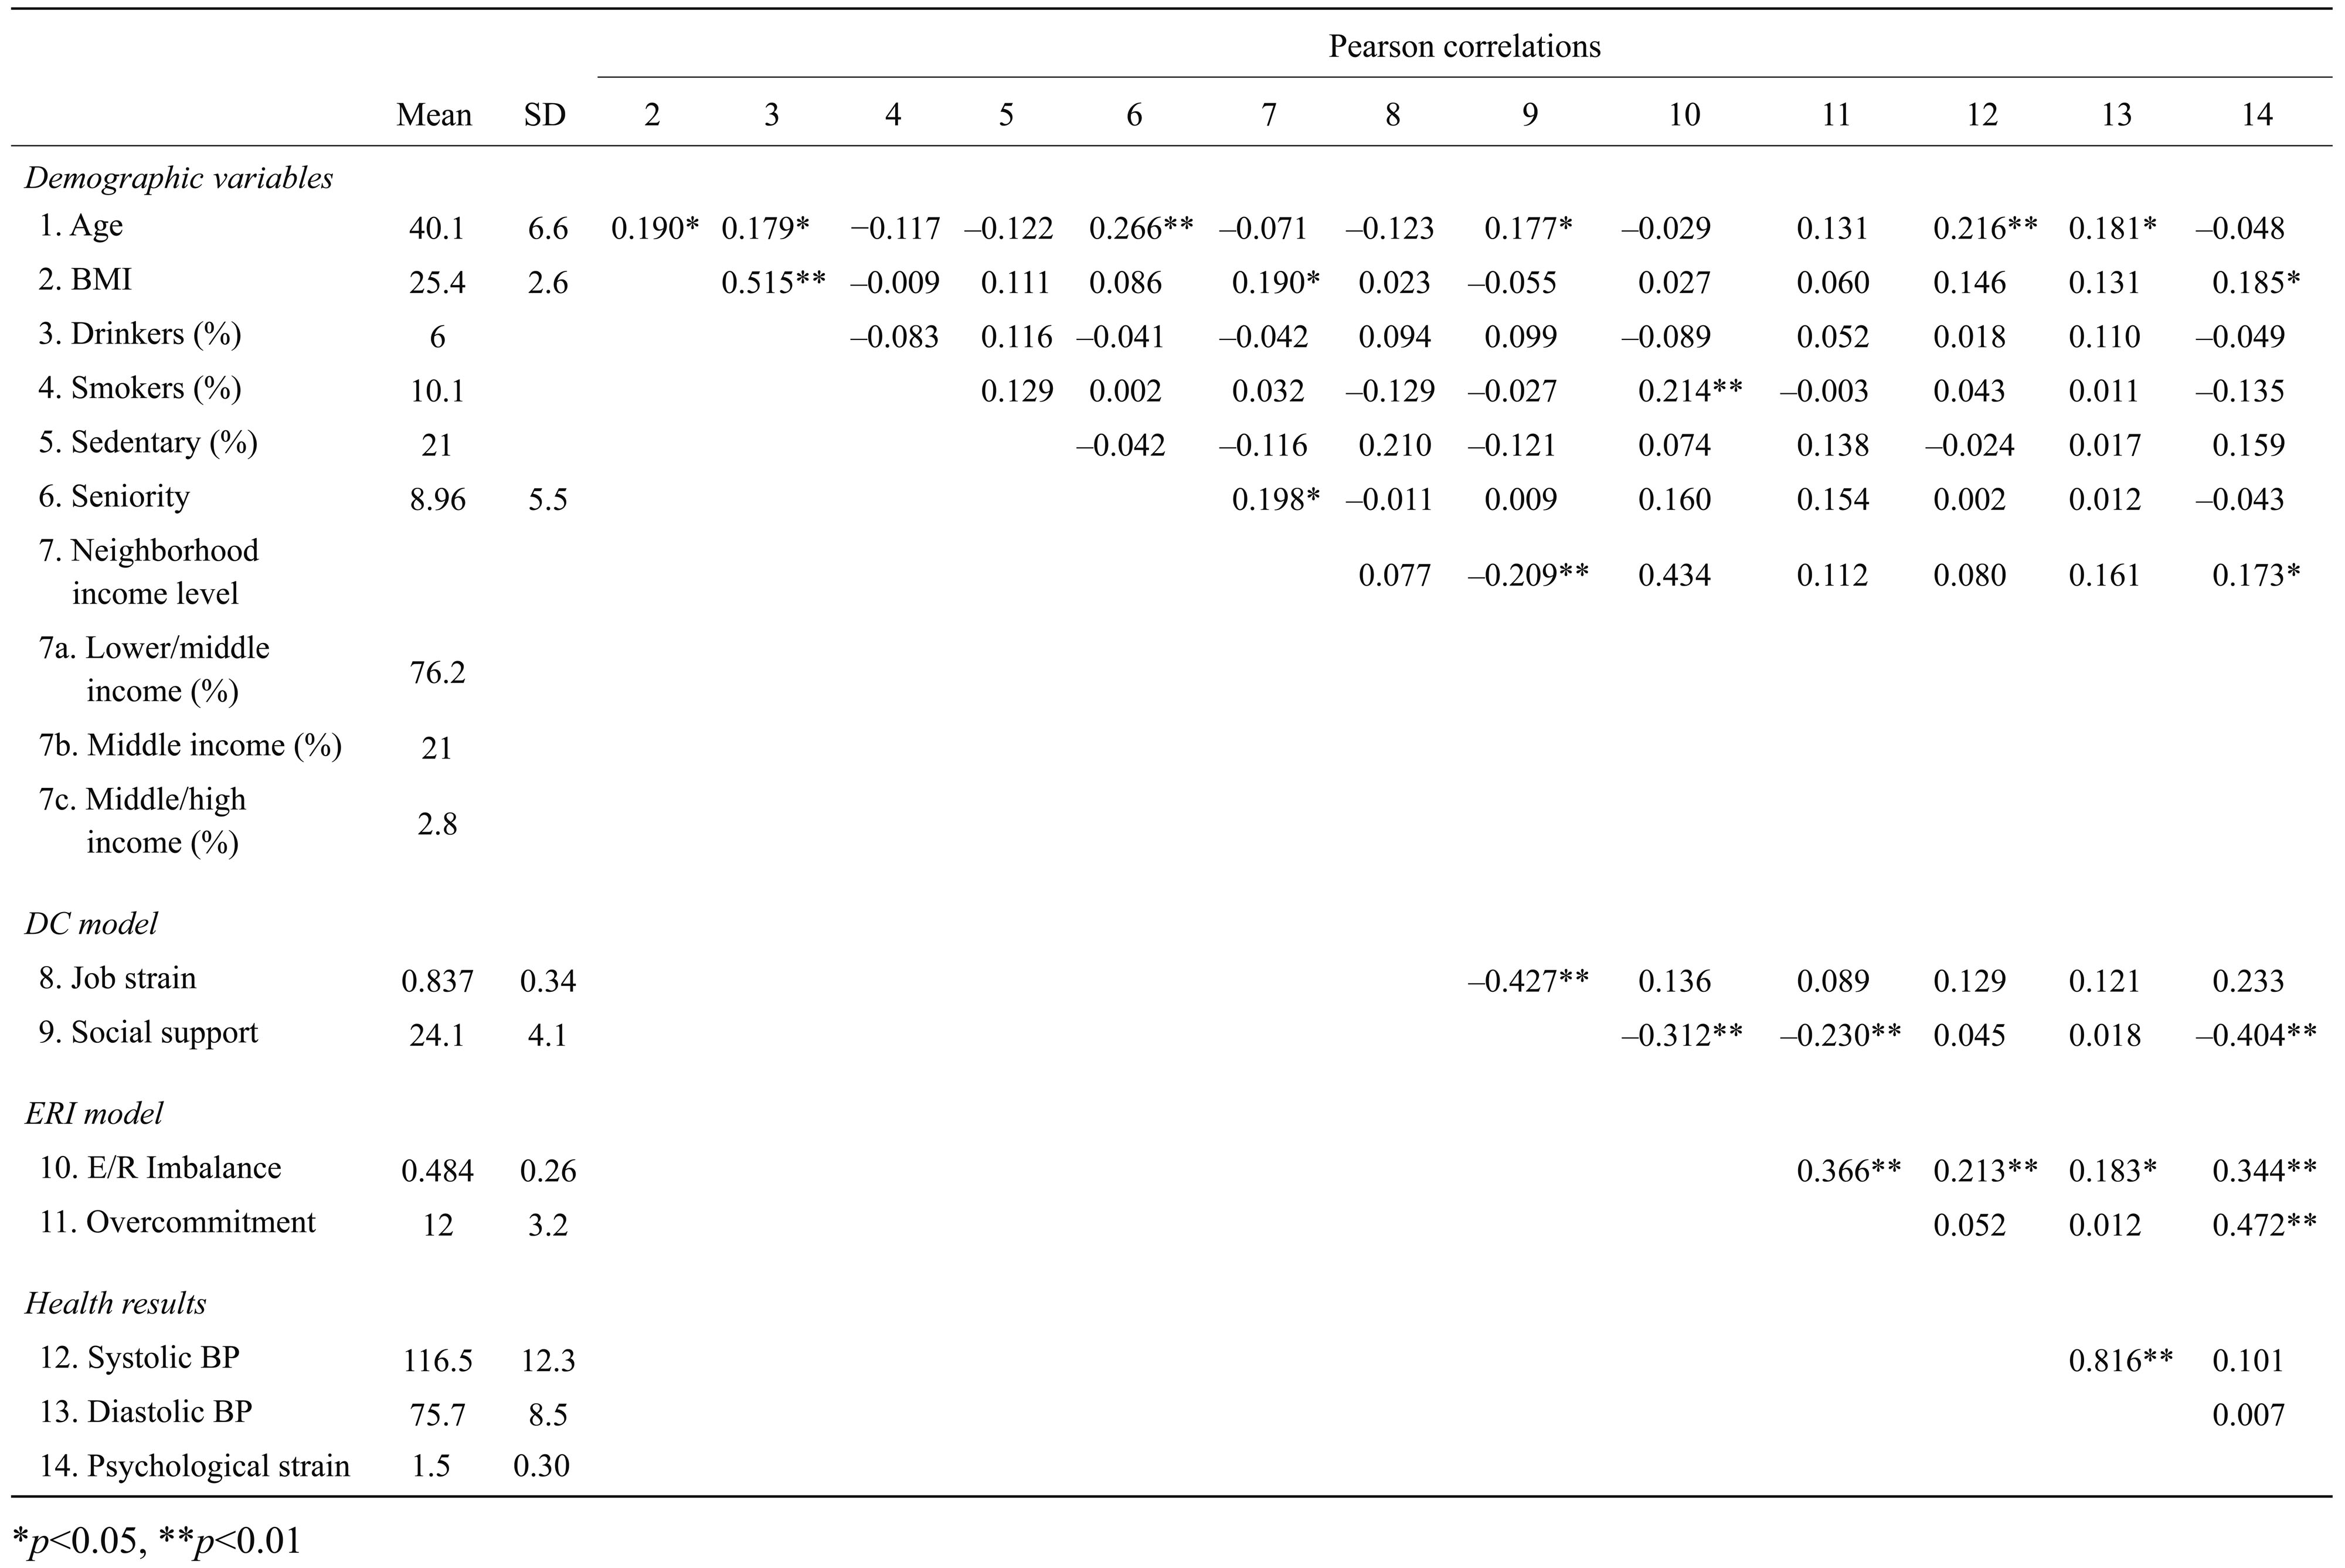
Table 1 presents the descriptive statistics of the variables included in the study and the Pearson correlations between them. It was found that the sample had averages of job strain and E/R imbalance below the risk score (values greater than 1.0 indicates unfavorable imbalance between demands and decision latitude and between effort and rewards). The bus operators also had high social support, and low over-commitment. 76.2% of the bus operators considered themselves to belong to lower/middle income neighborhoods, 21% to middle income neighborhoods, and 2.8% to middle/high income neighborhoods. In terms of health, the bus operators reported normal average BP readings when compared to the norm in Colombia (systolic BP <130 mmHg and diastolic BP<85 mmHg) and decidedly low levels of psychological strain (maximum score: 4.0). On the other hand, the average BMI scores were somewhat elevated, indicating a slight tendency towards excess weight. In general, the descriptive statistics suggested that the sample was healthy in terms of BP and psychological strain.
Table 2 summarizes the results of the regression analyses to predict the bus operators’ systolic (model A) and diastolic (model B) BP. It was found that after controlling for age, BMI, drinking, smoking, physical activity, neighborhood income level and seniority, the combined stress model (second steps of the regressions) significantly explained 10% (F(11,139)=2.502; p=0.00) of systolic BP variance (model A). However, the entering of the combined stress model did not significantly increase (∆R2=0.06; F(11,139)=1.857; p=0.124) the variance of diastolic BP explained by the known confounders. In regard with the stressors included in the regressions, in model A it was found that both job strain and E/R imbalance are associated significantly with systolic BP. On the other hand, in model B just job strain was significantly associated with diastolic BP. According to the predictions of the JDC and ERI models, the associations between job strain, E/R imbalance and BP were positive. Social support and over-commitment were not significantly associated with systolic and diastolic BP. In both model A and model B job strain was the most important factor explaining BP.
| B | Error | 95%CI | Beta | Tolerance | VIF | ∆R2 | ||
|---|---|---|---|---|---|---|---|---|
| Model A: Systolic BP | ||||||||
| Step 1 | ||||||||
| Constant | 72.951 | 14.001 | 45.182 | 100.719 | ||||
| Age | 0.466 | 0.195 | 0.079 | 0.853 | 0.239* | 0.852 | 1.174 | |
| BMI | 12,825.1 | 5,517.27 | 1,882.9 | 23,767.3 | 0.267* | 0.649 | 1.541 | |
| Drinking | –4.844 | 4.002 | –12.780 | 3.093 | –0.135 | 0.691 | 1.448 | 0.12* |
| Smoking | –1.080 | 3.949 | –8.912 | 6.752 | –0.026 | 0.980 | 1.020 | |
| Sedentarism | –0.332 | 2.903 | –6.089 | 5.425 | –0.011 | 0.928 | 1.078 | |
| Neighborhood income level | 0.424 | 1.637 | –2.822 | 3.671 | 0.026 | 0.870 | 1.149 | |
| Seniority | –0.204 | 0.160 | –0.522 | 0.114 | –0.128 | 0.850 | 1.177 | |
| Step 2 | ||||||||
| Constant | 40.078 | 18.358 | 3.651 | 76.504 | ||||
| Job strain | 11.941 | 5.077 | 1.867 | 22.014 | 0.255* | 0.774 | 1.483 | |
| E/R imbalance | 9.523 | 4.616 | 0.364 | 18.683 | 0.239* | 0.687 | 1.605 | 0.10* |
| Social support | 0.600 | 0.356 | –0.093 | 1.507 | 0.143 | 0.772 | 1.489 | |
| Overcomitment | 0.185 | 0.417 | –0.643 | 1.012 | 0.046 | 0.730 | 1.370 | |
| R=0.566, R2=0.22 | ||||||||
| Model B: Diastolic BP | ||||||||
| Step 1 | ||||||||
| Constant | 45.029 | 9.137 | 26.909 | 63.150 | ||||
| Age | 0.231 | 0.127 | –0.022 | 0.484 | 0.180 | - | - | |
| BMI | 8,512.796 | 3,600.36 | 1,372.33 | 15,653.26 | 0.270** | - | - | |
| Drinking | 0.134 | 2.611 | –5.045 | 5.313 | 0.006 | - | - | 0.130* |
| Smoking | –0.627 | 2.577 | –5.738 | 4.484 | –0.023 | - | - | |
| Sedentarism | –0.049 | 1.894 | –3.806 | 3.708 | –0.002 | - | - | |
| Neighborhood income level | 0.650 | 1.068 | –1.468 | 2.769 | 0.060 | - | - | |
| Seniority | –0.100 | 0.105 | –0.307 | 0.107 | –0.095 | - | - | |
| Step 2 | ||||||||
| Constant | 26.962 | 12.259 | 2.638 | 51.285 | ||||
| Job strain | 6.836 | 3.390 | 0.109 | 13.562 | 0.222* | - | - | |
| E/R imbalance | 4.177 | 3.082 | –1.939 | 10.293 | 0.160 | - | - | 0.061 |
| Social support | 0.423 | 0.238 | –0.050 | 0.895 | 0.196 | - | - | |
| Overcomitment | 0.110 | 0.279 | –0.443 | 0.663 | 0.042 | - | - | |
| R=0.437, R2=0.191 | ||||||||
*p<0.05, **p<0.01
Table 3 summarizes the results of the regression analysis in order to predict the bus operators’ psychological strain. It was found that after controlling for the effects of BMI and neighborhood income level, the combined stress model significantly explained 34% (F(6,139)=8.638; p=0.00) of the variance of psychological strain. Job strain, E/R imbalance and over-commitment were significantly positively associated with psychological strain. Over-commitment was the most important factor in the regression model, followed by the E/R imbalance and job strain.
| B | Error | 95%CI | Beta | Tolerance | VIF | ∆R2 | ||
|---|---|---|---|---|---|---|---|---|
| Step 1 | ||||||||
| (Constante) | 1.256 | 0.260 | 0.740 | 1.771 | ||||
| BMI | 63.708 | 103.757 | –141.777 | 269.19 | 0.057 | 0.964 | 1.037 | 0.027 |
| Neighborhood income level | 0.056 | 0.036 | –0.015 | 0.128 | 0.145 | 0.964 | 1.037 | |
| Step 2 | ||||||||
| (Constante) | 0.947 | 0.312 | 0.329 | 1.566 | ||||
| Job strain | 0.157 | 0.088 | 0.027 | 0.321 | 0.149* | 0.808 | 1.238 | |
| E/R imbalance | 0.246 | 0.082 | 0.084 | 0.408 | 0.290** | 0.702 | 1.562 | 0.341** |
| Social support | –0.008 | 0.006 | –0.020 | 0.005 | –0.105 | 0.722 | 1.385 | |
| Overcomitment | 0.032 | 0.008 | 0.017 | 0.047 | 0.351** | 0.800 | 1.250 | |
| R=0.607, R2=0.369 | ||||||||
*p<0.05, **p<0.01
The aim of this study was to examine the joint influence of the JDC and ERI models on the bus operators’ BP and psychological strain. The results obtained suggest that while it is true that the study sample presented relatively low exposition to work stressors and favorable health (as measured by the health results included in the study), the JDC and ERI models taken together explain a significant proportion of the bus operators’ BP and psychological strain. In particular, it was found that job strain and E/R imbalance are complementary factors in predicting both psychological strain and BP, and that the combination of job strain, E/R imbalance and over-commitment contribute significantly to the explanation of the bus operators’ psychological strain.
These results are consistent with the literature on the association between work stress and cardiovascular disease34,35,36,37,38,39,40,41,42,43,44,45,46,47) and between work stress and mental health12, 48,49,50,51,52,53,54,55). However, the effect of the JDC and ERI models’ factors on systolic BP and psychological strain was greater than reported in previous studies68, 69). Additionally, to date this is the first single-occupation study in reporting significant associations between job strain, E/R imbalance and BP. These findings confirm that, despite their general nature, the JDC and ERI models offer a useful starting point for research into the specific stressors affecting commercial drivers.
The identification of significant effects of work stressors on the BP of bus operators is particularly important, since, despite the healthy status of the sample, repeated exposure to stressors at work could lead to the development of cardiovascular problems in the medium or long term. For instance, Rosenthal and Alter70) found, after reviewing 34 studies on the presence of work stress and physical and mental illness in different occupational groups, that professional drivers are the occupational group at highest risk for developing ischemic cardiovascular disease and high BP over time.
Concerning the combination of the JDC and ERI models, the evidence obtained suggests that the predictors of the two models offer complementary information, increasing the probability of accurately modeling the workers’ health. In comparative terms, the JDC model was more important in predicting BP, but the ERI model was more important in predicting the psychological strain of bus operators. This result might indicate that despite the existence of some overlap between the JDC and ERI models, especially with respect to the “demand” and “effort” components, a simultaneous examination of job strain, E/R imbalance, social support and over-commitment offers a broader characterization of the work conditions of bus operators. In particular, it is likely that the JDC model capture certain task-level related stressors specific to commercial driving, such as long shifts, accelerated work pace and leading with contradictory demands (e.g. to accelerate the operation and to respect transport regulations)18, 71, 72). Meanwhile the ERI model might capture experiences of adverse costs and gains imbalance at work, some situations typical of the Colombian bus drivers work contract such as job insecurity and poor promotion prospect, and negative social relationships at work, such as conflictive interactions with passengers or traffic controllers during the bus operation. Moreover, the inclusion of the over-commitment scale in a combined stress model clearly represents a predictive advantage, insofar as it provides a characterization of the “intrinsic” characteristics (e.g. stress related motivational patterns) of the employees, which is not implicit in the main components of the JDC and ERI models.
Curiously, social support was not significantly associated with any of the health results included in the study. This result is inconsistent with previous research according which social support at work is an important protective factor of the employees’ health73). The most likely explanations for the statistical irrelevance of social support in this particular study are the selection of a single-occupation group and the reduced sample size26, 73). Studies with these characteristics are more likely to find not significant associations between psychosocial work factors and health due to low variability in the employees’ work conditions26). Additionally, future studies could investigate whether some distinctive characteristics of bus driving, such as little interaction with colleagues during working hours, downplays the role of social support as a resource to cope with work related stressors.
In terms of intervention, the results obtained suggest that modifying psychological factors such as workload, decision latitude, intrinsic and extrinsic rewards and over-commitment could contribute to reducing levels of stress and improving the health of bus operators2, 24, 25, 72). Given that altering these variables would imply modifying company structures and operational schemes, transport companies will be central to the intervention programs to reduce and manage the employees work stress.1) In particular, the reduction in the number of work-related tasks conducted outside working hours (e.g. parking vehicles, or reviewing routes), the establishment of adequate rest periods between shifts, stable routing, and company initiatives to give positive feedback on performance will likely reduce the bus operators’ work stress levels, and in turn benefit their health and organizational performance.
Likewise, some intervention studies using the ERI model have found that modifying the personal characteristics of bus operators can contribute to reducing stress levels in transport companies. According to Aust, Peter and Siegrist25), the reduction of over-commitment contributes to improving the ability of bus operators to cope with work stressors and find a better work-life balance. In particular, training in the management of negative emotions, self-awareness and reducing the personal need of control can be effective in reducing stress and over-commitment25).
The limitations of this study are inherent in its transversal design, the use of self-report measurements, and the sample size and selection. Firstly, the study design did not allow inferring causality from the association between work strain and health. Second, even when self-reporting bias would be compensated by the internal consistency and fidelity of the JCQ, ERI and GHQ questionnaires, the fact that some factors traditionally defined as determinants of BP (BMI, physical activity, alcohol consumption and tobacco use) were not statistically significant in the regression analyses might suggest that the results are not completely free of error in self-reporting work conditions, psychological strain and demographic information.
Moreover, this study is vulnerable to bias. In particular, the lack of information about the nonparticipants makes it impossible to determine whether the bus operators recruited for the study were atypical whit regard to their perceptions about their work conditions or their psychological and cardiovascular health. Generalizability is also limited due to the small sample size that represents only the 8.7% of the operators of rapid transit buses of Bogotá. Nevertheless, the extent of the effects of the combined stress model on BP and psychological strain clearly suggest that at least job strain, E/R imbalance and over-commitment are crucial to the health of bus operators. Future research could overcome the limitations of the current study by analyzing representative samples, using longitudinal designs with prolonged follow-up periods and measuring objective stressors to predict the bus operators’ health. Additionally, given the strength of the association between psychosocial work factors and the commercial drivers’ health, the next step should be to increase the scarce number of intervention studies on work stress-reduction among bus operators.