4. Results and Discussion
4.1. Carbide Precipitation Mechanism during Solidification
The carbide precipitation mechanism during solidification is carefully analyzed for alloys L1 to L5. At that time, the prediction of precipitation sequence and consequent micro-segregation in each phase is compared with those in DSC thermal analyses and M7C3 carbides’ composition measurements.
4.1.1. Phase Precipitation Sequence
Due to the solute redistribution at solid/liquid interface, the composition in residual liquid evolves with the precipitation of solid phases. For example, as shown in Fig. 6, for Fe-4wt%C-17wt%Cr-1.5wt%Ti alloy, that is the nominal or average composition of alloy L3, the precipitation of solids follows the order of MC (1576°C) → primary M7C3 (1329°C) → eutectic M7C3 + FCC (1256°C) → M3C (1109°C). Corresponding to these precipitations, the composition in residual liquid decreases in the order of Ti → Cr → Fe. MC carbide precipitates firstly (with decrease of Ti) and acts as the nuclei of the primary M7C3 carbide (with decrease of Cr).1) Afterwards forms the eutectic M7C3 + FCC as the matrix of HCCI. M3C carbide forms at the final stage of solidification, which results in the decrease of Fe and the increase of Mo and Mn in residual liquid. Since M3C precipitates near the end of solidification, it can be deduced that M3C may be present in only a small amount. From Fig. 6(a), the amount of MC and M7C3 reaches over 33% in volume fraction, thus Fe-4wt%C-17wt%Cr-1.5wt%Ti alloy is recognized as HCCI with large amount of precipitated carbides. On the other hand, as shown for alloy L3 in Figs. 3(a) and 7, the same order of MC (no detection) → primary M7C3 (1322°C) → eutectic M7C3 (or FCC)(1247°C) → FCC (or eutectic M7C3)(1217°C) → M3C (no detection) was detected from DSC thermal analysis on cooling process. Although unfortunately MC and M3C could not be detected due to the small precipitation amount, eutectic M7C3 and FCC which forms as the result of eutectic transformation were separately detected.


Double eutectic heat peaks on DSC cooling curve can be observed. As shown in Fig. 3, there is a single heat absorbing peak relating to the melting of eutectic structure in DSC heating process, while there are double heat release peaks relating to the eutectic transformation in DSC cooling process. The wide interval of the double peaks becomes narrower with the cooling rate being larger (–5 K/min to –70 K/min). The sequent appearance of the eutectic phases is the direct result of diffusion-dominated solidification process, where the phases constituting the eutectic structure M7C3 + FCC appear one by one but not precipitate simultaneously as usually expected. Figure 7 illustrates the possible appearing sequence of eutectic M7C3 and FCC. One possible case is shown in Fig. 7(a), after the formation of primary M7C3, the eutectic M7C3 precipitates firstly (corresponding to the first eutectic peak), so the eutectic transformation starts from the formation of FCC phase (the second eutectic peak), i.e. at 1216.9°C. From the composition analysis in Fig. 5, it is clear that the chemical compositions of primary and eutectic M7C3 are different. It makes possible that the peak denoting the eutectic M7C3 is after the formation of primary M7C3, although the eutectic M7C3 precipitates continuously after the primary M7C3 precipitation. In contrast, the other possible case is as shown in Fig. 7(b), the FCC forms firstly (the first eutectic peak) after the primary M7C3, then precipitates the eutectic M7C3 (the second eutectic peak), thus the eutectic transformation starts at 1247.4°C, i.e. also from the formation of FCC phase.
From the pseudo binary HCCI alloy phase diagram (Fig. 4 in our previous work [1]), it is clarified that the eutectic transformation in multicomponent alloy system is different from that in binary alloy system. That is, in multicomponent alloy system, the eutectic transformation does occur within a temperature range but not under a constant temperature. As illustrated from the DSC curves in Figs. 3 and 7, the eutectic transformation starts from one constituting phase precipitation (1st heat peak) and in a delayed time or an undercooled temperature following the other phase precipitation (2nd heat peak). The gap between two peaks decreases with the faster diffusion of solutes under larger cooling rate solidification condition. Normal eutectic structures of alloy L1 –L4 can be found in Figs. 7 and 12 in Ref. 1), which indicates that they experienced the normal eutectic transformation.
It also should be mentioned that in the case where thermocouple is commonly protected by Al2O3 tube, it is non-sensitive to the sequent precipitation of phases during eutectic transformation, thus the eutectic transformation seems to occur under a constant temperature. However, with more sensitive and accurate DSC thermal analysis, the double peaks corresponding to sequent precipitating phases could be sensed during eutectic transformation in HCCIs.
Figure 8 shows the predicted solidification sequence and the measured DSC data. As seen, the predicted eutectic temperature much approaches to the measured first eutectic peak, that is, the case of Fig. 7(b). It is also indicated that the precipitation sequence of the eutectic structure in HCCIs starts from the precipitation of FCC prior to the eutectic M7C3. The prediction by PE approximation does show the correct solidification nature and predict the effects of alloy content on phase precipitation sequence, as seen in Figs. 1 and 8, which is comparable to the experimental data, although the PE approximation can’t predict the effects of cooling rate on the precipitation temperature of phases, for instance, the phases in the eutectic transformation as shown on DSC curves in Fig. 3.
4.1.2. Composition Evolution (Micro-segregation) in Precipitated Solids during Solidification
For Fe-4wt%C-17wt%Cr-1.5wt%Ti alloy, i.e. the nominal or average composition of alloy L3, the carbide precipitation mechanism during solidification is carefully analyzed according to the precipitation sequence: MC, primary M7C3, eutectic M7C3 + FCC. Figure 9 shows the partition coefficient for each solid phase during solidification.

Solidification starts from the formation of MC carbide. The partition coefficient of Ti in MC,
k
p,Ti
=
w
Ti
*
M
C
/
w
Ti
l
≈40
, which is the highest among all elements (Fig. 9(a)) makes the liquid composition of Ti,
w
Ti
l
, first decreases greatly (Fig. 6(b)). It can be indicated that the decrease of some certain liquid compositions is due to the formation of a new carbide with kp > 1 for those elements. The liquid composition of Cr decreases at the volume fraction of solid gs > 0.026 with the formation of primary M7C3 (Fig. 9(b)), because kp,Cr ≈ 2.7 is the highest among all elements. Afterwards, at gs > 0.15, eutectic M7C3 + FCC forms (Fig. 9(c)) with the partition coefficient in FCC, kp, > 1 for Si, Ni and Fe, but kp < 1 for others. Finally at gs > 0.98, the final eutectic M3C precipitates (Fig. 9(d)) with the partition coefficient in M3C, kp, > 1 for Cr, C, Fe and Mn, while kp < 1 for Mo and Ni, thus totally results in the final increase of Mo and Mn in residual liquid at the final stage of solidification, as seen in Fig. 6(b). It is due to the final formation of M3C, the austenite former element like Mn shows the opposite evolution tendency with Ni but shows the same tendency with the ferrite former elements such as Mo.
4.1.3. Average Composition of M7C3 Carbide
Average composition of M7C3 can be estimated from its micro-segregation profile. In fact, the carbide composition is directly related to its hardness. Here, M7C3 carbide precipitates as both primary and eutectic carbide in HCCIs. The composition of primary / eutectic M7C3 carbide is weighted by the newly precipitated amount of phase, i.e.
∑
k
(
w
C
s
1
k
f
s
1
k
)
/
∑
k
f
s
1
k
, where
w
C
s
1
k
and
f
k
s
1
are the newly formed composition and the newly formed mass fraction of solid s1 at step k. The composition in mass percent of u-fraction (definition of u-fraction is shown in Eq.(3)) is adopted for convenient comparison with the measured EDX data for alloys L1 to L4. The primary M7C3 stage is counted in a temperature loop from its precipitation till the formation of FCC. The eutectic M7C3 is counted during the time when FCC precipitates until the formation of next phase or to the end of solidification.
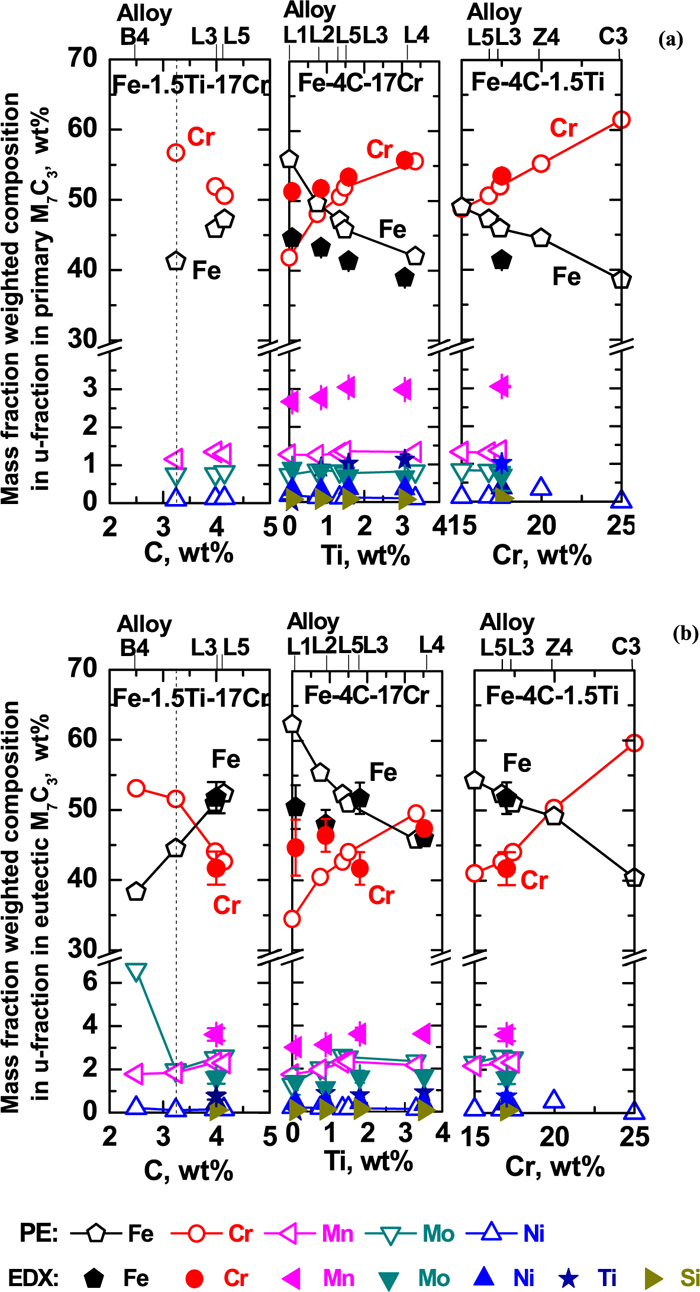
Figure 5 shows these predicted compositions of primary and eutectic M7C3. The constitution of M7C3 for all HCCIs, including alloys L1 to L5, changes from primary (Cr, Fe)7C3 carbide to eutectic (Fe, Cr)7C3 carbide according to the precipitation temepratures. In addition, both in primary and eutectic M7C3, the composition of Cr increases with both Cr and Ti contents but decreases with C content. The Fe in M7C3 varies opposite to the Cr. Even though Ti is not the dominating element in M7C3, its addition does affect the composition of M7C3 through the formation of MC.
The predicted composition by PE approximation fits with the EDX measured composition for both primary and eutectic M7C3 carbides. The predicted M7C3 composition contains 6 elements: Fe, Cr, C, Mn, Mo and Ni; however, the measured composition includes all 8 elements including Ti. In this way, it gives the evidence that MC acts as nucleation site of both primary and eutectic M7C3.
From the prediction of alloys L1–L5, B4, Z4 and C3, it is confirmed that PE approximation provides clearly the useful information, such as precipitation sequence, amount and composition of all carbides.
4.2. Effects of C, Ti and Cr on Carbide Precipitation
The wear-resistant properties of HCCI depend mainly on the nature of M7C3 carbide. The experimental observation has already verified that MC carbide (TiC) is the nucleus of M7C3 carbide in our previous study by Liu. et al.1) Thus TiC is helpful to refine the grain size of M7C3 carbide due to increasing the nucleation density. Moreover, TiC itself is also helpful to the wear-resistant properties of HCCI. Since Ti, Cr and Fe, besides C, are the main constituents of MC and M7C3 (from Figs. 5 and 9), the effects of C, Cr and Ti content on the carbide precipitation sequence, amount and composition are deeply discussed.
4.2.1. Prediction Accuracy on Phase Precipitation Temperature and Sequence
Figure 8 shows the solid phase precipitation sequence as a function of C, Ti and Cr contents in temperature – composition diagrams. The solid lines with open symbols denote the predicted data by PE approximation and the half solid symbols are the DSC thermal analysis data in cooling process (Here, MC could not be detected due to the small precipitation amount). Within the range of C, Ti, Cr content in Fig. 8, the solid phases precipitate in the order of MC, primary M7C3 and eutectic M7C3 + FCC. Only when C is smaller than 3.24 wt%, phases precipitate in the order of MC, primary FCC and eutectic M7C3 + FCC.
The predicted precipitation temperatures of primary M7C3, FCC and eutectic M7C3 are within 7–40°C, 2–48°C and 2–64°C difference from DSC thermal analysis data respectively, while the predicted temperature of solidification end with fs = 0.98 is within 22–116°C difference from DSC thermal analysis data. It is too difficult to estimate accurately the temperatures of solidification end from DSC thermal analysis. So the differences between the prediction and the DSC thermal analysis are within the allowable range of accuracy. Of course, PE approximation itself has some limitations such as neither considering the diffusion of substitutional elements in solid nor considering the diffusion length related to the solidification structure as well as the limitation of the available alloy database.
In a word, it is indicated that the prediction accuracy on phase precipitation temperature and sequence by PE approximation is also reliable for the case of the large amount of precipitated carbides.
Afterwards, the effects of C, Ti and Cr on solid phase precipitation are discussed from the view point of the relationship among precipitation sequence, precipitation amount and averaged composition of carbides.
4.2.2. Effect of C
Precipitation sequence: It is found in pseudo binary phase diagram (Fig. 4(a)), Fig. 8(a) and Table 1 that the precipitation sequence of solid phases is changed with the increase of C. It follows:
Alloy B1 to B5 (C < 3.24 wt%) and C4 (C > 3.24 wt%, Ti > 5.4 wt%):
MC → primary FCC → eutectic M7C3 + FCC
Alloy L1 to L5, Z1 to Z4, C1 to C3 (C > 3.24 wt%, Ti < 5.4 wt%):
MC → primary M7C3 → eutectic M7C3 + FCC
With the increase of C, the precipitation temperature of MC rises. In addition, at C > 3.24 wt%, the primary phase changes from FCC to M7C3. The precipitation temperature of primary FCC gradually decreases and approaches to the precipitation line of M7C3 + FCC when C < 3.24 wt%, while the precipitation temperature of primary M7C3 gradually increases and separates from that of M7C3 + FCC at C > 3.24 wt%.
Precipitation amount: From Fig. 5, MC(TiC), primary M7C3((Cr, Fe)7C3) and eutectic M7C3( (Fe, Cr)7C3 when C > 3.6 wt%, otherwise (Cr, Fe)7C3 ) are the main carbides. In Fig. 10, the experimental data1,2,3,4) are plotted as solid squares for total M7C3 (primary M7C3 + eutectic M7C3), solid down-triangles for primary M7C3 and solid up-triangles for eutectic M7C3, solid stars for total carbide (total M7C3 + MC) and solid circles for MC, respectively. The predicted data by PE approximation are drawn as solid lines with corresponding open symbols.

As shown in Fig. 10(a), when C < 3.24 wt%, the eutectic M7C3((Cr, Fe)7C3) increase with C content; while when C > 3.24 wt%, the amount of primary M7C3((Cr, Fe)7C3) increases much faster than the decrease of eutectic M7C3((Fe, Cr)7C3), although the amount of MC(TiC) is almost constant. Consequently, the total amount of carbides shows about 15% increase by the increase of C from 2.5 to 4.0 wt%, which is mainly due to the contribution of the increase of primary M7C3((Cr, Fe)7C3).
Composition: Considering the hardness control by carbides, Fig. 5 shows the predicted compositions for primary M7C3 (mainly (Cr, Fe)7C3 ) and eutectic M7C3 (mainly (Fe, Cr)7C3 ) for alloys L1 to L5, B4 and Z4. It is found that with the increase of C (from 2.5 to 4.0 wt%):
1) When C > 3.24 wt%, primary M7C3 forms. Then with the increase of C, the Cr content decreases by 6 wt% (from 57 to 51 wt%) and the Fe content increases by 6 wt% (from 41 to 47 wt%), while other elements’ contents are almost at constant (less than 2 wt%). As known, the hardness of (Cr, Fe)7C3 (Vickers hardness: 2305–2410)13) is higher than that of (Fe, Cr)7C3 (Vickers hardness: 1600–1800).13) This decrease of Cr might lead to a decrease of the hardness of primary M7C3.
2) In eutectic M7C3, the Cr content slightly decreases when C < 3.24 wt% (from 53 to 52 wt%), afterwards it decreases largely by 9 wt% (from 52 to 43 wt%). The Fe content increases linearly by 14 wt% (at C < 3.24 wt%, from 38 to 45 wt%; at C > 3.24 wt%, from 45 to 52 wt%). Other elements’ contents are almost at constant (less than 4 wt%) except Mo which changes from 6.5 wt% for hypoeutectic HCCI to 2 wt% for hypereutectic one. This increase of Fe lead the constitution of M7C3 change from (Cr, Fe)7C3 at C < 3.6 wt% to (Fe, Cr)7C3 at C > 3.6 wt%. It might lead to a decrease in the hardness of eutectic M7C3.
4.2.3. Effect of Ti
Precipitation sequence: It was found in pseudo binary phase diagram (Fig. 4(b)), Fig. 8(b) and Table 1 that the precipitation sequence of solid phases doesn’t change with Ti in the range of Ti < 5.4 wt%. It follows,
Alloy L1 (Ti = 0 wt%) to L4 (Ti = 3.36 wt%), alloy Z1 (Ti = 0 wt%) to Z4 (Ti = 1.47 wt%), alloy C1 (Ti = 0 wt%) to C3 (Ti = 2.00 wt%):
MC (With Ti addition)→ primary M7C3 → eutectic M7C3 + FCC
While for alloy B1 (Ti = 0 wt%) to B5 (Ti = 1.68 wt%):
MC (With Ti addition)→ primary FCC → eutectic M7C3 + FCC
When Ti > 5.4 wt%, the primary phase changes from M7C3 to FCC. Thus for alloy C4(Ti = 6.00 wt%):
MC→ primary FCC → eutectic M7C3 + FCC
For alloy L1 to L4, Z1 to Z4 and C1 to C3, with the increase of Ti, the precipitation temperature of MC greatly rises, and the temperature interval between the precipitation of primary M7C3 and eutectic M7C3 + FCC is smaller.
Precipitation amount: From Fig. 5, MC(TiC), primary M7C3 (mainly (Cr, Fe)7C3) and eutectic M7C3 (mainly (Fe, Cr)7C3) are the main carbides. As illustrated in Figs. 10(b1)–10(b4), with the increase of Ti, the amount of MC(TiC) increases largely. At the same time, for hypereutectic alloy (Figs. 10(b1)–10(b3)), the amount of primary M7C3((Cr, Fe)7C3) decreases greatly, although the amount of eutectic M7C3((Fe, Cr)7C3) keeps almost constant. Consequently, the total amount of M7C3 shows decrease while the total amount of carbides shows decrease (Figs. 10(b1)–10(b2)) or almost constant (Fig. 10(b3)) with the increase of Ti from 0 to 3.36 wt%, which is mainly due to the contributions of the decrease of primary M7C3((Cr, Fe)7C3) and the increase of MC(TiC). For hypereutectic alloy (Fig. 10(b4)), the total amount of carbides shows almost constant due to the decrease of total / eutectic M7C3((Cr, Fe)7C3) and the increase of MC(TiC). The available measured data,1,2,3,4) for MC, primary, eutectic and total M7C3 as well as total carbide (M7C3 + MC), fit well with our prediction tendency.
Composition: Considering the hardness control by carbides, the hardness of MC (TiC, Vickers hardness: 3200) is highest, and the hardness of primary M7C3((Cr, Fe)7C3, Vickers hardness: 2305–2410) is higher than that of eutectic M7C3((Fe, Cr)7C3, Vickers hardness: 1600–1800).13) Figure 5 shows the predicted compositions for primary M7C3((Cr, Fe)7C3) and eutectic M7C3((Fe, Cr)7C3) among the main carbides for alloy L1 to L5. It is found that with the increase of Ti (from 0 to 3.4 wt%):
1) In primary M7C3, the Cr content increases by 14 wt% (from 42 to 56 wt%) and the Fe content decreases by 14 wt% (from 56 to 42 wt%), while other elements’ contents are almost constant (less than 3 wt%).
2) In eutectic M7C3, the Cr content increases by 16 wt% (from 34 to 50 wt%) and the Fe content decreases by 16 wt% (from 62 to 46 wt%), while other elements’ contents are almost at constant (less than 4 wt%).
3) It indicates that the increase of Ti changes the M7C3 carbide constitution from (Fe, Cr)7C3 to (Cr, Fe)7C3 in both primary and eutectic M7C3 which will increase the hardness of M7C3 carbide.
4.2.4. Effect of Cr
Precipitation sequence: It was found in pseudo binary phase diagram (Fig. 4(c)), Fig. 8(c) and Table 1 that the precipitation sequence of solid phases doesn’t change with the increase of Cr. It follows,
Alloy L3 and L5 (Cr = 16.7–17.4 wt%) , Z4 (Cr = 19.97 wt%), C3 (Cr = 25.0 wt%) :
MC → primary M7C3 → eutectic M7C3 + FCC
With the increase of Cr, the precipitation temperature of MC rises slightly, and the temperature interval between the precipitation of primary M7C3 and eutectic M7C3 + FCC is slightly larger.
Precipitation amount: It is deduced from Fig. 5 that MC(TiC), primary M7C3((Cr, Fe)7C3) and eutectic M7C3((Fe, Cr)7C3 when Cr < 20 wt%, otherwise (Cr, Fe)7C3 ) are the main carbides. As shown in Fig. 10(c), with the increase of Cr, the amount of MC(TiC) is constant. However, the amount of primary M7C3((Cr, Fe)7C3) increases at Cr < 20 wt% then decreases at Cr > 20 wt%; and the amount of eutectic M7C3 changes oppositely to the primary one. Consequently, the total amount of carbides shows a slight increase with the increase of Cr from 17.4 to 25.0 wt%, which is mainly the contribution of eutectic M7C3((Fe, Cr)7C3).
Composition: Figure 5 shows the predicted compositions for primary M7C3((Cr, Fe)7C3) and eutectic M7C3((Fe, Cr)7C3 when Cr < 20 wt%, otherwise (Cr, Fe)7C3) among the main carbides for alloy L5, L3, Z4 and C3, considering the hardness control by carbides. It is found that with the increase of Cr (from 17.4 to 25.0 wt%):
1) In primary M7C3, the Cr content increases by 13 wt% (from 49 to 62 wt%) and the Fe content decreases by 11 wt% (from 49 to 38 wt%), while other elements’ contents are almost at constant (less than 3 wt%).
2) In eutectic M7C3, the Cr content increases by 19 wt% (from 41 to 60 wt%) and the Fe content decreases by 14 wt% (from 54 to 40 wt%), while other elements’ contents are almost at constant (less than 4 wt%).
3) It indicates that the increase of Cr changes the M7C3 carbide constitution from (Fe, Cr)7C3 to (Cr, Fe)7C3 in both primary and eutectic M7C3, which will increase the hardness of M7C3 carbide.
4.3. Hardness of High Cr Cast Irons
The matrix of HCCI, FCC phase, is mainly in charge of its toughness; while the carbides in the structure act mainly on its hardness. Based on the predicted carbide precipitation amount (Fig. 10) and carbide composition and constitution (Fig. 5), the hardness of high Cr cast irons is evaluated quantatively using the definition of total hardness index of high Cr cast iron and with the help of Vickers hardness data for carbides (Vickers hardness of (Fe,Cr)7C3 is 1600–1800, Vickers hardness of (Cr, Fe)7C3 is 2305–2410, and Vickers hardness of TiC is 3200).13)
The total hardness index of high Cr cast iron drawn in Fig. 11 is defined as the contributions of the hardness of MC and M7C3 carbides and weighted by their predicted volume fraction. Corresponding to the varied constitution of primary and eutectic M7C3 as shown in Fig. 5, different values of Vickers hardness are adopted ((Vickers hardness of (Fe,Cr)7C3 is 1600–1800, Vickers hardness of (Cr, Fe)7C3 is 2305–2410). The lower limit of hardness index labeled ‘min’ and upper limit ‘max’ denote the range of the hardness index, 400–900, using the minimum and maximum Vickers hardness for each carbide constitution.

Table 2. Predicted compositions and precipitation amounts of carbides for Fe–C–Cr–Ti–Mn–Mo–Ni–Si hypereutectic High Cr Cast Irons (five alloys: L1 to L5).
| Alloy | Carbide | Compositions (wt%) | Precipitation amount in volume fraction (–) | Note | Vickness hardness13) |
|---|
| C | Cr | Ti | Ni | Mo | Mn | Si | Fe |
|---|
| L1 | MC | – | – | – | – | – | – | – | – | – | | |
| PrimaryM7C3 | 8.66 | 38.26 | – | 0.17 | 0.66 | 1.15 | – | 51.10 | 0.26 | (Fe, Cr)7C3 | 1600–1800 |
| EutecticM7C3 | 8.60 | 31.49 | – | 0.19 | 1.15 | 1.57 | – | 57.00 | 0.12 | (Fe, Cr)7C3 | |
| M3C | 6.68 | 8.57 | – | 0.52 | 1.91 | 2.73 | – | 79.59 | 0.11 | | |
| L2 | MC | 18.40 | 16.60 | 61.90 | 0.01 | 2.85 | 0.05 | 3.9E-05 | 0.26 | 0.02 | TiC | 3200 |
| PrimaryM7C3 | 8.69 | 43.96 | – | 0.12 | 0.77 | 1.14 | – | 45.31 | 0.12 | (Fe, Cr)7C3 | |
| EutecticM7C3 | 8.61 | 36.99 | – | 0.15 | 1.85 | 1.78 | – | 50.63 | 0.17 | (Fe, Cr)7C3 | |
| M3C | 6.59 | 7.40 | – | 0.44 | 4.88 | 4.87 | – | 75.80 | 0.24 | | |
| L3 | MC | 18.30 | 14.10 | 65.10 | 0.01 | 2.32 | 0.05 | 3.8E-05 | 0.21 | 0.03 | TiC | |
| PrimaryM7C3 | 8.71 | 47.39 | – | 0.11 | 0.70 | 1.23 | – | 41.86 | 0.11 | (Cr, Fe)7C3 | 2305–2410 |
| EutecticM7C3 | 8.61 | 40.26 | – | 0.14 | 2.31 | 2.12 | – | 46.56 | 0.18 | (Fe, Cr)7C3 | |
| M3C | 6.47 | 0.07 | – | 0.16 | 8.18 | 11.40 | – | 73.70 | 3.8E-5 | | |
| L5 | MC | 18.30 | 14.10 | 64.90 | 0.01 | 2.48 | 0.04 | 2.0E-05 | 0.21 | 0.03 | TiC | |
| PrimaryM7C3 | 8.70 | 46.20 | – | 0.11 | 0.75 | 1.18 | – | 43.10 | 0.10 | (Cr, Fe)7C3 | |
| EutecticM7C3 | 8.60 | 39.00 | – | 0.13 | 2.38 | 2.09 | – | 47.80 | 0.19 | (Fe, Cr)7C3 | |
| M3C | – | – | – | – | – | – | – | – | – | | |
| L4 | MC | 18.00 | 10.30 | 69.20 | 0.01 | 2.24 | 0.04 | 4.0E-05 | 0.18 | 0.06 | TiC | |
| PrimaryM7C3 | 8.73 | 50.83 | – | 0.09 | 0.75 | 1.21 | – | 38.38 | 0.05 | (Cr, Fe)7C3 | |
| EutecticM7C3 | 8.65 | 45.31 | – | 0.11 | 2.13 | 1.97 | – | 41.83 | 0.18 | (Cr, Fe)7C3 | |
| M3C | – | – | – | – | – | – | – | – | – | | |
It is known from Fig. 10 that M7C3 carbide dominates in the amount of total carbides. With the increase of C and Cr content, the amount of M7C3 and total carbides increases. Although the increase of Ti decreases the total amount of the carbides as a direct result of decreasing the amount of M7C3 but increasing the amount of MC, the total hardness of the alloy is compensated since the Vickers hardness of MC is much higher than that of M7C3. As a result, the maximum and minimum hardness index of high Cr cast iron increase with the increase of C, Ti and Cr contents except the case at Ti = 0. In that case, there is no hardest MC, but the primary and eutectic M7C3 ((Fe, Cr)7C3) occupies much higher amount of carbides than other Ti addition cases. Within the composition concerned, the highest hardness index, 850–900, is obtained at the 4 wt%C, 1.5 wt%Ti and 25 wt% Cr content. Considering the moderate addition of the alloy element, the addition of Cr with 17–20 wt% content might be recommended.
;%0A%09%09%09newWindow.document.open();%0A%09%09%09newWindow.document.write('<img src=%22./Graphics/54_374_tbl_1.jpg%22>');%0A%09%09%09newWindow.document.close();%0A%09%09)