Regular Article
Influence of Content and Microstructure of Deposited Carbon on Fluidization Behavior of Iron Powder at Elevated Temperatures
2014 Volume 54 Issue 3 Pages 589-595
Details
2014 Volume 54 Issue 3 Pages 589-595
Carbon was deposited on the surface of an iron powder to study the influence of carbon content and microstructure on defluidization prevention at 823–1173 K. It was found that at each temperature there existed a minimal carbon content (Cmin), below which defluidization occurred and Cmin increases with increasing operation temperature. Microstructure of the deposited carbon, tailored by adjusting deposition conditions, showed significant influence on defluidization. Less carbon would be needed to prevent defluidization under a lower rate of carbon deposition since a more uniformly coating of carbon can be obtainable under such conditions. When the fluidizing gas is nitrogen, defluidization will eventually occur after extended time of fluidization even if the initial carbon content is greater than Cmin, due to attrition that causes the decrease of carbon content with increasing time of fluidization. However, when the fluidizing gas is 70% CO-30% H2, defluidization will not occur if the initial carbon content is greater than Cmin since the carbon content will increase with increasing time of fluidization due to the further deposition of carbon under the CO–H2 atmosphere. Furthermore, a fluidizing phase diagram was established for the carbon-coated iron powder and the mechanism of defluidization prevention was explained using a cohesive force based model.
Direct reduction (DR) of iron ore powder through fluidized bed reactors has been seriously hindered by the defluidization problem caused by agglomerations attributed to the high cohesion of newly-formed metallic iron at elevated temperatures.1,2,3) In order to prevent defluidization, following methods have been proposed: (1) low temperature reduction (bellow 1073 K); (2) using iron ore with large grain size (>2 mm) as feed; (3) addition of inert materials, such as MgO, CaO or coke powder.4,5,6,7,8,9,10) Although these methods were quite effective in experimental scales, none of them is preferred in economy for industrial practice. The first two methods could lead to slow reduction rates in practice, and the third method would add extra procedure of mixing and is ineffective for fine iron ore with small size (e.g. less than 0.25 mm) and high metallization degree.11)
Carbon deposition shows good effect on preventing defluidization and maybe more economic and convenient, as compared with the above methods.11,12,13,14) Carbon is deposited on particle surface through the Boudouard reaction (2CO→CO2 + C) at relatively low temperatures in a pre-reduction fluidized bed reactor. And then, the carbon-coated particles can be reduced in a subsequent fluidized bed at elevated temperatures without defluidization, owing to the physical barrier effect of the carbon shell.
O. Saeki et al.12) reported that defluidization could be prevented at 1173 K by carbon deposition from cracking of hydrocarbon vapor. The quantity of carbon was not particularly limited, and 3.5 to 5 mass% was found to be sufficient to prevent defluidization. D. Neuschütz et al.11) conducted the fluidization experiments of Newman hematite ore, where the iron ore powder was pre-reduced in CO at 823–899 K for carbon deposition, followed by further reduction in 90% CO-10% H2 at 1073 K. It showed that 6 mass% carbon was not sufficient to prevent sticking, and at least 13.3 mass% would be needed. Recent study by B. Zhang et al.13) found that defluidization could still occur for the reduction of Fe2O3 even with 8.7 mass% carbon deposition, while defluidization could be prevented by depositing 14 mass% carbon.
The above reports indicate that carbon coating is feasible to avoid defluidization. However, two important issues have not been sufficiently researched in previous studies. Firstly, optimum content of deposited carbon for defluidization prevention has not come to any uniform conclusion. The minimal carbon content (Cmin) needed to prevent sticking has great differences in the previous studies, varying from 3 mass% to 14 mass%. Secondly, whether the microstructure of carbon deposition on the surface have any effects on preventing defluidization has not been studied yet.
The difficulty for clarifying these two issues lies in that both the composition and superficial structure of the iron ore particles, which are the main influencing factors of fluidization property, are changeable during the reduction reaction. In particular, the carbon on the surfaces of iron-ore particles may be consumed due to its reduction reaction with iron ore, and the carbon coating may be broken down by the formation of iron whiskers, both of which contribute to the increase of sticking tendency.11,13) In addition, the composition of iron ore also probably has significant effects on defluidization during the reduction process. Some iron ores have a low sticking temperature of 983 K,9) while others could keep fluidization at as high as 1113 K.15)
To focus on the impact of carbon deposition on the fluidization property and avoid the interference of reduction reactions, iron powders which have the great similarity to the reduced iron ore particles on the composition and superficial structure were employed to simplify the research. The effects of deposited carbon content, deposition condition, fluidization gas composition and temperature on the defluidization were carefully investigated. The minimal carbon content (Cmin) needed to prevent sticking was established, and the mechanism of preventing defluidization by carbon deposition was also discussed.
Fluidization experiments were conducted in a quartz fluidized bed reactor with an inner diameter of 16 mm and a height of 860 mm, which was set in an electric resistant furnace with a PID temperature controller, as shown in Fig. 1. And a thermocouple was inserted into the bed for temperature measurement. The flow rates of feeding gases, including N2, H2 and CO (99.99%, Huayuan Gas Chemical Industry Co. Ltd, Beijing, China), were controlled by digital mass flow controllers. In addition, pressure drop of the bed was measured by a differential pressure sensor and recorded by a personal computer.
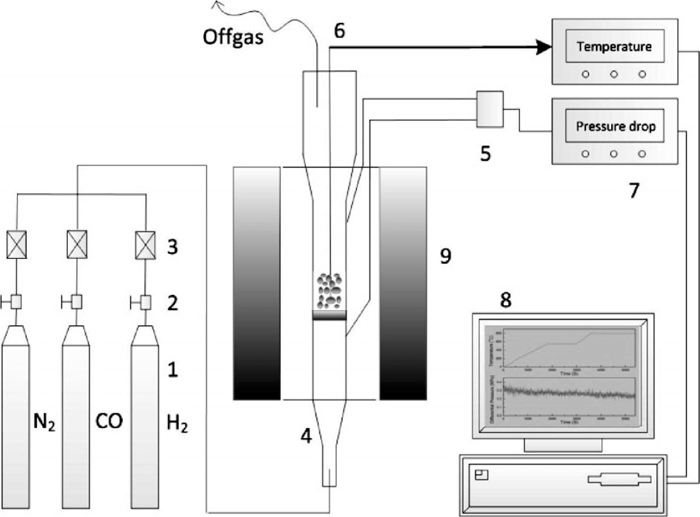
Schematic diagram of the fluidized bed apparatus (1-Gas Cylinder; 2-Shutoff Valve; 3-Mass Flow Controller; 4-Fluidized Bed Reactor; 5-Differential Pressure Sensor; 6-Thermocouple; 7-Display Instrument; 8-Data Acquisition System; 9-Electric Resistance Furnace).
Compact iron powder (Fe≥98.5%, Beijing Chemical Reagents Company, Beijing, China) with grain size of 106–150 μm was used as the raw material in this work. Its morphology was characterized by field emission scanning electron microscopy (FESEM, Quanta 200, FEI, the Netherlands). As shown in Fig. 2, most particles were ellipsoid with smooth surfaces. Without special instructions, the iron powders were heated in a fluidized bed in 1.5 L/min 50% CO-50% H2 gas stream at 823 K to coat carbon on the surface prior to the fluidization behavior study.
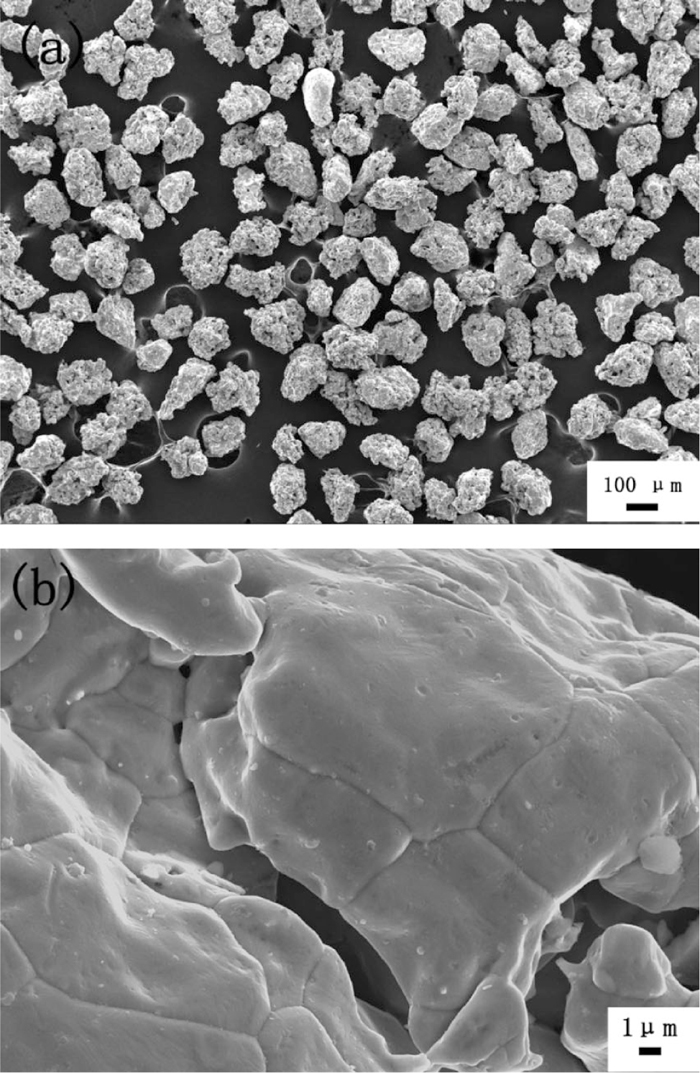
Surface morphology of raw iron powder.
The fluidized bed reactor was first heated to desired temperature under N2 atmosphere with a flow rate of 1.0 L/min. 8.00 g samples were then fed into the fluidized bed reactor. After the sample in the bed was heated to the desired temperature (usually within 3 min), the gas was switched to fluidizing gas (N2 or CO–H2) with pre-set flow rates. Bed temperature and pressure drop were measured and recorded by a data acquisition system. When it reached the desired time or complete defluidization occurred, fluidizing gas was switched back to N2 gas with flow rate of 1.0 L/min immediately. The reactor was removed from the furnace and the sample was cooled down to room temperature in N2 atmosphere. The carbon contents of the obtained samples were measured by a carbon-sulfur analyzer (LECO CS-344, USA). And the morphologies of samples were characterized by FESEM. From the pressure drop profile, defluidization time (tdef) was determined as reported by Y. W. Zhong et al.16)
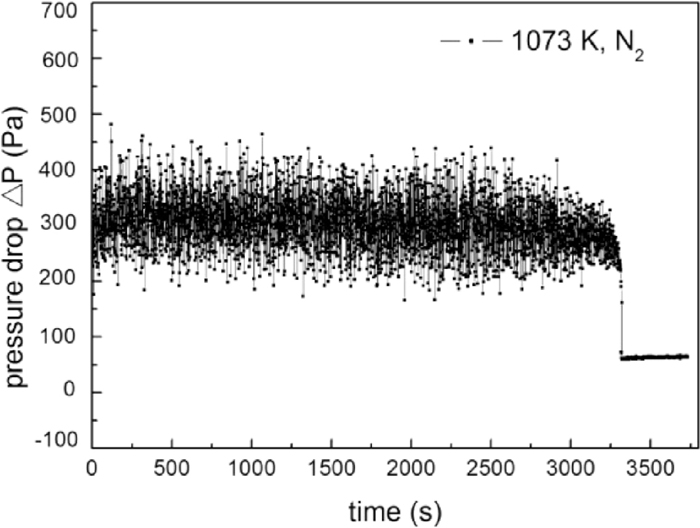
In order to compare the fluidization behaviors of the iron powder with and without carbon deposition, pure iron powder was firstly fluidized in N2 at 823–1073 K, with a gas velocity of 0.3 m/s. It was found that the defluidization temperature of the iron powder was 948 K, below which fluidization could be maintained for more than 2 h without defluidization as shown in Fig. 3(a). However, defluidization occurred at temperatures equal or higher than 948 K, and the defluidization time (tdef) decreased with increasing temperature as shown in Fig. 4. At 1073 K, tdef was only 2 min and complete defluidization occurred before the sample was heated to 1073 K as shown in Fig. 3(b). Similar relationship between defluidization time and temperature has been reported during direct reduction of ultrafine hematite powder17) and iron ore by J. F. Gransden et al.9) The decrease of defluidization time was considered as a result of higher adhesive force of particle at higher temperatures.
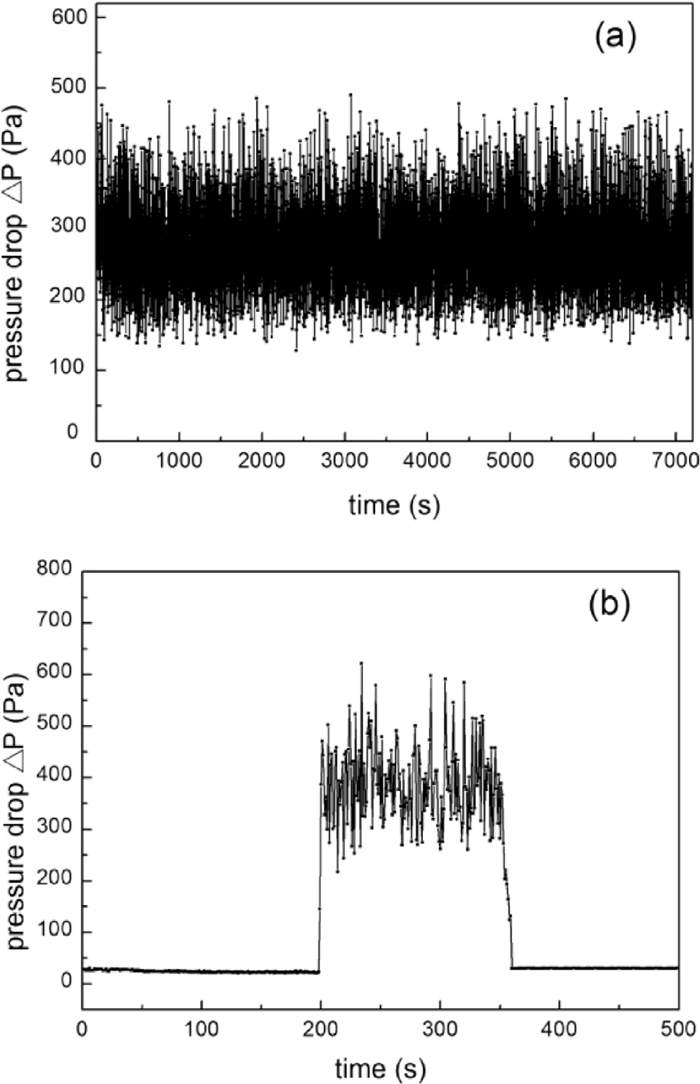
Pressure drop fluctuation of iron powder fluidization in N2 (a-923 K; b-1073 K).
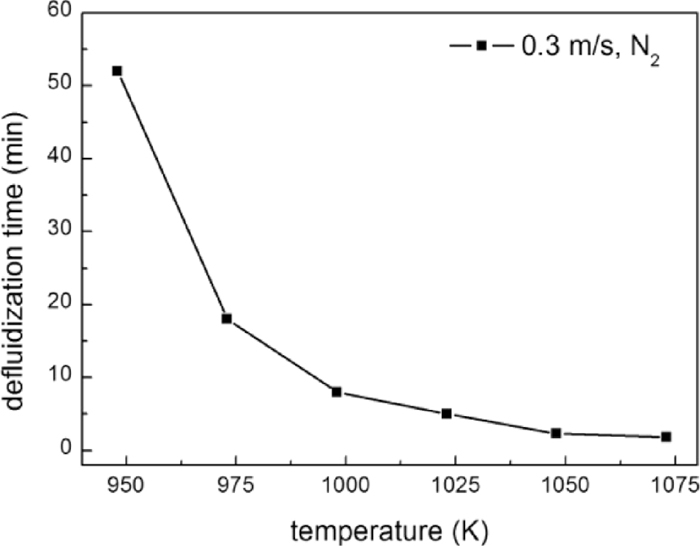
Variations of defluidization time with temperature.
To investigate the influence of carbon content on the fluidization performance without chemical reaction, carbon coated iron powders, prepared in 1.5 L/min 50% CO-50% H2 gas stream at 823 K, were fluidized in N2. Figure 5 shows the pressure drop profile of the fluidized bed of iron powder coated with 2.48% carbon in 1073 K, with the superficial gas velocity of 0.3 m/s. Within initial 45 min, the pressure drop was quite steady. Thereafter, the pressure drop fell quickly, indicating a complete defluidization. As compared to Fig. 3(b), the tdef of iron powder increased from 2 to 56 min with 2.48 mass% carbon deposition, indicating that defluidization has been effectively retarded by the carbon deposition.
Pressure drop fluctuation of fluidization of iron powder with 2.48 mass% deposited carbon at 1073 K in N2.
In order to check the reason of the defluidization, the variations of carbon content during fluidization process were characterized and presented in Fig. 6. It shows that the carbon content decreases with increasing time of fluidization, e.g., the carbon content decreases to 1.9 mass% and 1.51 mass% from 2.48 mass% after fluidization for 10 min and 56 min, respectively. Considering there was no chemical reaction, the cause of decreasing carbon content might be attributed to the attrition of deposited carbon due to the collision of particles. This judgment was confirmed by the fact that carbon particles were found in the bed material and the off-gas stream.
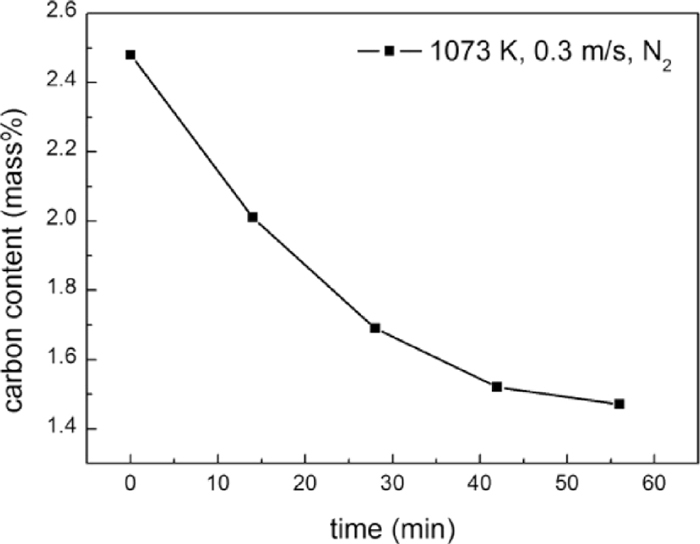
Variations of carbon content of iron powder with 2.48 mass% deposited carbon.
In order to find the suitable carbon content of iron powder for preventing defluidization, iron powders with different initial carbon contents were fluidized in N2 at 1073 K, with a gas velocity of 0.3 m/s. The defluidization time versus the initial carbon content is shown in Fig. 7. It can be seen that there is an inflection point with the value of 1.52 mass%, where when the initial carbon content of iron powder is less than 1.52 mass%, the defluidization time (tdef) is less than 2 min, indicating such a coating mass is insufficient. When the initial carbon content is greater than 1.52 mass%, the defluidization time (tdef) increased linearly with increasing the initial carbon content. With deposited carbon content of 2.05 mass% and 3.92 mass%, the defluidization time (tdef) of the iron powder could be retarded to 42.5 min and 212 min respectively. Thus, the value of inflection point could be considered as the minimal carbon content (Cmin) needed to prevent sticking. The carbon content of samples after defluidization (Cdef) is shown Fig. 8. It is very interesting to note that although the initial carbon content of samples were different, the values of Cdef were in a narrow range, from 1.36 mass% to 1.78 mass%. It is reasonable to infer that Cdef is equal to Cmin on average.

Influence of initial carbon content of iron powder on defluidization time.
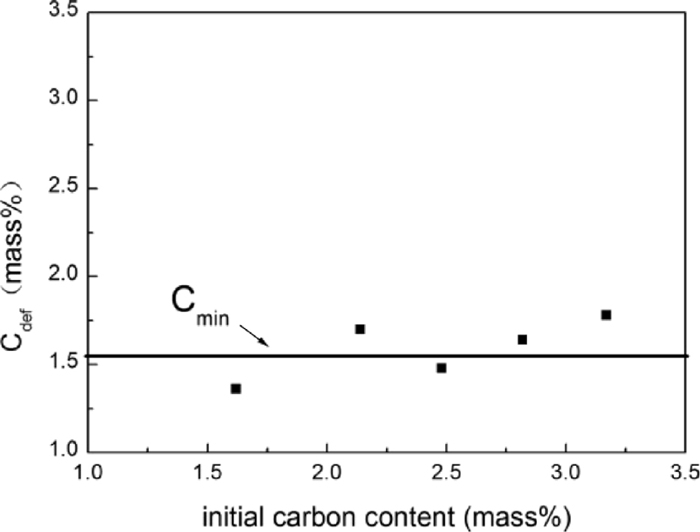
Carbon content of defluidization samples at 1073 K in N2.
The above results indicate that carbon deposition on the surface of iron particles could effectively retard sticking. However, the carbon content decreases with increasing time of fluidization due to attrition, resulting in final defluidization. The Cmin may therefore be a useful parameter to estimate the effect of carbon deposition on preventing defluidization, where smooth fluidization could be maintained only when the carbon content of iron powder exceeds the Cmin.
3.2.2. Influence of TemperatureIn order to figure out the influence of temperature on the fluidization performance, iron powders with different initial carbon content were fluidized in N2 at 1023–1173 K, with a gas velocity of 0.3 m/s. Figure 9 shows the variations of Cmin and Cdef with the fluidization temperature. At each temperature, Cdef is nearly the same as the Cmin. Both the Cmin and Cdef increase with increasing the fluidization temperature. The Cmin at 1173 K is 3 mass%, which is almost twice of that at 1073 K. Figure 10 shows the influence of temperature on the tdef. For the iron powder with nearly the same initial carbon content (2.6 mass%), the tdef decreases with increasing the temperature. It is necessary to note that the Cmin of iron powder in the present work is much lower than that obtained in previous studies.11,12,13,14)

Effect of fluidization temperature on Cmin and Cdef.
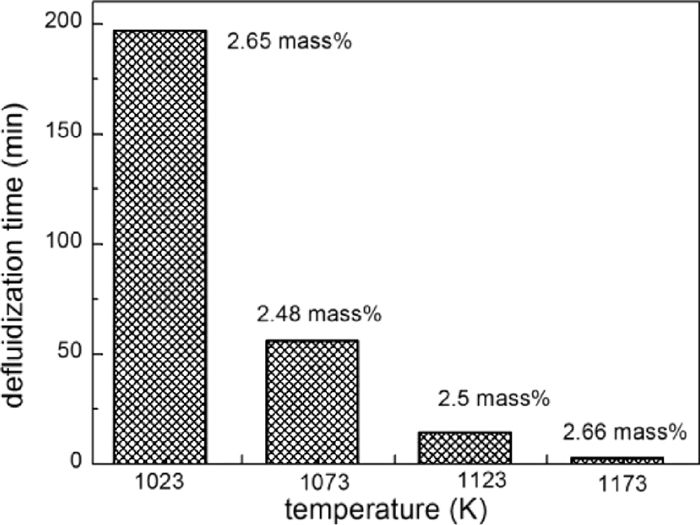
Effect of fluidization temperature on tdef.
For comparing the influence of carbon deposition condition on Cmin, carbon was deposited on the surface of the iron powder in two different conditions, where sample A was obtained at a relative high deposition rate (1.5 L/min 50% CO-50% H2 gas stream at 823 K), while sample B was deposited at a lower rate (1.5 L/min 83.3% CO-16.7% H2 gas stream at 823 K), as seen from Fig. 11. The Cmin values of the two coated samples obtained at 1073 K and 1173 K are given in Fig. 12. It was found that carbon deposition condition has significant effect on defluidization. Sample B, from the low rate of carbon deposition, has a lower Cmin, which is about 2/3 of that of sample A. Thus, it can be seen that samples prepared in lower deposition rate is able to prevent defluidization with lower carbon content.

Rate of carbon deposition at different conditions.

Influence of the condition of carbon deposition on Cmin (sample A: high deposition rate; sample B: low deposition rate).
To understand how the deposition condition influences the defluidization behavior of the powders, microstructures of the samples prepared in the two conditions were investigated. Figure 13(a) shows the surface morphology of sample A. The surface (see Spectrum 1 in Table 1) was covered non-uniformly by big carbon agglomerations in sizes of 2–7 μm, which were constituted of small carbon grains in sizes of 0.1–0.3 μm. EDS analysis shows that the Fe/C ratio is only 0.035. However, other places (see Spectrum 2 in Table 1) were still uncovered and its Fe/C ratio is as high as 2.29. Figure 13(b) shows the surface morphology of Sample B. Comparing with Fig. 13(a), no big carbon agglomerations were observed, the particle surface was covered uniformly by small carbon grains of 0.1–0.3 μm, the Fe/C ratio on the surface is only 0.25 (see Spectrum 3 in Table 1). The result indicates that the distribution and morphology of the deposited carbon changed dramatically in different deposition conditions.
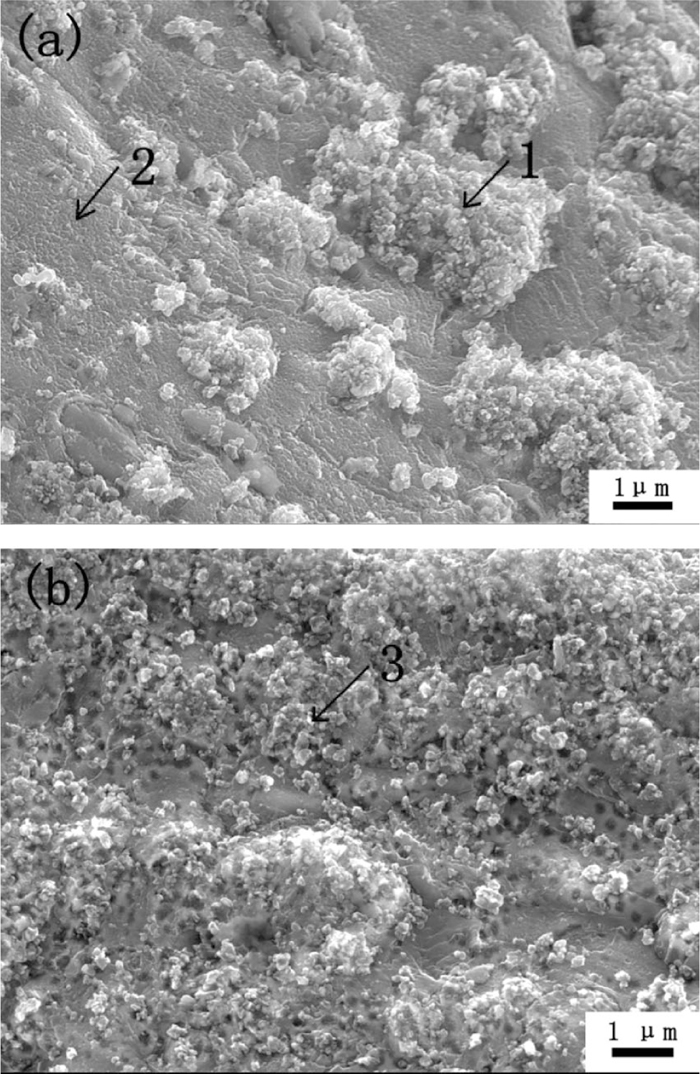
Surface morphology of the iron powder with carbon deposition (a-2.15 mass% carbon, sample A; b-2.07 mass% carbon, sample B).
| Spectrum | 1 | 2 | 3 | 4 | |
|---|---|---|---|---|---|
| Element (Atomic %) | Fe | 3.3 | 69.7 | 20.1 | 4.7 |
| C | 93.9 | 30.3 | 79.9 | 95.3 | |
The above discussion demonstrates that Cmin could be reduced significantly by controlling the carbon deposition condition, which implies a possible save in the consumption of deposited carbon in an actual DR process. Besides, this result also implies that the inconsistency of Cmin obtained in previous studies may be induced by the difference of carbon deposition conditions.
3.3. Fluidization Behavior of Carbon-coated Iron Powder in CO–H2The fluidization behavior of iron powder with carbon deposition in reductive gas stream was also investigated. Iron powder with 2.48 mass% deposited carbon (prepared in the condition of high deposition rate) was fluidized in 70% CO-30% H2 gas mixtures with the gas velocity of 0.3 m/s at 1073 K. As mentioned above, iron powder with 2.48 mass% deposited carbon defluidized within 1 h in N2, due to the decrease of carbon content by attrition. However, in the atmosphere of CO–H2, fluidization was quite stable even after 2 hours as shown in Fig. 14. Moreover, the bed pressure drop increased significantly, which means that the quantity of the bed material might have increased. As shown in Fig. 15, the carbon content increases linearly with time and reached 24.43 mass% after fluidization for 2.0 h. SEM image shows that iron powder was completely covered by carbon, the Fe/C ratio on the surface (see Spectrum 4 in Table 1) became as low as 0.05, and the thickness of carbon coating layer reached 8–10 μm (see Fig. 16).
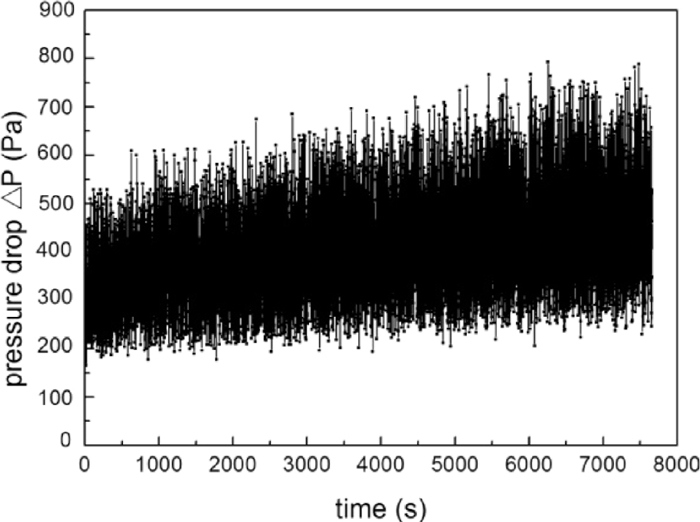
Pressure drop fluctuation of fluidization of iron powder with 2.48 mass% deposited carbon at 1073 K in 70% CO-30% H2.

Variation of carbon content of iron powder with 2.48 mass% deposited carbon in 0.3 m/s, 70% CO-30% H2 gas mixtures at 1073 K.
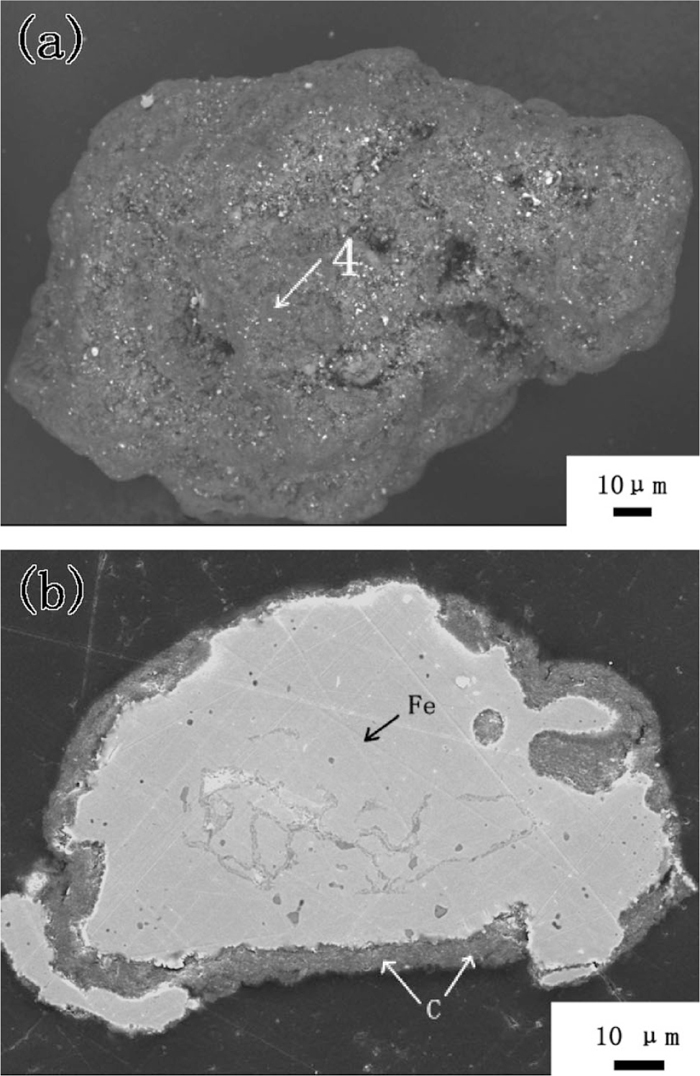
Morphology of an iron particle with 24.43 mass% carbon (a-surface; b-cross section).
According to E. T. Turkdoga et al.18) and N. Towhidi et al.,19) the carbon deposition reaction could happen bellow 1273 K, and the reaction rate will dramatically enhance if there is Fe in the system as catalyst. Besides, a small amount of hydrogen could enhance markedly the rate of carbon deposition, due to the catalytic effects and the occurrence of the H2 + CO→H2O + C reaction. Thus, we believe that the increase of carbon content of iron powder was mainly caused by the carbon deposition reaction, which is much faster than the weight loss due to attrition among particles. Defluidization was prevented by constant formation of new layers of carbon in CO–H2.
To further investigate the defluidization preventing effect of carbon deposition in CO–H2, iron powder with different carbon content were fluidized in the 1.0 L/min, 70% CO-30% H2 gas mixtures, at the temperatures of 1023–1173 K. As shown in Fig. 17, there are two operating modes: stable fluidization and fast defluidization. The value of boundary at each temperature is almost the same to the Cmin in N2, which indicates that change of fluidizing gas has no obvious effect on the value of Cmin. When the initial carbon content was below the boundary, defluidization would occur quickly due to the insufficient coating, with a pressure drop curve similar to that in Fig. 4; when the initial carbon content was above the boundary, the fluidization state of the sample was quite stable and no defluidization was observed, and its pressure drop curve is similar to that in Fig. 14. From the above results, we conclude that defluidization could be completely prevented in CO–H2 gas mixtures only when the initial carbon content exceeds the Cmin.
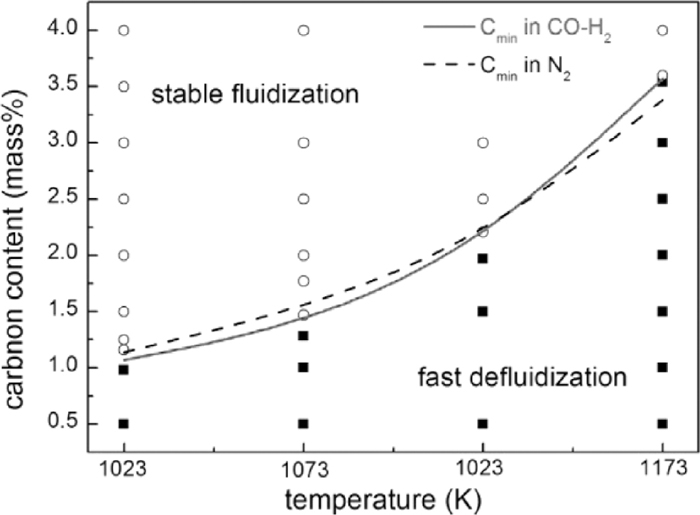
Phase diagram of fluidizing performance of iron powder in 70% CO-30% H2 (hollow point-stable fluidization; solid point-fast defluidization).
In general, defluidization at elevated temperatures is cause by the great cohesion of particle, and prevention of defluidization by carbon deposition is mainly attributed to the construction of non-cohesive carbon coating layer.11,12,13,14) However, further analysis was seldom discussed in previous studies.
For the iron powder without carbon coating layer, the inter-particle cohesion force (Fc) can be described by the cohesion force of the neck between particles (see Eq. (1)).20,21)
| (1) |
At a given operation condition, the surface tension γ (N/m), the curvature radius α (m), the lattice constant δ (m), the frequency factor D0, s (m2/s), the Boltzmann constant k (J/K) and the tensile strength of a neck between particles σneck (N/m2) are constant.20) The sintering time t (s) is collision time, which is also a constant as fluidization velocity was all the same in our experiments. The activation energy of surface diffusion Es is 2.21×10⁵ J/mol.20) Thus, A0 is a constant, and Fc is just the function of temperature.
For the iron powder with carbon coating layer, there are three contact patterns during collision of two particles: (1) Fe–Fe; (2) Fe–C; (3) C–C. Only the contact of Fe–Fe would induce sticking. Assuming the surface coverage fraction by carbon is x (0≤x≤1), the chance of contact of Fe–Fe is only (1–x)2 during a collision. Thus, the inter-particle cohesion force (Fc) can be further given by Eq. (2) in consideration of coating. As shown in Fig. 18, Fc increases exponentially with the temperature and decreases with x.
| (2) |

Relative cohesion force (Fc) for iron powder as a function of temperature and surface coverage fraction.
From our previous fluidization experiments, we know that the maximum temperature of stable fluidization for iron powder is 923 K, and defluidization will occur at a higher temperature where Fc exceeds Fc(T=923 K, x=0). Thus, Fc(T=923 K, x=0) could be considered as the critical value of fluidization and defluidization, and fluidization performance of iron powder could be calculated based on that in theory, as shown in Fig. 19. The calculation results in Fig. 19 are similar to the experimental results of Cmin in Fig. 17. Calculation also revealed two existing operating regimes: fluidization and defluidization. The boundary could be considered as the high-temperature defluidization limit, where x should exceed the minimal surface coverage fraction (xmin) on the boundary to prevent defluidization. Besides, the minimal surface coverage fraction (xmin) increases with increasing the temperature due to the increase of cohesion force.

Phase diagram of fluidizing performance by calculation.
The carbon content of particle can be given by Eq. (3), where h is the thickness of carbon deposition on average. Substituting xmin into Eq. (3), the Cmin is proportional to xmin (see Eq. (4)). Thus, our calculation results could predict theoretically the existence of Cmin and its increasing tendency with temperature, which are in good accordance with the experiment results in Fig. 17.
| (3) |
| (4) |
The effect of carbon deposition on the fluidization performance of iron powder has been investigated in N2 and CO–H2 at 823–1173 K.
It was found that at each temperature there existed a minimal carbon content (Cmin), below which defluidization occurred. The Cmin increases with increasing operation temperature due to the increase of cohesion force of particles and is equal to the carbon content of sample after defluidization. Microstructure of the deposited carbon has significant influence on defluidization, Cmin decreases dramatically due to a more uniformly coating of carbon obtained under a lower deposition rate condition, which could enhance the efficiency of preventing defluidization.
Variation of composition of fluidizing gas has little direct effect on the Cmin, rather it changes the stability of the carbon coating layer. The deposited carbon layer will be destroyed in N2 due to attrition, which decreases the carbon content with increasing time of fluidization and finally induces defluidization; while it will grow constantly in CO–H2 due to further deposition of carbon under the CO–H2 atmosphere, which is helpful for improving fluidization quality.
Theoretical analysis and calculation demonstrate the existence of Cmin and its increasing tendency with temperature. And the calculation results of fluidization phase diagram of carbon-coated iron powder are in good accordance with the experiment results.
The authors are grateful to the Major State Basic Research Development Program of China (Project No. 2013CB632603) and the National Natural Science Foundation of China (Grant No. 21325628).