Regular Article
Retraction: A Prediction Model of Phosphorus Distribution between CaO–SiO2–MgO–FeO–Fe2O3–P2O5 Slags and Liquid Iron
2014 Volume 54 Issue 4 Pages 756-765

Details
2014 Volume 54 Issue 4 Pages 756-765
CaO−SiO2−MgO−FeO−Fe2O3−P2O5 slags is typical in the basic oxygen steelmaking(BOS) process. Phosphate distribution between slags and liquid iron is an index of the phosphorus holding capacity of the slag, which determines the phosphorus content achievable in the finished steel. In this study, a thermodynamic model for calculating phosphorus distribution between CaO−SiO2−MgO−FeO−Fe2O3−P2O5 slags and liquid iron, i.e., IMCT−Lp model, has been developed coupled with a developed thermodynamic model for calculating mass action concentrations of structural units, i.e., IMCT−Ni model, based on ion and molecule coexistence theory. Simple binary basicity R have a large effect on equilibrium mole number Σni of structural units in CaO–SiO2–MgO–FeO–Fe2O3–P2O5 slags, the formula of equilibrium mole number Σni against the simple binary basicity R of slags can be regressed as Σni = 2.604 – 3.029*exp(–R/2.339), and the fitting degree is 0.995. The comparison of the calculated phosphorous distribution by IMCT−Lp model with the measured phosphorous distribution reported from different literatures shows that the agreement between the calculated phosphorous distribution and measured phosphorous distribution is good. Meanwhile, some other Lp prediction models have also been taken into consideration for calculating phosphate distribution between CaO−SiO2−MgO−FeO−Fe2O3−P2O5 slags and liquid iron, and the results shows that IMCT−Lp model have more accuracy compared with other Lp prediction models. The developed IMCT−Lp model can quantitatively calculate the respective contribution of FetO, CaO+FetO and MgO+FetO in the slags. A significant difference of dephosphorziation abilities among FetO, CaO+FetO and MgO+FetO can be found as approximately 0.00%, 99.98%, 0.01%. Meanwhile, the phosphorus in liquid iron can be effectively extracted by CaO+FetO in slags to form complex molecules 3CaO·P2O5 which made the main contribution to dephosphorizaiton in CaO–SiO2–MgO–FeO–Fe2O3–P2O5 slags.
Phosphorus can make the steel prone to embrittlement during heat treatment and cause degradation of electrical properties. It’s therefore useful to study suitable metal-slag reactions with the objective to remove phosphorus from steel melts below up-to-date limits. Many studies were carried out to measure phosphorous distribution between various slags and liquid iron.1,2,3,4,5,6) Colclough1,2) have made experiments involving the dephosphorization from the liquid iron in a basic open-hearth furnace, and he proposed that the phosphorus in liquid iron was mainly extracted in the form of tetra-calcium phosphate (4CaO·P2O5). Herty3) carried out a series of experiments using an experimental furnace as well as 200 T basic open-hearth furnace and came to the conclusion that P2O5 formed tri-calcium phosphate (3CaO·P2O5), but not tetra-calcium phosphate (4CaO·P2O5). Considering the fact that the measurement of phosphorous distribution between molten slag and liquid iron was costly and difficult in the operation, several attempts4,5,6,7,8) were made to describe and predict phosphorus partition ratios as a function of slag composition. Healy4) conducted a series of experiments involving the measurement of phosphorus distribution between slags and liquid iron, and published the famous correlation for equilibrium phosphorus partition in a wide range of slag compositions and temperatures as
Many researchers5,6,12,35,36,37,38,39,40) have worked towards estimation of γP2O5 in metallurgical slags with different chemical compositions. Turkdogan and Pearson5) proposed an expression of activity coefficient of P2O5 as a function of slag compositions i.e., lgγP2O5 = –1.12(22XCaO + 15XMgO + 13XMnO + 12XFeO –2XSiO2) –
Suito et al.11) and Kobayashi et al.12) made extensive work on the dephosphorizaion ability of steelmaking slags containing MnO, and they observed that the addition of MnO had a negative effect on dephosphorization. In 2007, Basu et al.10) conducted experiments to establish for equilibrium phosphorus partition between CaO–SiO2–MgO–FeO–P2O5 slags and molten Fe which is free from Al2O3 or MnO, and proposed the correlation for equilibrium phosphorus partition in terms of ionic.
From the above discussion, it can be obviously observed that much of the previous work was carried out using artificial parameters, and most of the regressed parameters were valid only within certain limits of concentration. The present study developed a fresh model without artificial regressed parameters to establish phosphorus partition between CaO–SiO2–MgO–FeO–Fe2O3–P2O5 slags and liquid iron based on the ion and molecule coexistence theory. The measured data of phosphorus distribution of CaO–SiO2–MgO–FeO–Fe2O3–P2O5 slags equilibrated with liquid iron in a temperature range from 1823 K to 1923 K reported by Nagabayashi et al.13) and the measured data of phosphorus distribution of CaO–SiO2–MgO–FeO–P2O5 slags equilibrated with liquid iron in a temperature range from 1873 K to 1923 K by Basu et al.10) were both selected to verify the accuracy of the developed IMCT–Lp prediction model. It should be pointed out that CaO–SiO2–MgO–FeO–P2O5 slags was a special CaO–SiO2–MgO–FeO–Fe2O3–P2O5 slags with the assumption that the content of Fe2O3 equal to zero. However, the major aim of this study is to represent an investigation of true characteristics of dephosphorization in CaO–SiO2–MgO–FeO–Fe2O3–P2O5 slags. Hence, only the reported data of CaO–SiO2–MgO–FeO–Fe2O3–P2O5 slags by Nagabayashi et al.13) was taken into consideration for representation of reaction abilities of structure units in the following sections.
In view of the fact that there are ions and molecules in molten metallurgical slags simultaneously,13,14,15,16,17,18,19,22) the main viewpoints of the ion and molecule coexistence theory of slag structures in the developed thermodynamic model can be simply summarized as follows: 1) Molten slags of CaO–SiO2–MgO–FeO–Fe2O3–P2O5 are composed of Ca2+, Mg2+, Fe2+, and O2− as simple ions, SiO2 and P2O5 as simple molecules, silicates, aluminates as complex molecules. Each structural unit has its independent position in the slags. Every cation and anion generated from the same component will take part in reactions of forming complex molecules in the form of ion couple as (Me2++O2−). 2) Reactions of forming complex molecules are under chemically dynamic equilibrium between bonded ion couples from simple ions and simple molecules. 3) Structural units in the selected slags equilibrated with liquid iron bear continuity in the range of investigated concentration range. 4) Chemical reactions of forming complex molecules obey the mass action law.
2.2. Model for Calculating Mass Action Concentrations of Structural Units in CaO–SiO2–MgO–FeO–Fe2O3–P2O5 Slags 2.2.1. Structural Units in CaO–SiO2–MgO–FeO–Fe2O3–P2O5 SlagsAccording to traditional metallurgical physicochemistry, CaO–SiO2–MgO–FeO–Fe2O3–P2O5 slags is composed of CaO, SiO2, MgO, FeO, Fe2O3 and P2O5, while the extracted phosphorus gradually enter into the slags with the proceeding of dephosphorization reactions until dephosphorization reactions reach equilibrium. However, the IMCT14,15,16,17,18,19,20,23) suggests that the extracted phosphorus from liquid iron into the slags exists as P2O5 can be bonded with ion couples (Fe2++O2−), (Ca2++O2−) and (Mg2++O2−) to form molecules as P2O5, 3FeO·P2O5, 4FeO·P2O5, 2CaO·P2O5, 3CaO·P2O5, 4CaO·P2O5, 2MgO·P2O5, and 3MgO·P2O5 in oxidizing slags containing iron oxides FetO, respectively.
In view of the reported binary and ternary phase diagrams20,21) of CaO–SiO2 slags, CaO–P2O5 slags, FeO–P2O5 slags, MgO–P2O5 slags, CaO–MgO slags, CaO–MgO–SiO2 slags, MgO–SiO2 slags, and CaO–FeO–SiO2 slags in a temperature range from 1673 K to 1986 K, about 20 kinds of complex molecules can be formed in the slags as listed in Table 1.
;%0A%09%09%09newWindow.document.open();%0A%09%09%09newWindow.document.write('<img src=%22./Graphics/54_756_tbl_1.jpg%22>');%0A%09%09%09newWindow.document.close();%0A%09%09)
|
The mole number of above–mentioned six components, such as CaO, SiO2, MgO, FeO, Fe2O3 and P2O5 in 100 g of CaO–SiO2–MgO–FeO–Fe2O3–P2O5 slags is assigned as b1 =
| (1) |
With respect to the definition of mass action concentrations14,15,16,17,18,19,20,23) Ni for structural units, which is a ratio of equilibrium mole number of structural units i to the total equilibrium mole numbers of all structural units in a close system with a fixed amount, Ni of structural units i and ion couples (Me2++O2−) in molten slags can be calculated by
| (2a) |
| (2b) |
All definitions of Ni for formed ion couples from simple ions, simple and complex molecules in CaO–SiO2–MgO–FeO–Fe2O3–P2O5 slags were listed in Table 1. Meanwhile, it should be pointed out that the physicochemistry meaning of Ni is almost consistent with the traditionally applied activity ai of component i in slags, in which pure matter is chosen as standard state and mole fraction is selected as concentration unit.14,15,16,17,18,19,20,23)
The chemical reaction formulas of 20 kinds of possibly formed complex molecules, their standard molar Gibbs free energy
The mass conservation equations of six components in 100 g of CaO–SiO2–MgO–FeO–Fe2O3–P2O5 slags equilibrated with liquid iron can be established according to the definition14,15,16,17,18,19,20,23) of ni and mass action concentrations Ni of all structural units listed in Table 1 as follows
| (3a) |
| (3b) |
| (3c) |
| (3d) |
| (3e) |
| (3f) |
According to the principle that the sum of mole fraction for all structural units in a fixed amount of CaO–SiO2–MgO–FeO–Fe2O3–P2O5 slags under equilibrium condition is equal to 1.0, the following equation can be obtained
| (4) |
The equation group of Eqs. (3) and (4) is the governing equations of the developed thermodynamic model for calculating mass action concentrations Ni of structural units in CaO–SiO2–MgO–FeO–Fe2O3–P2O5 slags equilibrated with liquid iron. Obviously, there are seven unknown parameters as N1, N2, N3, N4, N5, N6 and Σni with 7 independent equations in the developed equation group of Eqs. (3) and (4). The unique solution of Ni, Σni and ni can be calculated by solving these algebraic equation group of Eqs. (3) and (4) by combining with the definition of Ni in Eq. (2).
2.3. Definition of Mass Action Concentration for Iron Oxides FetO in the CaO–SiO2–MgO–FeO–Fe2O3–P2O5 SlagsIt’s well-known that high oxygen potential and basicity of the slags are needed to remove phosphorus from steel melts. In this study, the mass action concentration of iron oxides FetO, i.e.,
The IMCT14,15,16,17,18,19,20,23) proposed that all iron oxides in metallurgical slags are composed of ion couple (Fe2++O2−), simple molecule Fe2O3 and complex molecule FeO·Fe2O3, therefore, the related structural units of iron oxides can dynamically equilibrate among those structural units as follows
| (5a) |
| (5b) |
Obviously, when the reactions of Eqs. (5a) and (5b) reach equilibrium, increase of single molcule of Fe2O3 will lead to the changing of balance with increase of one third ion couple since the equilibirum constant is kept constant. Therefore, the mass action concentration of free ion couple (Fe2++O2−) can directly represent present slag oxidization ability. Meanwhile, it should be pointed out that the symbol of
| (6) |
According to IMCT, the defined
| (7a) 22) |
| (7b) |
| (8) |
The relationship between mass percentage of CaO, SiO2, MgO, FeO, Fe2O3 and P2O5 as components and the calculated mass action concentrations Ni of structural units, i.e., (Ca2++O2−), SiO2, (Mg2++O2−), (Fe2++O2−), Fe2O3 and P2O5, in CaO–SiO2–MgO–FeO–Fe2O3–P2O5 slags in a temperature range from 1823 K to 1923 K was shown in Fig. 1, respectively. The good scatter linear relationship can be observed for (Ca2++O2−), SiO2, (Mg2++O2−), (Fe2++O2−) and Fe2O3 as components in Figs. 1(a), 1(b), 1(c), 1(d) and 1(e). The scatter corresponding relationship can be found for P2O5 in Fig. 1(f). The good scatter linear relationship for (Ca2++O2−), SiO2, (Mg2++O2−), (Fe2++O2−) and Fe2O3 can be explained as follows 1) some basic oxides such as (Ca2++O2−) and (Mg2++O2−) can react with SiO2 to form complex molecules 3CaO·SiO2, 2CaO·SiO2, CaO·SiO2, 2MgO·SiO2, MgO·SiO2, CaO·MgO·2SiO2, 2CaO·MgO·2SiO2 and 3CaO·MgO·2SiO2 as shown in Table 1; 2) (Fe2++O2−) and Fe2O3 can also be consumed as iron oxides in the process of dephosphorization.

Relationship between mass percent of CaO, SiO2, MgO, FeO, Fe2O3 and P2O5 as components and calculated mass action concentrations of (Ca2++O2−), SiO2, (Mg2++O2−), (Fe2++O2−), Fe2O3 and P2O5 as structural units in 100 g CaO–SiO2–MgO–FeO–Fe2O3–P2O5 slags equilibrated with liquid iron at elevated temperatures, respectively.
The relationship between mass percentage of CaO, SiO2, MgO, FeO, Fe2O3 and P2O5 as components and the calculated equilibrium mole numbers ni of structural units, i.e., (Ca2++O2−), SiO2, (Mg2++O2−), (Fe2++O2−), Fe2O3 and P2O5, in CaO–SiO2–MgO–FeO–Fe2O3–P2O5 slags in a temperature range from 1823 K to 1923 K was illustrated in Fig. 2, respectively. Obviously, the calculated equilibrium mole numbers ni of all 6 structural units have some relation with mass percentage of the corresponding components. The good linear relationship can be found for SiO2 and FeO in Figs. 2(b) and 2(d), this phenomenon can be explained as that not so many molecules of SiO2 or FeO can be bounded to form complex molecules. The scatter relationship can be observed for (Ca2++O2−), (Mg2++O2−), Fe2O3 and P2O5 as components in Figs. 2(a), 2(c), 2(e) and 2(f). However, a linear relationship can be correlated for (Ca2++O2−), (Mg2++O2−), Fe2O3 and P2O5 in Figs. 2(a), 2(c), 2(e) and 2(f) although some mass of above mentioned components can be found as various complex molecules. Therefore, the calculated equilibrium mole number ni of structural units in CaO–SiO2–MgO–FeO–Fe2O3–P2O5 slags can be applied to represent chemical composition of the slags.14,15,16,17,18,19,20,23)

Relationship between mass percent of CaO, SiO2, MgO, FeO, Fe2O3 and P2O5 as components and calculated equilibrium mole numbers of (Ca2++O2−), SiO2, (Mg2++O2−), (Fe2++O2−), Fe2O3 and P2O5 as structural units in 100 g CaO–SiO2–MgO–FeO–Fe2O3–P2O5 slags equilibrated with liquid iron at elevated temperatures, respectively.
The relationship between the calculated equilibrium mole numbers ni and simple binary basicity R of slags, i.e., ((%CaO)/(%SiO2)) was illustrated in Fig. 3. Total equilibrium mole number Σni has a very good linear relationship with simple binary basicity R of slags, i.e., ((%CaO)/(%SiO2)). The formula of equilibrium mole number Σni against the simple binary basicity R of slags can be regressed as Σni = 2.604–3.029*exp(–R/2.339), and the fitting degree is 0.995. This reliable fitting degree results suggest that changing the simple binary basicity R of slags have a large effect on Σni.

Relationship between binary basicity R and calculated total equilibrium mole number of structural units Σni in 100 g CaO–SiO2–MgO–FeO–Fe2O3–P2O5 slags equilibrated with liquid iron at elevated temperatures.
According to the ion and molecule coexistence theory that only free ion couples (Ca2++O2−), and (Mg2++O2−), which can be combined with iron oxides FetO in CaO–SiO2–MgO–FeO–Fe2O3–P2O5 slags, can take roles in dephosphorization reactions in terms of forming 8 dephosphorization molecules as P2O5, 3FeO·P2O5, 4FeO·P2O5, 2CaO·P2O5, 3CaO·P2O5, 4CaO·P2O5, 2MgO·P2O5 and 3MgO·P2O5 according to IMCT14,15,16,17,18,19,20,23) as follows
| (9a) |
| (9b) |
| (9c) |
| (9d) |
| (9e) |
| (9f) |
| (9g) |
| (9h) |
The corresponding equilibrium constants of Eq. (9) can be expressed according to IMCT14,15,16,17,18,19,20,23) as
| (10a) |
| (10b) |
| (10c) |
| (10d) |
| (10e) |
| (10f) |
| (10g) |
| (10h) |
| (11a) |
| (11b) |
| (11c) |
| (11d) |
| (11e) |
| (11f) |
| (11g) |
| (11h) |
| (12a) |
| (12b) |
| (13) |
Therefore, the developed LP prediction model by
| Dephosphorization reactions | Resource reactions |
|
|---|---|---|
| 2[P]+5(FetO)=(P2O5)+5t[Fe] |
| –157700+5.4T30) |
|
| –117110–3.39T30) | |
| 2[P]+5[O]=(P2O5)(l) | –702912+556.472T31) | |
| P2+
| –1603862+550.322T30,31) | |
| t[Fe]+[O]=(FetO) | –116100+48.79T32) | |
| 2[P]+5(FetO)+3(Fe2++O2−)=(3FeO·P2O5)+5t[Fe] | 3(FeO)+(P2O5)=(3FeO·P2O5) | –430404+92.708T9) |
| 2[P]+5(FetO)=(P2O5)+5t[Fe] | –122412+312.522T | |
| 2[P]+5(FetO)+4(Fe2++O2−)=(4FeO·P2O5)+5t[Fe] | 4(Fe2++O2−)+(P2O5)=(4FeO·P2O5) | –381831+47.367T9) |
| 2[P]+5(FetO)=(P2O5)+5t[Fe] | –122412+312.522T | |
| 2[P]+5(FetO)+2(Ca2++O2−)=(2CaO·P2O5)+5t[Fe] | 2(CaO)+P2+
| –2189069+585.76T33) |
| (2CaO·P2O5)(s)= (2CaO·P2O5)(l) | 100834.4–62.0069T16) | |
| P2+
| –1603862+550.322T30,31) | |
| 2[P]+5(FetO)=(P2O5)+5t[Fe] | –122412+312.522T | |
| 2[P]+5(FetO)+3(Ca2++O2−)=(3CaO·P2O5)+5t[Fe] | 3(CaO)+P2+
| –2313752+556.472T33) |
| P2+
| –1603862+550.322T30,31) | |
| 2[P]+5(FetO)=(P2O5)+5t[Fe] | –122412+312.522T | |
| 2[P]+5(FetO)+4(Ca2++O2−)=(4CaO·P2O5)+5t[Fe] | 4(CaO)+(P2O5)(l)=(4CaO·P2O5)(l) | –661356–3.473T34) |
| 2[P]+5(FetO)=(P2O5)+5t[Fe] | –122412+312.522T | |
| 2[P]+5(FetO)+2(Mg2++O2−)=(2MgO·P2O5)+5t[Fe] | 2(Mg2++O2-)+(P2O5)=(2MgO·P2O5) | 168369–339.357T9) |
| 2[P]+5(FetO)=(P2O5)+5t[Fe] | –122412+312.522T | |
| 2[P]+5(FetO)+3(Mg2++O2−)=(3MgO·P2O5)+5t[Fe] | 3(MgO)+P2+
| –1992839+510.0296T33) |
| (3MgO·P2O5)(s)= (3MgO·P2O5)(l) | 121336–74.8936T32) | |
| P2+
| –1603862+550.322T30,31) | |
| 2[P]+5(FetO)=(P2O5)+5t[Fe] | –122412+312.522T |
In order to examine the applicability of the IMCT−LP model developed in the present study based on the ion and molecule coexistence theory, both methods have been adopted to evaluate the accuracy of the calculated
The comparisons between the measured phosphorous distribution LP, measured for CaO–SiO2–MgO–FeO–P2O5 slags equilibrated with liquid iron at 1873 K and 1923 K reported by Basu et al.10) or the measured phosphorous distribution LP, measured for the CaO–SiO2–MgO–FeO–Fe2O3–P2O5 slags at 1823 K, 1873 K and 1923 K reported by Nagabayashi et al.13) and the calculated phosphorous distribution

As shown in Fig. 4, an excellent 1:1 agreement between phosphorous distribution lg LP, measured reported by Basu et al.10) and
The comparisons between the measured LP, measured and calculated
;%0A%09%09%09newWindow.document.open();%0A%09%09%09newWindow.document.write('<img src=%22./Graphics/54_756_tbl_3.jpg%22>');%0A%09%09%09newWindow.document.close();%0A%09%09)
|

Comparison between the measured phosphorus distribution lg LP, measured by previous literatures10,13) and the calculated phosphorus distribution
It should be specially emphasized that the calculated
The influence of the calculated mass action concentrations of components upon lg LP, measured or

Effect of calculated mass action concentrations of ion couples or simple molecules of (Ca2++O2−), SiO2, (Mg2++O2−), (Fe2++O2−), and Fe2O3 on lg LP, measured and
There are some extreme proofs to support this results as follows: 1) A slags with high iron oxides but very low CaO, which is applied in desiliconization pretreatment of liquid iron, can only extract silicon but not phosphorus; 2) A slags with high CaO but very low FetO, which is applied at reduction period during electric arc furnace steelmaking process, can only extract sulfur but not phosphorus. Therefore, the comprehensive effect of basic components, especially CaO and FetO, can make the main controlling contribution to dephosphorization in the slags.
5.4. Relationship between Slag Basicity and lg LP, measured orNo Al2O3 exists in the selected slags, the commonly applied complex basicity ((%CaO)+1.4(%MgO)/(%SiO2)+ (%P2O5)+/(%Al2O3))22) can be simplified as ((%CaO)+ 1.4(%MgO)/(%SiO2)+(%P2O5)). The relationship between lg LP, measured or
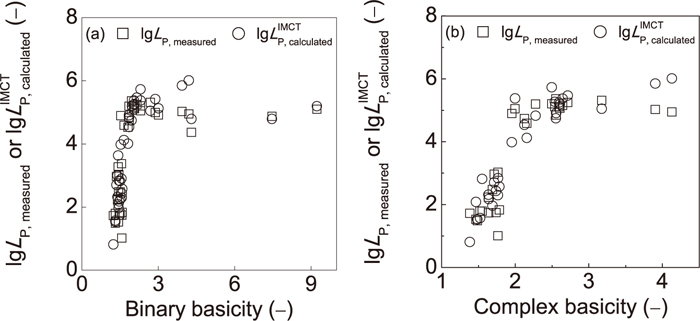
Effects of binary basicity (%CaO)/(%SiO2) (a) and complex basicity ((%CaO)+1.4(%MgO)/(%SiO2)+(%P2O5)) (b) on lg LP, measured and
According to IMCT,14,15,16,17,18,19,20,23) the structural unit P2O5 is generated from FetO in the slags or [O] in liquid iron, meanwhile, three components as CaO, MgO, and FeO in the slags can react with P2O5 to generate 3FeO·P2O5, 4FeO·P2O5, 2CaO·P2O5, 3CaO·P2O5, 4CaO·P2O5, 2MgO·P2O5, and 3MgO·P2O5 as complex molecules. As shown in Eq. (11), the respective phosphorus distribution LP, i of above-mentioned eight molecules can be calculated from the developed IMCT−LP model.
The relationship between the calculated respective phosphorus distribution

Contribution of 8 structural units containing P2O5 in CaO–SiO2–MgO–FeO–Fe2O3–P2O5 slags to the total dephosphorization ability (a), and the relationship between
Since 3CaO·P2O5 made the main contribution to dephosphorizaiton in CaO–SiO2–MgO–FeO–Fe2O3–P2O5 slags, and the 1:1 corresponding relationship between
A thermodynamic model for calculating phosphate distribution between CaO−SiO2−MgO−FeO−Fe2O3−P2O5 slags and liquid iron, i.e., IMCT−LP model, has been developed coupled with a developed thermodynamic model for calculating mass action concentrations of structural units, i.e., IMCT−Ni model, based on ion and molecule coexistence theory. The main information can be summarized as follows:
(1) The calculated results from IMCT−Ni model shows that the calculated mass action concentrations of structural units, rather than mass percentage of components, are recommended to represent reaction ability of components in CaO–SiO2–MgO–FeO–Fe2O3–P2O5 slags. Simple binary basicity R of slags have a large effect on total equilibrium mole number Σni of structural units in CaO–SiO2–MgO–FeO–Fe2O3–P2O5 slags, the formula of total equilibrium mole number Σni against the simple binary basicity R of slags can be regressed as Σni = 2.604–3.029*exp(–R/2.339), and the fitting degree is 0.995.
(2) The developed IMCT–LP prediction model can be applied to reliably predict the phosphorous distribution LP of CaO–SiO2–MgO–FeO–Fe2O3–P2O5 slags equilibrated with liquid iron. Meanwhile, some other phosphorous distribution prediction models have also been taken into consideration for calculating phosphate distribution between CaO–SiO2−MgO−FeO−Fe2O3−P2O5 slags and liquid iron, and the results shows that IMCT−LP model have more accuracy compared with other phosphorous distribution prediction models.
(3) The developed IMCT−LP model can quantitatively calculate the respective contribution of FetO, CaO+FetO and MgO+FetO in the slags. A significant difference of dephosphorziation abilities among FetO, CaO+FetO and MgO+FetO can be found as approximately 0.00%, 99.98%, 0.01%. Meanwhile, the phosphorus in liquid iron can be effectively extracted by CaO+FetO in slags to form complex molecules 3CaO·P2O5 which made the main contribution to dephosphorizaiton in CaO–SiO2–MgO–FeO–Fe2O3–P2O5 slags.
A: Constant, (–);
ai: Activity of components i in liquid iron or in slags, (–);
B: Constant, (–);
bi: Mole number of component i in 100 g slags, (mol);
fi: Activity coefficient of component i in liquid iron, (–);
(%i): Mass percentage of component i in the slags, (mass%);
[%i]: Mass percentage of component i in liquid iron, (mass%);
LP: Phosphorus distribution between slags and liquid iron, (–);
LP, i: Calculated respective phosphorus distribution of generated structural unit i containing P2O5 in slags based on slag oxidization ability by IMCT model, (–);
LP, measured: Measured phosphorus distribution, (–);
Me: Metal, (–);
MeO: Oxide component in slags, (–);
Mi: Molecular mass of element i or component i, (g/mol);
ni: Equilibrium mole number of structural unit i in 100 g slags, (mol);
Ni: Mass action concentrations of structural unit i in the slags, (–);
Σni: Total equilibrium mole number of all structural units in 100 g slags, (mol);
R: simple binary basicity, (–);
R: Gas constant, (8.314 J/(mol⋅K));
T: Absolute temperature, (K);
Subscripts
ci: Complex molecule i, (–);