Regular Article
Re-Oxidation Kinetics of Flash Reduced Iron Particles in O2–N2 Gas Mixtures Relevant to a Novel Flash Ironmaking Process
2014 Volume 54 Issue 6 Pages 1235-1243
Details
2014 Volume 54 Issue 6 Pages 1235-1243
A novel flash ironmaking process based on hydrogen-containing reduction gases is under development at the University of Utah. This process will directly reduce fine iron oxide concentrate particles in suspension in a flash reactor. During handling and transportation, product iron particles may come into contact with air. Since direct reduced iron is usually prone to oxidation, re-oxidation kinetics is of concern. The goal of this work was to determine the re-oxidation kinetics of flash reduced iron particles in O2–N2 gas mixtures. The effects of temperature (673 – 873 K) and O2 partial pressure (4 – 18 kPa) were studied and the nucleation and growth model was found to describe the initial period of oxidation before the rate decreased precipitously at certain conversion. The pressure dependence of the rate was first order with respect to oxygen partial pressure, and the activation energy was 14.4 kJ/mol. A complete rate equation that adequately represents the experimental data was developed.
A novel flash ironmaking process is currently under development at the University of Utah as a promising alternative ironmaking process that would greatly reduce CO2 emissions and energy requirement compared with blast furnace ironmaking.1,2,3) In this process, pure H2, or H2-containing gases such as natural gas or syngas3) is used to directly reduce fine iron ore concentrate particles in suspension at 1500 – 1900 K. The re-oxidation kinetics of iron particles in H2–H2O under various conditions was investigated.4) The product iron particles form the novel flash ironmaking process may come into contact with air at moderate temperatures during handling and transportation. Since fresh direct reduced iron from most conventional processes is usually reactive and may even ignite spontaneously due to the exothermic oxidation reaction,5) re-oxidation kinetics of flash reduced iron particles in O2–N2 gas mixtures is of interest.
El-Geassy et al.6) studied the kinetics and mechanism of the re-oxidation of freshly reduced iron compacts in dry air at 473 – 1073 K. Sponge iron compacts were produced by the reduction of iron ore compacts with hydrogen at 1273 K. It was found that the initial stage of re-oxidation followed a linear rate equation, suggesting a rate-controlling mechanism of interfacial chemical reaction. At the intermediate re-oxidation stages, the rate was represented by a parabolic expression, indicating a solid-state diffusion rate-controlling mechanism. And the rate-controlling step at the last stage of re-oxidation was solid-state diffusion in which voids formed at the interfaces between the oxide films and unreacted iron grains, with the rate following a logarithmic expression indicative of the formation of protective oxide layer. Bandopadhyay et al.7,8,9,10) performed thermogravimetric studies on the isothermal re-oxidation of direct reduced iron in dry air at 720 – 870 K. Sponge iron samples in small pieces of about 500 mg each were produced by coal reduction in a rotary kiln. Passivation was observed at the later stages of re-oxidation and was believed to be caused by the pore blockage resulting from the formation of iron oxide. The re-oxidation rate was determined to follow a first order law.
The literature survey revealed that most previous studies were done using direct reduced iron (DRI) pellets or briquettes and DRI samples were produced by coal or natural gas at temperatures lower than 1273 K, which are much lower than the proposed temperature range of 1500 – 1900 K in the novel flash ironmaking process. Moreover, there are no re-oxidation data for iron in the form of fine particles, which have very different morphologies than pellets. Therefore, it is necessary to examine the re-oxidation kinetics of flash reduced iron particles in conditions relevant to the novel ironmaking process. References discussed above have shown DRI of large specific surface area, typically around 1000 m2/kg, can be reoxidized in air quite rapidly.6,7,11) Although flash reduced iron has a lower specific surface area, 195 m2/kg (measured by Micromeritics ASAP 2020 in this work), because the process uses a higher reduction temperature than in typical direct reduction processes, the possibility of its re-oxidation must be addressed.
In this research, re-oxidation of flash reduced iron in O2–N2 gas mixtures was carried out in the temperature range of 673 – 873 K (400 – 600°C) and O2 concentrations of 5 – 21%. to determine the dependence of re-oxidation rate on the partial pressure of O2 (the atmospheric pressure in Salt Lake City = 86.1 kPa).
A typical thermogravimetric analysis (TGA) unit, shown in Fig. 1, was used to measure the oxidation rates in O2–N2 gas mixtures. The system consisted of a vertical high temperature furnace and a Cahn balance (model D-101, 1 μg sensitivity), which continuously recorded the weight change during the experiment. Temperature in the furnace was maintained stable by an external power controller and was monitored by calibrated K-type thermocouples. In order to eliminate the mass transfer effect from the bulk gas to the particle surface, the sample particles were sprinkled thinly on top of a kaowool bed packed to close to the top of a cylindrical sample holder (2 cm inner diameter), held in a basket made of a chromel wire (resistant to high temperature oxidation and corrosion) and suspended by a platinum wire from one arm of the Cahn electrobalance. The basket was located in a tubular quartz reactor (4.2 cm inner diameter and 111 cm length). Blank experiments with O2 and N2 indicated that weight changes in the kaowool and sample holder before and after heating were negligible. It has been verified that in the experiment the kaowool bed was compact enough that the iron particles can stay on it without falling into the gaps in the kaowool.

Schematic diagram of the TGA system.
Iron ore concentrate from ArcelorMittal (East Chicago, Indiana, USA) was used as the raw material to produce metallic iron particles at 1623 K (1350°C) in a drop tube reactor, as described elsewhere.12,13) The chemical composition of the concentrate is presented in Table 1. The iron particles used in the re-oxidation experiments had a metallization degree higher than 93%. Figure 2 is the XRD pattern of reduced iron particles, showing only iron and impurity silica phases. Figure 3 shows typical iron particles and the particle size distribution from SEM analysis.4) Iron particles were spread loosely on carbon tape so that individual particles were isolated from each other and SEM micrographs were taken. An image processing and analysis software “IMAGE J” was used to analyze the SEM pictures, which measured the projected area of the particles and back calculated the average diameter of iron particles with the assumption that these irregular particles were spherical. The analyzed SEM pictures contained around 500 particles, and the size distribution was over a 3 μm interval. The measured sizes of individual particles were converted to the volume (or mass assuming uniform density) fraction vs size plot in Fig. 3. The arithmetic mean size was 17.5 μm and the volume mean (or mass mean, assuming uniform density) particle size was 29.1 μm.
| Component | Wt.% |
|---|---|
| Total Fe | 68.2 |
| FeO | 28.2 |
| SiO2 | 4.3 |
| CaO | 0.19 |
| MgO | 0.29 |
| Al2O3 | 0.061 |
| TiO2 | 0.021 |
| MnO | 0.021 |
| Na2O | 0.011 |
| K2O | 0.044 |
| P | 0.014 |
| S | 0.0005 |
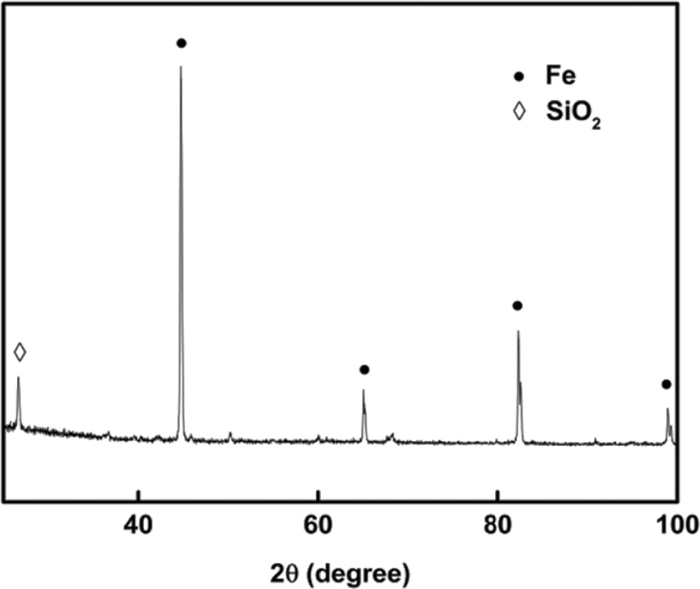
X-ray diffraction pattern of reduced iron particles, 96% reduction degree at 1623 K (1350°C) (Ordinate in arbitrary unit).

Particle size distribution of iron particles used in the re-oxidation experiments.
Iron particles were produced by reducing fine magnetite concentrate particles with hydrogen in a drop tube reactor at 1623 K (1350°C), the reactions taking place in suspension. The reduced iron particles were analyzed by titration to obtain the composition.14) About 120 mg of these iron particles were sprinkled thinly on top of the kaowool bed in a cylindrical sample holder in order to eliminate the inter-particle diffusion effect of the reactant gas and thus determine the true particle reaction kinetics. The elimination of any diffusional and external mass transfer effects was proved experimentally as described subsequently where experimental results are discussed. This configuration also served the purpose of rapidly dispersing the heat of reaction so that the difference in the temperature of the solid and the measured temperature of the adjacent gas was negligible.
The sample holder was then loaded in the chromel basket and suspended in the quartz tube by the platinum wire. The system was then heated to the experimental temperature in argon atmosphere with a heating rate of 2 K/s. Little morphological changes were expected during the few minutes of heat up time because the iron was produced at a much higher temperature than during the heat up. N2–O2 gas mixtures were introduced to the system by switching the four-way valve to start the experiment. The temperature stayed constant at experimental temperature during the course of experiments. Once the experiment was finished, the reactive gases were shut off and argon was flowed to purge the system, and the sample holder was unloaded to cool in a closed dry container. The weight gain caused by re-oxidation was then recorded. Weight changes related to the volatile components such as sulfur and phosphorus were negligible because of their small contents, as presented in Table 1, which was further confirmed by the negligible weight loss after heating the starting sample in an inert atmosphere. Microstructures of the samples were examined by an FEI NanoNova Scanning Electron Microscope (SEM) (Hillsboro, Oregon), with high-resolution mode (immersion mode) off, because the powerful magnetic field at the end of the SEM column can lift a lump of magnetic iron particles and cause it to crash into the SEM column. A TOPCON SM-300 SEM (Oakland, New Jersey) was also employed for some microstructure analysis. XRD analysis was carried out with a Philips X’pert X-ray diffractometer with a 40 kV Cu–Kα source.
2.4. Definitions of ParametersIn this study re-oxidation degree was defined by the fractional oxygen content relative to Fe2O3, given by:4)
| (1) |
| (2) |
| (3) |

X-ray diffraction pattern of oxidized iron particles,
With this definition, F does not necessarily start from zero and a direct comparison can be made between the re-oxidation rates of samples containing different initial levels of oxygen. In this research, however, the initial oxygen contents of the starting samples were relatively small and this distinction had only a small effect.
In order to eliminate the external mass transfer effect of reactant gas molecules, different flow rates of gas mixture were tested at 973 K (700°C) on the iron particles reduced by H2 at 1073 K (800°C) with a fixed sample size of 120 ± 3 mg. This type of iron particles was selected because it has the highest specific surface area, 457 m2/kg, compared with iron particles flash-reduced by H2 at 1623 K (1350°C), 195 m2/kg, and thus is the most reactive. Therefore, if mass transfer effect is removed for this sample, experiments with other less reactive iron particles are free from mass transfer effect. As seen in Fig. 5, the reaction rate remained independent of gas flow rate above 1.36 NL/min. And the highest gas mixture flow rate 1.75 NL/min was used in the subsequent runs to ensure the complete removal of external mass transfer effect.

Effect of gas flow rate on the re-oxidation rate at 973 K (700°C),
The effect of inter-particle diffusion of gaseous species was eliminated by using a thin sample layer with loosely packed particles. The area and thickness of iron particles layer were, respectively, 3.14 cm2 and 1 mm. Calculations (see Section 3.8) showed that at 873 K (600°C) with 21% O2 the re-oxidation would reach completion in 7.3 seconds when the thickness of sample layer was 1 mm if the reaction was under the control inter-particle diffusion.15) However, the experimental rates were at least an order of magnitude slower at the upper range of temperatures tested, indicating that the reaction was not affected by inter-particle diffusion.
Mass transfer and heat transfer are closely related and the elimination of mass transfer effects also removes the effect of heat transfer, which allows the temperature of the solid and the gas to be the same. In fact, heat can be conducted through the solid phase whereas diffusion can only occur through the pore space. Thus, the sample configuration used in this work also served the purpose of rapidly dispersing the heat of reaction so that the difference in the temperature of the solid and the measured temperature of the adjacent gas was negligible.
3.2. Effects on Re-oxidation of the Reduction Temperature during the Preparation of Iron ParticlesThe proposed temperature range in the novel flash ironmaking process is 1500 – 1900 K, much higher than in typical direct reduction processes.5) Thus it is of interest to examine the differences of oxidation rates between the flash reduced iron particles and the conventional direct reduced iron particles. Fine magnetite concentrate was reduced by H2 at 1073 K (800°C) in a horizontal furnace to produce iron particles under the conditions of typical conventional direct reduction processes. The re-oxidation rate of these iron particles in O2–N2 was compared with that of the flash reduced iron particles produced at 1623 K (1350°C). The results in Fig. 6 show that flash reduced iron particles are much more resistant to oxidation. This is due to the lower specific surface area of iron particles produced at higher temperatures of the novel flash ironmaking process. Data obtained with the MICROMERITICS ASAP 2020 indicated a specific surface area of 195 m2/kg for flash reduced iron produced at 1623 K (1350°C), whereas that of iron particles reduced by H2 at 1073 K (800°C) was 457 m2/kg. SEM micrographs of both types of iron particles in Fig. 7 clearly show that iron particles produced at 1623 K (1350°C) are more rounded, thus less reactive in oxidation.

Comparison of re-oxidation rates of iron particles reduced at different temperatures; 873 K (600°C),

Comparison of microstructures of different iron particles: a) flash reduced iron produced at 1623 K (1350°C); b) H2-reduced iron at 1073 K (800°C).
Different O2 concentrations were used in the mixture of N2 and O2 to study the dependence of re-oxidation rate on O2 partial pressure. As O2 concentration decreased from 21% to 5% at 873 K (600°C), the re-oxidation rate became slower as shown in Fig. 8 (ptotal = 86.1 kPa). The quantitative data was subsequently used to determine the reaction order with respect to oxygen partial pressure.

Effect of O2 partial pressure on re-oxidation rate at 873 K (600°C), Ptotal = 86.1 kPa (atmospheric pressure in Salt Lake City).
Re-oxidation of flash reduced iron was conducted at temperatures of 673 – 873 K (400 – 600°C) with gas flow rate of 1.75 NL/min. Figure 9 shows the reaction rates quickly level off at a low extent, much faster than that in water vapor observed in a previous study.4) Experiments were also conducted at lower temperatures of 473 K (200°C) and 573 K (300°C); however, the reaction rate was too slow to be measured in the available TGA system. This also implies iron particles produced in the novel flash ironmaking process are resistant to oxidation at moderately low temperatures, due to its low specific surface area. On the contrary, typical sponge iron compacts produced by reduction of iron ore compacts with hydrogen at 1273 K can reach 45% re-oxidation within just 10 minutes at 498 K (225°C).6)

Effect of temperature on re-oxidation rate;
SEM pictures in Fig. 10 show the microstructures of starting iron particles and oxygen-oxidized samples. Gas-solid reactions usually involve the adsorption of gaseous reactants at preferred sites on the solid surface and the formation of nuclei of the solid product. And for small particles the period of the formation and growth of the nuclei occupies essentially the entire conversion range.16) It was also reported17) that the oxidation of iron in oxygen starts as nucleation of iron oxides occurs on the surface of iron. Therefore, the nucleation and growth model expressed in Eq. (4)18) was employed to fit the oxidation data till the level-off point.
| (4) |
| (5) |

SEM micrographs of a) starting iron particle; b) oxidized iron, F = 0.47 at 873 K (600°C).
Figures 11 and 12 show that all data can be fitted very well by plotting
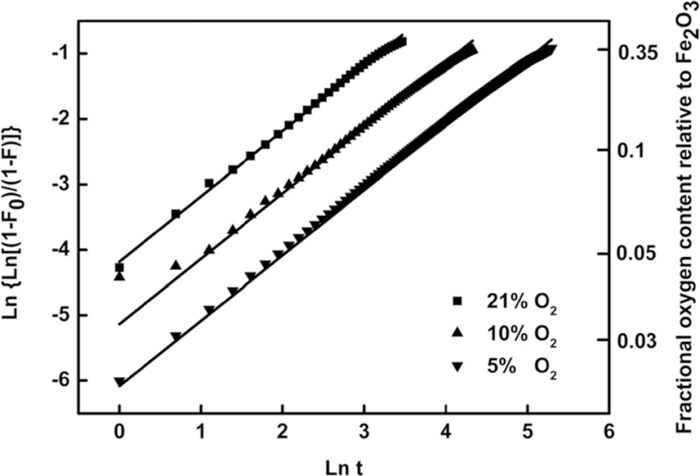
Relationship between

Relationship between
At the last stage, the rate becomes almost flat, probably due to the formation of dense non-porous oxide layer causing a blockage of the surface. A close-up of the microstructure of oxidized iron particles reveals the dense oxide layer on the surface in Fig. 13. Oxidation of iron in oxygen is strongly exothermic compared with that in water vapor, as indicated below at 873:
| (6) |
| (7) |

SEM micrographs of a) oxidized iron, F = 0.36 at 873 K (600°C); b) oxidized iron, F = 0.47 at 873 K (600°C).
Therefore, it is believed that the strong reaction heat results in local fusion, causing the rounding of surface morphology and impeding the diffusion of reactant oxygen, which may explain the difference of oxidation rate in this study and a previous investigation of flash reduced iron oxidation in water vapor.4)
3.5. Determination of Reaction Order with Respect to Oxygen Partial PressureThe reaction in consideration is
| (8) |
| (9) |

Relationship between kapp and
From Eq. (5) the rate constant k is obtained and the activation energy of the re-oxidation reaction was obtained through the Arrhenius equation as 14.4 kJ/mol in Fig. 15.
| (10) |
| (11) |
| (12) |
| (13) |

Arrhenius plot between Ln k (k in s–1 · kPa–1) and 104/T.
For the re-oxidation until the level-off point, the relationship between the fractional oxygen content and the time is formulated by combining Eqs. (4), (5), (9), and (13) as,
| (14) |
After the level off point, the rate becomes essentially zero, based on Figs. 8 and 9, and the leveled off F values are related to temperature as shown in Fig. 16 and given by the following:
| (15) |

Relationship between leveled-off F and temperature.
Therefore, the complete rate equation for re-oxidation of flash reduced iron particles in O2–N2 gas mixtures is
| (16) |

Comparison between the calculated and experimental F vs. time,

Comparison between the calculated F vs. time and experimental F vs. time, 873 K (600°C), Ptotal = 86.1 kPa (atmospheric pressure in Salt Lake City).
Whether interparticle diffusion has a significant effect on the overall rate of a gas-solid can be assessed by comparing the diffusion controlled rate with the experimentally observed rate. In the reaction investigated in this work, oxygen diffuses through a porous layer of iron particles and undergoes the following reaction:
| (17) |
The relationship between conversion and time under interparticle diffusion control in a flat geometry is given by15)
| (18) |
| (19) |
| (20) |
| (21) |
| (22) |
| (23) |
| (24) |
| (25) |
| (26) |
Substitute all known variables to get
| (27) |
| (28) |
A novel flash ironmaking process that directly reduces iron oxide concentrate particles is under development. The re-oxidation kinetics of iron particles in O2–N2 gas mixtures was investigated. The nucleation and growth model was found to satisfactorily describe the re-oxidation, up to a level-off point, of flash reduced iron particles in O2–N2 gas mixture after detailed calculations and microstructure examination of the oxidized samples. The oxidation reaction has first order dependence on the partial pressure of oxygen and the activation energy is 14.4 kJ/mol. Complete rate equations that adequately represent the experimental data were developed. And it was found that flash reduced iron particles are much less vulnerable to oxidation than conventional direct reduced iron particles, because the novel flash ironmaking process uses higher reduction temperatures, leading to lower specific surface area. The findings in the present work indicate that at temperatures lower than 573 K (300°C), iron oxidation is not of great concern. In order to avoid temperature rise due to accumulation of oxidation heat, which will in turn intensify oxidation, however, it is advisable to make briquettes of flash reduced iron particles and prevent contact with air or moisture as much as possible.
The financial support from American Iron and Steel Institute (AISI) through a Research Service Agreement with the University of Utah under AISI’s CO2 Breakthrough Program is acknowledged. This material also contains results of work supported by the U.S. Department of Energy under Award Number DE-EE0005751.
Disclaimer: This report was prepared as an account of work sponsored by an agency of the United States Government. Neither the United States Government nor any agency thereof, nor any of their employees, makes any warranty, express or implied, or assumes any legal liability or responsibility for the accuracy, completeness, or usefulness of any information, apparatus, product, or process disclosed, or represents that its use would not infringe privately owned rights. Reference herein to any specific commercial product, process, or service by trade name, trademark, manufacturer, or otherwise does not necessarily constitute or imply its endorsement, recommendation, or favoring by the United States Government or any agency thereof. The views and opinions of authors expressed herein do not necessarily state or reflect those of the United States Government or any agency thereof.