Abstract
The carburization rate of iron by N2-11 vol% CH4 gas was investigated at 1573 K employing an induction furnace in order to minimize the pre-decomposition of methane. Unlike the carburization of iron by CO or CO+H2 gases, the carburization rate of iron by CH4-containing gas was controlled not by chemical reaction at the surface, but by diffusion of carbon in the liquid phase of Fe–C. The carburization rate by CH4 was about 30 times faster than that by 50 vol% CO. The effects of H2 addition and change in CH4 concentration supported that the chemical reaction do not control the total carburization rate. The formation of graphite rods confirmed that the surface had a very high carbon concentration and the chemical reaction rate is sufficiently fast. Numerical simulation of the carbon diffusion in the spherical iron estimated the diffusivity of carbon ( ) in liquid iron at 1573 K to be 3 × 10⁻⁹ m2/s. In addition, the moving mechanism of liquid/solid interface was schematically proposed.
1. Introduction
Although blast furnace process currently produces most of the world’s iron, numerous metallurgists have been trying to develop the alternative ironmaking processes due to the tightening of environmental regulations including CO2 generation and the depletion of natural resources of highly rising cost. As one of the new ironmaking processes, Shimizu et al.1,2) have suggested the rapid reduction of fine iron ore transported by CH4. They obtained the high carbon concentrations of about 4 mass% by the carburization of the reduced iron shell when using 11 vol% CH4 even though the reaction time was less than 0.5 s. However, they did not clarify the detailed mechanism, and there was no further study about the carburization process. On the other hand, Grabke3) reported that the carbon transfer from CH4 was much slower than that from both CO and H2, which neglected the carbon transfer from CH4 in the carburization by CO–H2O–CO2–CH4 gas mixture.
The main difference among their results lies in the reaction temperature. While the results by Grabke3,4,5) were obtained below 1273 K, Shimizu et al.1,2) performed their experiments around 1573 K. In addition, most of the studies have been done about the carburization of solid iron by CO gas below the eutectic temperature (1426 K) of the Fe–C system,6,7,8) or of molten iron above its melting point (1810 K).9,10) Only few researchers have investigated the carburization in the temperature range of 1426 to 1810 K. Sasaki et al.11) studied the effect of liquid Fe–C phase on the carburization rate by CO at 1523 K. The carburization rate was controlled by the surface chemical Reaction (1) once the liquid Fe–C phase formed:
|
CO(
g
)
+
O
ad
→
CO
2
(
g
)
| (1) |
They derived the weight gain of iron by carburization as represented by
Eq. (2):
|
W
g
=
k
app
⋅
p
co
⋅
t
2/3
| (2) |
Asano et al.12) also studied the carburization of iron by Ar–CO–H2 at 1523 K. They concluded that the addition of H2 to CO could enhance the carburization rate since H2 combines faster with adsorbed oxygen by Reaction (3) than does CO:
|
H
2
(
g
)
+
O
ad
→
H
2
O(
g
)
| (3) |
However, the contribution of H
2 addition to the carburization rate became small after liquid phase was formed since the H
2O produced by Reaction (3) easily reached the equilibrium pressure,
pH
2O
*. Therefore, the carburization rate in CO–H
2 atmosphere can be expressed by
Eq. (4):
|
v=
k
1
pCO
θ
O
+
k
3
p
H
2
θ
O
(
1-
p
H
2
O
p
H
2
O
*
)
| (4) |
where
θO is the fractional coverage by oxygen.
k1 and
k3 are the forward rate constants of Reactions (1) and (3), respectively.
In order to obtain a fast carburization rate even after the liquid phase is formed, the methane (CH4) gas was considered in the present study since CH4 easily decomposes into carbon and hydrogen above 850 K:13)
|
CH
4
(
g
)
→C(
gr
)
+2
H
2
(
g
)
| (5) |
As clearly indicated, the activity of carbon (graphite) in the CH
4-containing gas can be higher than unity at the appropriate ratio of CH
4 to H
2 and at temperatures provided favorable thermodynamic conditions for carburization are satisfied. The current study investigated the carburization of iron by a N
2–CH
4 gas at 1573 K. An induction furnace was employed to minimize the loss of CH
4 by cracking and the restriction in mass transfer. In addition, the migration of liquid Fe–C interface was studied in the progress of carburization.
2. Experimental
2.1. Apparatus
As shown in Fig. 1, an induction furnace with a quartz tube (33 mm-OD, 30 mm-ID, 300 mm-length) was employed for the experiments. Both ends of the quartz tube were fitted with O-ring sealed end caps. The temperature was controlled within the range of ±10 K by adjusting the electrical current of the induction coil and detected by pyrometer. The pyrometer was preliminarily calibrated in the temperature range of 1473 to 1673 K using K-type thermocouple. All the gases used in the current studies were dried by drierite (CaSO4) and deoxidized by passing through a magnesium turnings at 773 K. The flow rates of N2, CH4, CO and H2 gases were controlled using mass flow controllers which were first calibrated by the soap-bubble method.
2.2. Materials Preparation and Procedure
The sample used in the current experiments was prepared in the form of a hemisphere by melting about 0.5 g of electrolytic iron at 1873 K. The electrolytic iron contains the impurities (mass%): O (0.005), C (0.002), S (<0.001), Si (<0.001) and Al (<0.001). The hemispherical iron of 3.1 mm of radius was placed in an alumina crucible (15 mm-OD, 14 mm-ID, 10 mm-height) and the crucible was put into the quartz tube. When the temperature was raised to 1573 K in a N2 atmosphere and maintained for 5 min, the reactive gases were introduced onto the specimen. The experiments were terminated by switching off the electrical current and by stopping the gases and rapidly quenched in Ar gas stream.
The entire sample was provided for the carbon analysis with the inert gas fusion method (LECO). The standard samples containing 2.32 and 3.95 mass% of carbon were used for the calibration of LECO CS-844. The off-gases evolved from the furnace were monitored and analyzed by an infrared gas analyzer (Fuji instrument) in real time. The microstructure and the thickness of liquid phase were observed with an optical microscope and FE-SEM.
3. Results
3.1. Preliminary Experiments
Methane is unstable and easily decomposes into carbon and hydrogen above 850 K.13) Once methane is exposed to high temperatures, it cannot maintain its reducing potential and the activity of carbon in the initially injected gas. As shown in Fig. 2, CH4 easily decomposed into carbon and H2 in the electrical resistance furnace maintaining at 1573 K. That is, less than 1 vol% of CH4 remained in the off gas at 1573 K even with N2-11 vol%CH4 gases in the experiments employing the electrical resistance furnace. This indicates that most of CH4 could not react with the sample and lost its high activity of carbon before it reached the surface of the specimen. However, the induction furnace made it possible to raise the temperature of the iron sample without heating the surrounding atmosphere, which maintained the high activity of carbon in CH4 of the off gas. This means that the high carbon activity of carbon can be used without prior decomposition.

As shown in Fig. 3, the effect of gas flow rate on the carburization rate was preliminarily determined by increasing the flow rates of N2-11 vol% CH4 to 1000 mL/min. The reaction rates were independent of the flow rate above 400 mL/min, thus 800 mL/min was mainly used for the current experiments. The detailed calculation of mass transfer control are presented in the appendix. The effect of CH4 content in N2–CH4 gases on the carburization rate was also investigated by preliminary experiments. As shown in Fig. 4, the rates increased with increasing CH4 content up to 6 vol%, but there was no further increase from 6 to 11 vol%. Therefore, 11 vol% of CH4 in N2 was used for the experiments.
3.2. Reaction Rates
The carbon concentration in iron carburized by N2-11 vol% CH4 gas at a total flow rate of 800 mL/min was measured at 1573 K with time as shown in Fig. 5. The carburization results by N2-50 vol% CO is also included for comparison. The carburization rate by 11 vol% CH4 was much faster than that by 50 vol% CO gas. That is, the carbon concentration increased from 0.002 to 1.35 mass% for 480 s by CH4. However, the carbon concentration in iron carburized by CO was just 0.05 mass% for the identical period. In order to derive some quantitative relationship, all the data in Fig. 5 were logarithmically plotted as shown in Fig. 6. The slope of the regression line for the carbon concentration by N2-50 vol% CO was calculated to be 0.63. This value is similar to the result obtained by Sasaki et al.11) where the weight gain was proportional to t2/3 by Eq. (2). However, the results by 11 vol% CH4 was not so clear. The data by CH4 were divided into two lines since the carbon concentration between 600 and 900 s abnormally increased. This phenomenon might be related to the formation of graphite precipitates. Around 900 s, the solid graphite started to be precipitated in the liquid iron. There was no carbon accumulated layer in the sample before 600 s. Therefore, only the last three points (900–1500 s) in Figs. 5 and 6 contained the carbon-accumulated layer. Thus, the carbon concentration of the iron phase might be lower than that in the bulk samples for these the three points. In these cases, the graphite phase should be excluded for the precise analysis. In order to evaluate the volume fraction of graphite phase, the digital image analysis (IMAGEJ) was applied to the SEM images. As a result, the volume fractions of pure graphite were evaluated to be 2.2 vol% (900 s), 3.1 vol% (1200 s) and 3.4 vol% (1500 s), respectively. Then, the last three points in Figs. 5 and 6 were corrected as marked by open circles.

As shown in Fig. 7, the effect of H2 on the carburization was examined at 1573 K by increasing the content of H2 gas in the mixing gas, N2-11 vol% CH4 from 0 to 50 vol%. Although the addition of H2 to CH4-containing gas reduces the carbon activity, no noticeable effect was observed.
3.3. Formation of Liquid Phase
As the carbon accumulated on the sample, the formed liquid phase covered the sample surface. The thickness of liquid layer was measured by an optical microscope and EDS line analysis. At the initial time, the liquid phase thickness can clearly be identified as shown in Fig. 8(a). However, as the liquid phase grew, the liquid layer was not uniformly distributed as shown in Fig. 8(b). Therefore, the thickness of liquid phase was evaluated by subtracting the radius of solid phase from the total radius of the sample.

The thickness of liquid phase in the iron carburized by N2-11 vol% CH4 and N2-50 vol% CO gases at 1573 K was shown in Fig. 9. The result by Murakami et al.14) was also presented as the dashed line although their reaction temperature and sample shape were different from those in the present study. They carried out the in-situ observation of iron melting behavior by the direct contact with graphite and the melting rate was determined by carbon diffusion in the liquid phase. As shown in Fig. 9, the initial experimental results by N2-11 vol% CH4 for the initial 600 s are in good agreement with the dashed line. However, the results after 600 s show much higher values than the estimated ones by the line since the penetration depth (δC) of carbon for 600 s might reach the center of the hemispherical sample. Therefore, it is believed that the thickness of liquid phase suddenly increased with time after 600 s. The detailed mechanism will be discussed later. On the other hand, the liquid phase formed by N2-50 vol% CO was very thin and the thickness even after 1500 s was less than 5 μm.
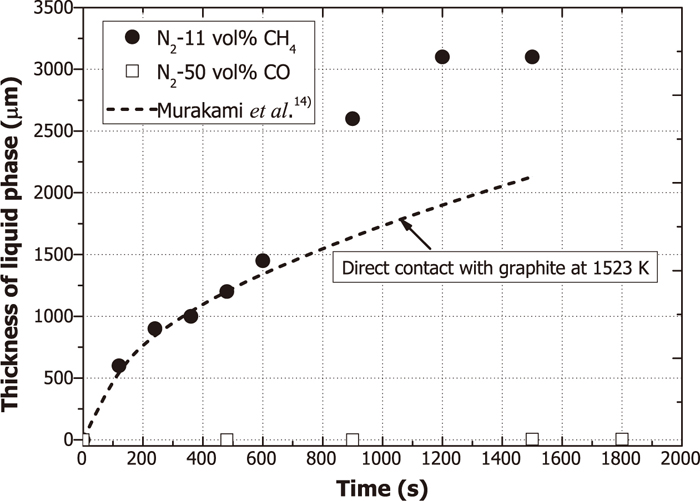
Figure 10 is the iron–carbon equilibrium phase diagram with graphite instead of cementite as a stable phase.15) Cs, CL and Cgr, are the carbon concentrations of the solidus (1.3 mass%), liquidus (3.0 mass%) and saturation (4.6 mass%) at 1300°C (1573 K), respectively. Since the nearby surface of liquid iron is already saturated with carbon around 900 s, further carburization makes the liquid over-saturated with carbon as is expected in Fig. 10. Therefore, the solid graphite rods might be precipitated in the liquid iron. The floating solid graphite rods were easily recognized with the naked eye. The sectional image of the iron carburized by N2-11 vol% CH4 at 1573 K for 1800 s is shown in Fig. 11. From the EDS analysis, Point 1 and Point 2 were identified to be graphite and carbon-saturated iron, respectively.
4. Discussion
For the determination of the rate controlling step, the carburization process of iron with CH4-containing gas at 1573 K was divided into the following four steps:
(a) Gas phase mass transfer
(b) Chemical reaction at the liquid surface
(c) Carbon diffusion in the liquid phase
(d) Carbon diffusion in the solid phase
Under the current experimental conditions, Step (a) is not the rate-controlling step as mentioned in Fig. 3. More detailed consideration about gas phase mass transfer was presented in the Appendix. According to the previous studies,11,12) Step (b) was the rate-controlling step for the carburization of iron with CO and H2 at 1523 K. However, the carburization rates in the present study were about 30 times higher than those in the previous results.11,12) Furthermore, the addition of H2 to N2–CH4 gas mixture did not affect the carburization rate and the precipitation of graphite rods confirmed that Step (b) is not the rate-controlling step in the present study. Step (b) will be more precisely discussed later. Step (d) cannot be the rate-controlling step because the slow diffusion of carbon in the solid phase brings about the carbon accumulation at the liquid/solid interface, resulting in the production of thicker liquid phase. In other words, Step (d) has no influence on the total carburization rate once the liquid phase was formed. Therefore, Step (c), the carbon diffusion in liquid phase, may be considered to be the rate-controlling step for the present study.
4.1. Chemical Reaction on the Surface of Liquid Fe–C
The carburization rate of iron with CH4-containing gas was previously studied by Grabke.3,4) The rate of carburization can be studied under the conditions controlled by the chemical Reaction (6) through the carburization of an iron foil (10 μm thickness) with N2–CH4–H2 at 1273 K.
|
CH
4
(
g
)
=
C
_
+2
H
2
(
g
)
| (6) |
The carburization Reaction (6) comprises the following seven reactions.
CH4 = CH4(ad) (I)
CH4(ad) = CH3(ad) + H(ad) (II)
CH3(ad) = CH2(ad) + H(ad) (III)
CH2(ad) = CH(ad) + H(ad) (IV)
CH(ad) = C(ad) + H(ad) (V)
H(ad) = H2 (VI)
C(ad) = C (VII)
It has been already known that Step (III) is the rate-controlling step, and then the rate of reaction can be represented by the following equation:4)
|
v = k ⋅
p
CH
4
p
H
2
1/2
–
k
*
⋅
p
H
2
3/2
⋅
a
c
| (7) |
In addition, Grabke
4) said that the carbon transfer from CH
4 was much slower than that from both CO and H
2.
3) Thus, the carbon transfer from CH
4 was negligible in the carburization by CO–H
2O–CO
2–CH
4 mixture due to the decreased partial pressure of CH
4. The rate constants for the carburization reactions with CO (
kCO), H
2 (
k
H
2
) and CH
4 (
k
CH
4
) were determined to be 7.6 × 10
–4, 1.5 × 10
–4 and 1.9 × 10
–6 mol/cm
2·s·bar in the iron at 1193 K, respectively.
5) However, the results are totally different from those measured at 1573 K in the present study. Although there is no information about the rate constant of Reaction (6) at 1573 K, CH
4 decomposition is extremely faster than that at 1193 K on the iron surface. The carburization rate in the present study is about 30 times higher than that by CO gas. If the chemical reaction rate is slower than the diffusion rate in the liquid phase, Reaction (6) controls the total carburization rate. Then, the addition of H
2 should decrease the forward Reaction (6) and increase the backward Reaction (6). However, the addition of H
2 to N
2-11 vol% CH
4 had no effect on the total carburization rate as shown in
Fig. 7. In addition, the partial pressure of CH
4 would be an important factor of the chemical reaction rate, but there was no influence in case the concentration is more than 6 vol% of CH
4 as shown in
Fig. 4. This indicates that 6 vol% of CH
4 can be sufficient for fast chemical reaction rate. In addition, the formation of graphite rods can be a clear evidence for the very high concentration of carbon on the surface. Therefore, the carburization process in the present study is most likely to be controlled by the carbon diffusion in the liquid phase, Step (c).
4.2. Diffusion of Carbon in Fe–C Liquid - Solid Moving Interface Problem
Although the liquid phase did not exist initially in the current study, liquid Fe–C phase was formed due to the decreased melting point of Fe–C alloy with increasing carbon content in iron as shown in Fig. 10. After the Fe–C liquid phase appears at the interface between the solid iron and reactive gas, the carburization phenomena are totally different from that for the solid phase only. Actually, 1-D moving interface problem of infinite condition can easily be solved by an analytical method.16) However, it is very complex to analytically solve the problem of the diffusion in spherical particles with moving interface.17) In particular, it is almost impossible to analytically solve it at the finite condition. Accordingly, the diffusion-controlling moving interface of the two phases was solved relying on the numerical method. In the spherical coordinate system, the governing equation for the carbon diffusion has the following form:
|
∂C
∂t
=D(
2
r
∂C
∂r
+
∂
2
C
∂
r
2
)
| (8) |
In the problem of moving interface in the transformation of solid to liquid phase, the above governing equation is independently valid in both solid and liquid phases as follows:
|
∂C
∂t
=
D
C
S
(
2
r
∂C
∂r
+
∂
2
C
∂
r
2
)
| (9) |
for 0<x<X(t), solid phase
|
∂C
∂t
=
D
C
L
(
2
r
∂C
∂r
+
∂
2
C
∂
r
2
)
| (10) |
for X(t)<x<R, liquid phase
where x, X(t) and R are the position of interest, position of the moving interface and the radius of the metal sphere, respectively.
The first and second derivatives are hard to obtain around the interface without applying a smooth function which can be differentiated in the interface. If Lagrange interpolation would be applied near the interface, the first and second derivatives around the interface can be obtained as follows:
|
∂C
∂x
|
x=
x
m
=
1
Δx
{
pC(
x
m-1
)
p+1
-
p+1
p
C(
x
m
)
+
2p+1
p(
p+1
)
C
S
}
| (11) |
|
∂
2
C
∂
x
2
|
x=
x
m
=
2
Δ
x
2
{
C(
x
m-1
)
p+1
-
C(
x
m
)
p
+
C
X
p(
p+1
)
}
| (12) |
for x=xm (solid phase side) and
|
∂C
∂x
|
x=
x
m+1
=
1
Δx
{
2p-3
(
1-p
)
(
2-p
)
C
L
+
2-p
1-p
C(
x
m+1
)
-
1-p
2-p
C
m+2
}
| (13) |
|
∂
2
C
∂
x
2
|
x=
x
m+1
=
2
Δ
x
2
{
C
L
(
1-p
)
(
2-p
)
-
C(
x
m+1
)
1-p
+
C(
x
m+2
)
2-p
}
| (14) |
for x=xm+1 (liquid phase side)
Here, Δx, CS, CL, C(x) and p are the mesh size, equilibrium carbon content in solid phase at the interface, equilibrium carbon concentration in liquid phase at the interface, carbon concentration at x and the distance of the interface from the neighboring xm, respectively, as illustrated in Fig. 12. The detailed numerical scheme used in the calculation is well explained in the study done by Zhou and North.18)

The calculated diffusion rate of carbon by the numerical simulation is shown by Fig. 13. Unfortunately, the diffusivity of carbon in Fe–C liquid phase has not been well established especially in the high carbon content in iron. The reported diffusivity of carbon (
D
C
L
) in liquid iron at 1573 K were widely distributed from 1 × 10⁻⁹ to 1 × 10⁻⁸ m2/s.19,20) Thus, three kinds of different diffusivities of carbon (
D
C
L
) of 1 × 10⁻⁹, 3 × 10⁻⁹, 5 × 10⁻⁹ m2/s were adopted and the carbon diffusivity of 2.8 × 10⁻¹⁰ m2/s in solid Fe measured by Sasaki et al.11) was actually used in the calculation. When the diffusivity of 3 × 10⁻⁹ m2/s was applied, the carbon saturation time and carburization rate were almost similar to the experimental results although the results around 900 s show some deviation from the simulation results. In addition, the thickness of liquid phase was calculated by a numerical method. Figure 14 shows the comparison of the thickness of liquid phase calculated by a numerical analysis with experimental results. When the diffusivity value of 3 × 10⁻⁹ m2/s was applied, the simulation results were in good agreement with the experimental results. Therefore, the diffusivity of carbon (
D
C
L
) in liquid iron at 1573 K was estimated to be about 3 × 10⁻⁹ m2/s from the result of the numerical calculation. Previously, Kim et al.20) obtained the carbon diffusivity (
D
C
L
) of 2.32 × 10⁻⁹ m2/s in liquid iron at 1523 K for the melting process of graphite contacting Fe. The estimation is reasonably acceptable considering the reaction temperature difference.

The moving mechanism of liquid phase is schematically illustrated in Fig. 15 where the horizontal axis indicates the distance from the iron surface and the vertical axis represents the carbon concentration. Above all, the carbon concentration on the surface is always saturated with carbon because the chemical reaction rate is sufficiently faster than the diffusion rate in liquid phase. In Step (1), after the formation of liquid Fe–C phase, the carbon flux in the liquid phase is much larger than that in the solid phase due to the difference between the carbon diffusivity (
D
C
L
) in liquid phase and that (
D
C
S
) in solid state. Thus, carbon is accumulated at the liquid/solid interface and the interface slowly moves toward the solid phase. However, the moving rate gradually decreases as the gradient in the liquid phase diminishes. In Step (2), the carbon concentration in the solid phase gradually increases as the carburization proceeds. Consequently, the carbon penetration depth (δC) reaches the center at a certain time, approximately 600 s in the present experiment. According to the previously derived relation of Eq. (15),11) the depth is estimated to be about 1.5 mm at 600 s, which is in good accordance with the result in Fig. 9:
|
δ
C
=4
(
D
C
S
t
)
1/2
| (15) |
In Step (3), the gradient of carbon concentration in the solid phase rapidly decreases once the penetration depth (
δC) reaches the center. Then the removal rate of carbon from the interface to the solid phase quickly decreases. Therefore, the thickness of liquid phase suddenly increases. As the thickness of liquid phase gradually increases, the interface moving rate decreases again due to the decrease of the carbon gradient in the liquid phase.
5. Conclusions
The carburization rate of iron by N2-11 vol% CH4 gas was investigated at 1573 K employing an induction furnace. From the findings, the following conclusions were obtained.
(1) The carburization rate of iron by N2-11 vol% CH4 gas was about 30 times faster than that by N2-50 vol% CO gas, which was evaluated from the rapid increase of carbon content in iron from 0.002 to 1.35 mass% for the reaction time of 480 s.
(2) Addition of H2 to N2–CH4 gas containing higher than 6 vol% CH4 had no influence on the rate of carburization, which indicates that the carburization rate is controlled by the diffusion of carbon in the liquid phase of Fe–C.
(3) The diffusivity of carbon (
D
C
L
) in liquid iron at 1573 K was estimated to be about 3 × 10⁻⁹ m2/s according to the numerical simulation of moving interface problem.
(4) The moving mechanism of liquid/solid interface was schematically proposed based on the finding that the diffusion of carbon in the liquid phase of Fe–C controls the carburization of iron by methane.
Appendix. Mass Transfer Considerations for Gas Phase
The sample can be assumed to be a sphere since gas flow to the bottom surface of the hemisphere is restricted by the crucible. That is, the calculation was performed for the sample of a symmetrical spherical shape. There are several mass transfer correlations for the sphere exposed to external gas flow. In the present study, the correlation of Ranz-Marshall was employed:21)
|
Sh=2+0.6
Sc
1/3
Re
1/2
| (A-1) |
where Sh = (
kmr
P/
D), Re (= uL
ρ/
μ) and Sc (=
μ/
ρL) are Sherwood number, Reynolds number and Schmidt number, respectively. Equations of Chapman-Enskog
22) and Wilke
23) were used to calculate the diffusivity and viscosity of N
2–CH
4 gas mixture. The calculation provided the gas density (
ρg) of 1.5 × 10
–4 g/cm
3, gas viscosity (
μ) of 4.6 × 10
–4 g/cm·sec and N
2–CH
4 diffusivity (D) of 2.62 cm
2/sec. The mass transfer coefficient (
km) was evaluated to be 29.7 × 10
–2 m/sec for the flow rate of 6.66 × 10
–6 m
3/s by applying the above values to
Eq. (A-1). If the mass transfer coefficient was applied to the counter diffusion of CO and CO
2, the rate of carbon supply to the unit area was estimated to be 28.0 × 10
–2 mol/m
2·s at the flow rate of 6.66 × 10
–6 m
3/sec. It is extremely higher than the measured values in
Fig. 3.
References
- 1) Y. Nomura, H. Nakagawa, T. Maeda, K. Nishioka and M. Shimizu: Tetsu-to-Hagané, 91 (2005), 521.
- 2) N. Takeuchi, Y. Nomura, K. Ohno, T. Maeda, K. Nishioka and M. Shimizu: ISIJ Int., 47 (2007), 386.
- 3) H. J. Grabke: MTAEC, 36 (2002), 297.
- 4) H. J. Grabke: Metall. Trans., 1 (1970), 2972.
- 5) H. J. Grabke: Arch. Eisenhüttenwes., 46 (1975), 65.
- 6) R. J. Fruehan: Metall. Trans., 4 (1973), 2123.
- 7) A. R. Shatansky and H. J. Grabke: Arch. Eisenhüttenwes., 49 (1978), 131.
- 8) J. H. Kaspersma and R. Shay: Metall. Trans. B, 12B (1981), 77.
- 9) K. Amano, K. Itoh and H. Sakao: Tetsu-to-Hagané, 61 (1975), 312.
- 10) K. Suzuki, K. Mori, T. Kitagawa and T. Shibayama: Tetsu-to-Hagané, 62 (1976), 42.
- 11) Y. Sasaki, R. Asano and K. Ishii: ISIJ Int., 41 (2001), 416.
- 12) R. Asano, Y. Sasaki and K. Ishii: ISIJ Int., 42 (2002), 121.
- 13) A. Steinfeld, A. Frei and P. Kuhn: Metall. Trans. B, 26B (1995), 509.
- 14) T. Murakami and K. Nagata: Miner. Proc. Extr. Metall. Rev., 24 (2003), 253.
- 15) W. D. Callister, Jr.: Materials Science and Engineering; an Introduction, 7th ed., Wiley & Sons, Inc., New York, (2007), 389.
- 16) G. H. Geiger and D. R. Poirier: Transport Phenomena in Metallurgy, Addison-Wesley Publishing Company, Reading, MA, (1973), 490.
- 17) Yu. D. Klebanov and R. G. Nersisyan: Soviet Powder Metall. Met. Ceram., 17 (1978), 710.
- 18) Y. Zhou and T. H. North: Mater. Sci. Eng., 1 (1993), 505.
- 19) D. Goldberg and G. R. Belton: Metall. Trans., 5 (1974), 1643.
- 20) H. S. Kim, S. H. Lee and Y. Sasaki: ISIJ Int., 50 (2010), 71.
- 21) W. E. Ranz and W. R. Marshall: Chem. Eng. Prog., 48 (1952), 141.
- 22) S. Chapman and T. G. Cowling: The Mathematical Theory of Non-uniform Gases, Cambridge University Press, London, (1960).
- 23) C. R. Wilke: J. Chem. Phys., 18 (1950), 517.


