Abstract
The molar volumes of binary M–Si (M=Fe, Ni, and Ge) alloys in a liquid state were obtained from their densities measured using electromagnetic levitation coupled with a static magnetic field. We have systematically analyzed the molar volume as a function of composition. Although the concentration dependence of the molar volume of the liquid Ge–Si alloys obeys a linear law which is indicative of an ideal mixture, in comparison, that of the Ni–Si alloys shows a large discrepancy from the linear law as well as the Fe–Si system. The interaction between the constituent atoms was discussed with a view to analyzing the partial molar volume.
1. Introduction
The study of binary silicides has been extensive over a long period because of their wide variety of applications as industrial materials. In particular the Fe–Si system has several compounds such as Fe3Si for a ferromagnetic material,1) FeSi for a magnetic semiconductor stable at high-temperature,2) and FeSi2 and Fe2Si5 for thermoelectric materials.3) The Ni–Si system forms compounds at similar compositions as the Fe–Si system and their electronic and magnetic properties have also received widespread interest.4,5) Although Ge–Si alloys show no formation of compounds, their electronic properties have been paid attention due to their remarkable potential for application.6,7) Hence, a large number of studies have been reported for their properties in thin films, in addition, there are several reports for single crystals grown by the Czochralski technique.8,9)
It is widely known that reliable data of thermophysical properties such as thermal conductivity, density, surface tension, and viscosity are indispensable to control a heat and mass transfer process at the solid-liquid interface during crystal growth. In addition, the thermophysical properties of the liquid phase are of particular interest since they play an important role in defining the thermodynamic state and in understanding relations with microscopic structures of the melt. Therefore, a comparative study of these Si alloys is desirable in order to clarify the relationship between the compound forming compositions and the concentration dependence of thermophysical properties especially the density of the melts, since the density is the most fundamental quantity to understand physicochemical properties. However, experimental measurements of the thermophysical properties of high-temperature melts are difficult due to contamination, mainly from contact materials of the sample container. In recent decades, various containerless techniques have been developed to study physical properties in the liquid state of materials with high melting temperatures (in excess of 2000 K).10,11) Fukuyama et al.12) developed an experimental technique using electromagnetic levitation (EML) coupled with a static magnetic field for non-contact measurement of thermophysical properties of high-temperature melts. Since a static magnetic field of the order of several tesla can suppress surface oscillations and translational motions of a liquid droplet levitated electromagnetically,13) this technique enables us to obtain accurate values of thermophysical properties such as thermal conductivity, heat capacity,14,15,16,17) spectral emissivity,16,17) surface tension,18) and density.19,20,21)
Several reports have been published on the liquid density of the above-mentioned silicon alloys,19,20,21,22,23,24) yet the range of composition covered is still inadequate to perform a systematic study and there is some remaining uncertainty concerning the absolute value and its temperature dependence. In addition, precise density values are essential to analyze structural data of liquid M–Si (M=Fe, Ni, and Ge) alloys, obtained from synchrotron x-ray diffraction experiments conducted by the present authors.25) Therefore, following the previous work,20,21) we have measured the liquid density of M–Si (M=Fe, Ni, and Ge) alloys with the EML technique coupled with a static magnetic field. The aim of this paper is to report results of systematic analysis concerning the concentration dependence of the molar volume obtained from the measured density, in order to study the mixing effect on the molar volume over an entire concentration range and wide temperature range including an undercooled liquid state.
2. Experimental
2.1. Density Measurement Using EML Coupled with a Static Magnetic Field
Since the principle for density measurement using EML coupled with a static magnetic field is similar to those previously reported,19,20,21) a brief description is given below for the experimental equipment. In Fig. 1 the experimental setup for density measurements is shown. The levitation coil in a high-vacuum chamber was located at the center of the magnetic field generated using a superconducting magnet (JMTD-10T120SSFX, Japan Superconductor Technology, Inc.) with a bore diameter of 120 mm. The radio frequency generator (maximum power of 10 kW, EASYHEAT, Ameritherm, Inc.) operates at a frequency from 150 to 400 kHz, which depends on electrical properties due to the sample environment. Due to the low electrical conductivity of Si-based alloys as well as Ge and Si, the eddy current induced from the RF coil is inadequate to levitate and heat the sample when compared with typical metallic samples. Therefore, a high-power semiconductor laser (maximum power of 140 W, wavelength of 807 nm, NBT-S140-mk II, JENOPTIK Laserdiode Japan Co., Ltd.) was installed to heat and melt the sample before levitation.
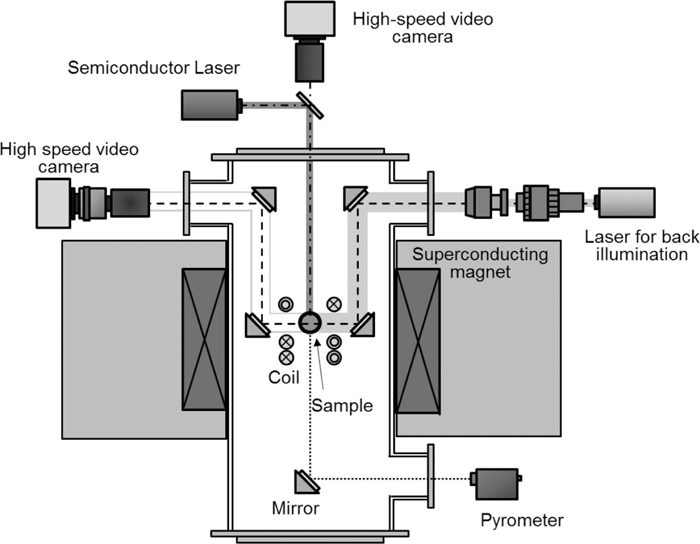
The temperature of the levitated droplet was obtained by calibrating the output signal of the single color pyrometer using Planck’s law, at the liquidus temperature of the alloy.15)
The density of the levitated droplet was determined using an image processing method.26) To image the sharp edge of the droplet accurately, we adopted a shadowgraph technique which eliminates intense radiance from the high-temperature droplet. A laser light source with a wavelength of 532 nm was mounted through a beam shaper for back illumination. In addition, a high-speed video camera (FASTCAM-512PCI, Photron, Ltd.) was used to obtain shadow images of the droplet from the side. The high-speed video camera was operated at a frame rate of 500 Hz and images at a resolution of 512 × 512 pixels were recorded continuously during the cooling process of the sample.
2.2. Estimation of Density
The volume of the levitated droplet can be determined by an image sectioning method of the droplet profile. The radius, r, from the center of mass of the droplet was fitted with a series of Legendre polynomials, Pn, as a function of the polar angle, θ, as
|
r(
θ
)
=
∑
n=0
5
a
n
P
n
(cosθ).
| (1) |
The volume, V, of the droplet is then estimated by assuming that the shape of the droplet is symmetrical around the vertical axis, that is,
|
V=
2π
3
∫
-1
1
r
3
(
θ
)
dcosθ
.
| (2) |
In this procedure, the conversion of units from pixel to length was made using the image of a calibration sphere. The mass of the sample was measured before and after levitation to account for any volume change due to evaporation of the sample. The density, ρ, can then be estimated from the mass and volume.
Binary alloys of a M–Si (M=Fe, Ni, and Ge) system were prepared from constituent elements by means of conventional arc melting in a highly purified Ar gas atmosphere. The compositions of the alloy were chosen as close to the compound forming and the congruent compositions in the case of the Fe–Si and Ni–Si systems.
3. Results and Discussion
In Figs. 2(a)–2(c) the concentration dependence of the density of the liquid Si alloys as a function of temperature is shown. The temperature range covered not only the liquid phase beyond the liquidus temperature, but also the undercooled liquid state. The densities of the Ge–Si system show widely scattered values in particular for the low temperature and high concentration ranges of Ge, when compared with the other two systems. This is due to a deformation of the sample droplet during a cooling process by blowing He gas to achieve the low temperature condition for the Ge-rich Si alloys which have lower liquidus temperature than that of the other two alloy systems. In the case of the Fe–Si alloys, the values of the density are in good agreement with the reported values obtained from the x-ray sessile drop technique22) (not shown). For the temperature range investigated in the present study, the temperature dependence of the density can be fitted by a linear function as
|
ρ=
ρ
L
+α(
T-
T
L
)
,
| (3) |
where
ρL is the density at the liquidus temperature
TL, and
α is the temperature coefficient defined by
α=(
∂ρ/∂T
)
. These parameters are summarized in
Table 1 for all compositions of the investigated alloys. The expanded uncertainty presented in this table was evaluated for the measured density according to the Guide to the expression of Uncertainty in Measurement (GUM).
28) In the present study, the expanded uncertainty with coverage factor of 2 was obtained by considering standard uncertainties of the radius determination of a droplet sample and of the mass measurement. These values were calculated at an isothermal condition (1820 K, 1770 K, and 1700 K for the Fe–Si, Ni–Si, and Ge–Si systems, respectively) for estimation of the molar volume as described below. The values of the uncertainty indicate similar tendency about dispersion of the density obtained at these temperatures.
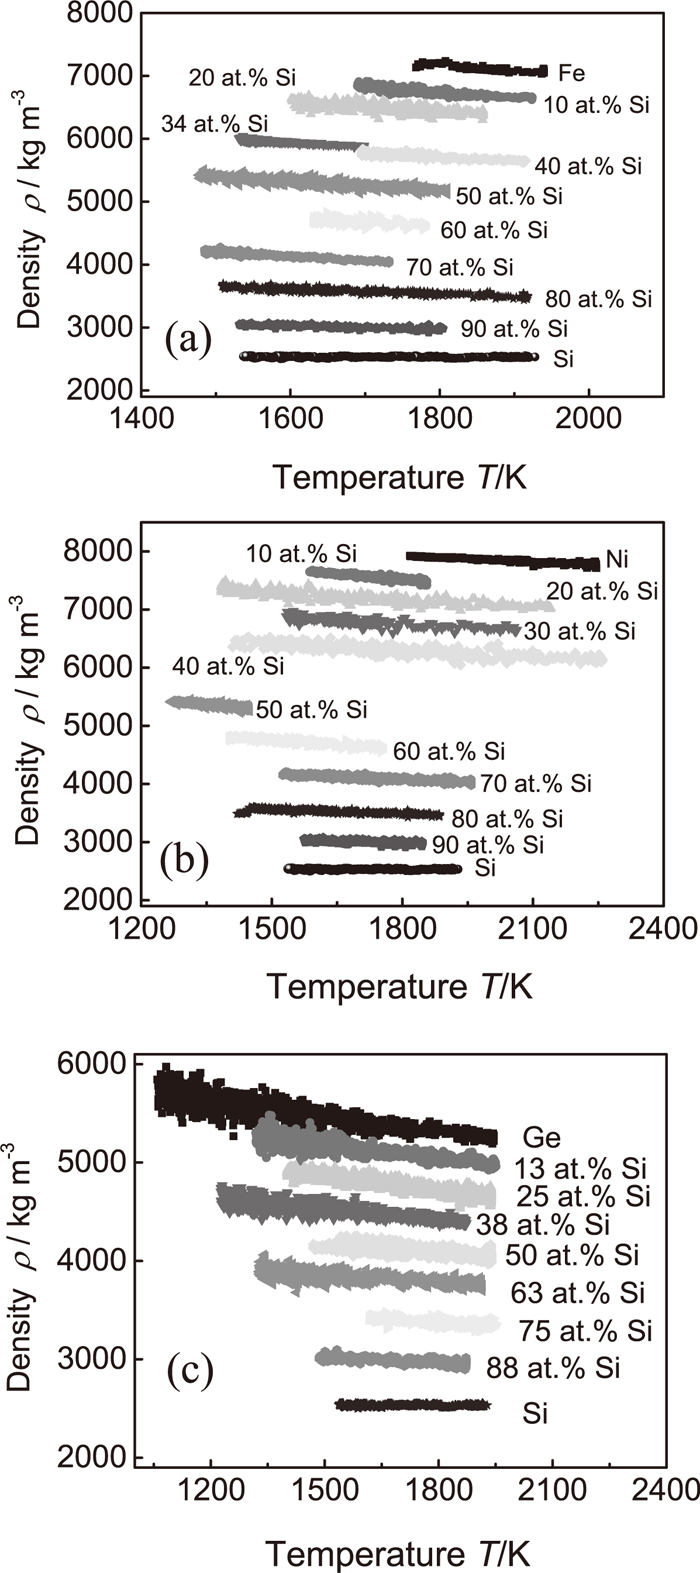
Table 1. Fitting parameters for the linear function obtained from the measured density data of the Fe–Si, Ni–Si, and Ge–Si alloys. The values of expanded uncertainty were estimated at an isothermal condition for each alloy, 1820 K, 1770 K, and 1700 K for the Fe–Si, Ni–Si, and Ge–Si systems, respectively.
| System | Concentration | Liquidus temperature | Density at TL | Temperature coefficient | Expanded uncertainty
with coverage factor of 2 |
|---|
| at. % Si | TL/K | ρL / kg m–3 | α/kg m–3K–1 | U / kg m–3 |
|---|
| Fe–Si | 0 | 1808 | 7162 | –0.735 | 93 |
| 5 | 1793 | 6705 | –1.059 | 89 |
| 10 | 1745 | 6539 | –0.919 | 85 |
| 15 | 1681 | 6345 | –0.881 | 81 |
| 20 | 1595 | 6380 | –0.708 | 82 |
| 25 | 1553 | 6065 | –1.065 | 75 |
| 34 | 1473 | 5827 | –0.731 | 73 |
| 38 | 1561 | 5644 | –0.724 | 70 |
| 40 | 1603 | 5675 | –0.615 | 73 |
| 45 | 1655 | 5278 | –0.755 | 67 |
| 50 | 1693 | 5051 | –0.773 | 64 |
| 55 | 1657 | 4773 | –0.716 | 60 |
| 60 | 1603 | 4572 | –0.581 | 58 |
| 70 | 1520 | 4022 | –0.671 | 49 |
| 75 | 1486 | 3654 | –0.609 | 44 |
| 80 | 1583 | 3519 | –0.386 | 45 |
| 90 | 1643 | 2949 | –0.260 | 39 |
| 100 | 1687 | 2580 | –0.184 | 36 |
| Ni–Si | 0 | 1728 | 7783 | –0.671 | 96 |
| 10 | 1623 | 7523 | –0.773 | 91 |
| 20 | 1451 | 7015 | –0.694 | 82 |
| 26 | 1503 | 6859 | –0.780 | 81 |
| 30 | 1490 | 6713 | –0.637 | 79 |
| 33 | 1579 | 6530 | –0.650 | 78 |
| 35 | 1567 | 6406 | –0.640 | 76 |
| 40 | 1451 | 6137 | –0.558 | 72 |
| 45 | 1278 | 5921 | –0.527 | 68 |
| 50 | 1265 | 5480 | –0.482 | 62 |
| 67 | 1389 | 4264 | –0.319 | 48 |
| 67 | 1389 | 4251 | –0.280 | 48 |
| 70 | 1434 | 4084 | –0.262 | 47 |
| 80 | 1551 | 3549 | –0.256 | – |
| 90 | 1632 | 3019 | –0.211 | – |
| Ge–Si | 0 | 1211 | 5616 | –0.508 | 71 |
| 13 | 1353 | 5241 | –0.434 | 66 |
| 25 | 1433 | 4894 | –0.457 | 61 |
| 38 | 1493 | 4536 | –0.367 | 57 |
| 50 | 1543 | 4147 | –0.325 | 53 |
| 63 | 1583 | 3835 | –0.223 | 50 |
| 75 | 1623 | 3400 | –0.246 | 45 |
| 88 | 1653 | 2994 | –0.199 | 41 |
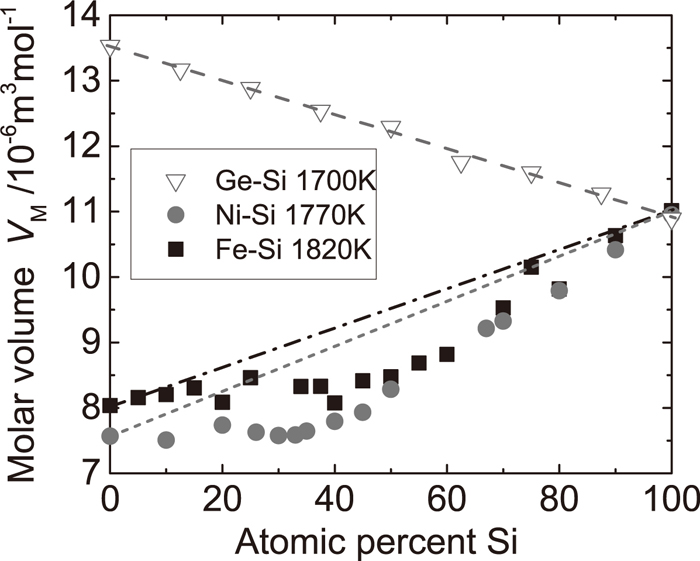
In thermodynamics, density is an intensive quantity, whereas volume is an extensive quantity. Hence, we have analyzed the molar volume to discuss effects on mixing Si and another element in the liquid state. In Fig. 3 the molar volumes of the liquid Si alloys are shown, which were estimated from the measured density at the isothermal condition. The molar volume of the Ge–Si alloy decreases monotonically with an increase in Si content and smoothly obeys the linear law. In contrast, the molar volume of the Fe–Si alloy increases with increasing Si concentration as well as that of the Ni–Si alloy. In addition, large discrepancies from the linear law can be observed in these systems when compared with the Ge–Si system.
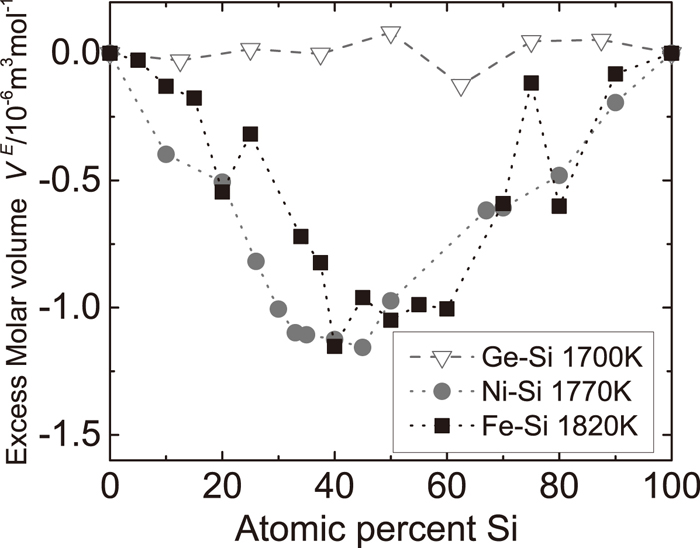
To clarify these differences between the systems, the excess molar volume, VE, was estimated as
|
V
E
=
V
M
-
∑
i
c
i
V
i
,
| (4) |
where
VM is the total molar volume observed,
Vi is the molar volume of the pure atomic species
i, and
ci is its atomic fraction. As shown in
Fig. 4, the excess molar volumes of the Ge–Si alloys are almost zero over the whole concentration range. This suggests that the liquid Ge–Si alloys can be treated as an ideal mixture at 1700 K, while Chatoth
et al.
24) concluded that the liquid density at the liquidus temperature illustrated non-ideal behavior, indicating a maximum at the equiatomic composition of the Ge–Si alloy. Aside from the fact that the density is an intensive property, this discrepancy may result from the difference in the temperature condition, at which they compared the density values. In fact, a similar tendency to obey the linear law was observed in the concentration dependence of the first peak position of the pair distribution function, which is indicative of the interatomic distance, obtained from the x-ray diffraction data at an isothermal condition.
25)
On the other hand, the excess molar volume of the Fe–Si alloys shows large negative deviation from the linear law and the minimum near the equiatomic composition. In addition, the Ni–Si system also shows negative deviation from the linear law and a minimum around 40 at. % of Si. According to the binary phase diagram of the Fe–Si and Ni–Si systems, the composition showing the minimum in the excess molar volume corresponds to the composition that forms the congruent compounds with the highest liquidus temperature, 50 at.% of Si in the Fe–Si system and 33 at.% of Si in the Ni–Si system.28) Therefore, these results signify that the interaction between Si and Fe or Ni atoms is relatively attractive at the compound forming composition.
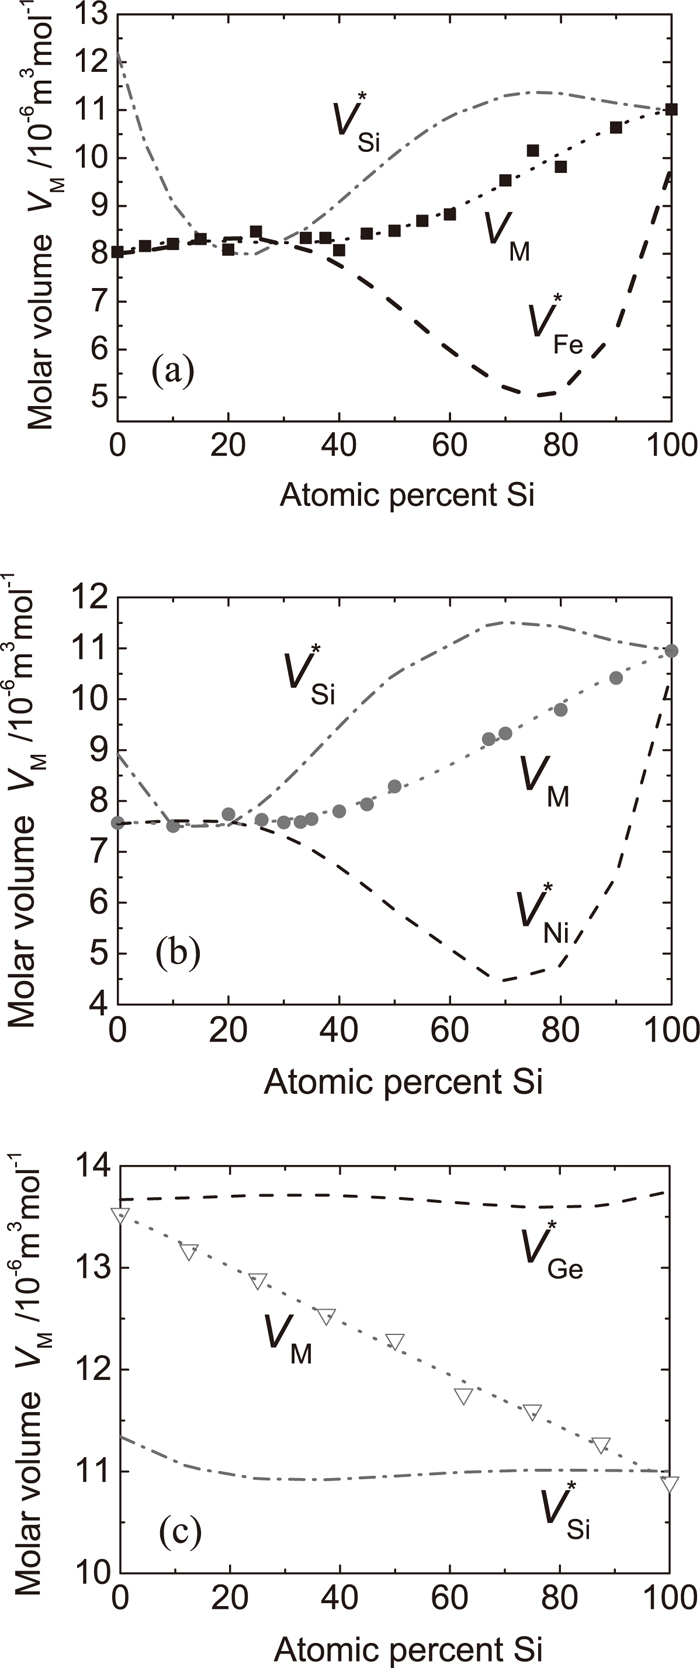
To obtain more insight into the mixing effect on the volume, we have estimated the partial molar volume of species i, Vi*, defined as
|
V
i
*
=
(
∂V
∂
n
i
)
T,p,
n
j
=
V
M
-
c
j
d
V
M
d
c
j
,
| (5) |
where
ni is the number of species
i. In the present case, the concentration dependence in the total molar volume was expressed evidently by the quartic function as shown in
Figs. 5(a)–5(c). Therefore, the partial molar volumes can be estimated from
Eq. (5) with the use of coefficients of the quartic function obtained by fitting to the total molar volume. As shown in
Fig. 5(c), the partial molar volumes of Si and Ge in the Ge–Si alloy indicate no clear concentration dependence. This result also suggests that the liquid Ge–Si alloys are the ideal mixture, that is, the interactions between Si and Ge atoms are identical upon mixing for entire concentration range. In contrast, for the Fe–Si alloys, the partial molar volume of Fe decreases and that of Si increases drastically above 40 at. % of Si. A similar tendency can be observed for the partial molar volumes of the Ni–Si alloys, though a drastic change occurs above 30 at. % of Si. These facts suggest that interatomic interactions in the Fe–Si and Ni–Si systems are attractive with an increase in Si content in the Si-rich concentration range. A decrease in the partial molar volume of Fe and Ni indicates that Fe or Ni atoms attract the Si atoms around them and induced shortening of the interatomic distance between them. This tendency is qualitatively consistent with concentration dependence of the first peak position of the pair distribution function, which indicates a decrease in the average interatomic distance with increasing Si content.
25)
4. Conclusion
The densities or molar volumes were determined for liquid M–Si (M=Fe, Ni, and Ge) alloys in a wide temperature range over the whole concentration range of the alloys. The density showed linear temperature dependence for all compositions of alloys investigated in this study. The molar volume estimated as a function of composition at constant temperatures was analyzed systematically. It was found that the Ge–Si alloy shows ideal mixing behavior with a nearly vanishing excess molar volume. On the other hand, in the case of the Fe–Si and Ni–Si liquid alloys, negative values of the excess volume and a drastic change of the partial molar volume were observed around the compound-forming composition in the solid state. This indicates that the interatomic interaction in transition metal-Si alloys increases drastically with Si content.
Acknowledgement
The authors would like to thank Professor T. Hibiya (Keio University) and Professor S. Ozawa (Tokyo Metropolitan University) for their helpful discussions. This work was supported financially by SENTAN, Japan Science and Technology Agency (JST).
References
- 1) J. Kudrnovský, N. Christensen and O. Andersen: Phys. Rev. B, 43 (1991), 5924.
- 2) L. Mattheiss and D. Hamann: Phys. Rev. B, 47 (1993), 114.
- 3) E. Moroni, W. Wolf, J. Hafner and R. Podloucky: Phys. Rev. B, 59 (1999), 12860.
- 4) A. Franciosi, J. Weaver and F. Schmidt: Phys. Rev. B, 26 (1982), 546.
- 5) Z. Zhu, X. Gao, T. Kubart, Z. Zhang, D. Wu and S.-L. Zhang: Appl. Phys. Lett., 101 (2012), 053508.
- 6) A. Qteish and R. Resta: Phys. Rev. B, 37 (1988), 6983.
- 7) S. Lynch, G. Matmon, S. G. Pavlov, K. L. Litvinenko, B. Redlich, F. G. van der Meer, N. V. Abrosimov and H.-W. Hübers: Phys. Rev. B, 82 (2010), 245206.
- 8) C. Kloc, E. Arushanov, M. Wendl, H. Hohl, U. Malang and E. Bucher: J. Alloys Compd., 219 (1995), 93.
- 9) N. V. Abrosimov, S. N. Rossolenko, V. Alex, A. Gerhardt and W. Schröder: J. Cryst. Growth, 166 (1996), 657.
- 10) H. Fukuyama and Y. Waseda: High-Temperature Measurements of Materials, Springer, Berlin, (2008).
- 11) D. L. Price: High-temperature Levitated Materials: Cambridge Univ. Press, Cambridge, (2010).
- 12) H. Fukuyama, H. Kobatake, K. Takahashi, I. Minato, T. Tsukada and S. Awaji: Meas. Sci. Tech., 18 (2007), 0957.
- 13) H. Yasuda, I. Ohnaka, Y. Ninomiya, R. Ishii, S. Fujita and K. Kishio: J. Cryst. Growth, 260 (2004), 475.
- 14) H. Kobatake, H. Fukuyama, I. Minato, T. Tsukada and S. Awaji: Appl. Phys. Lett., 90 (2007), 094102.
- 15) H. Kobatake, H. Fukuyama, T. Tsukada and S. Awaji: Meas. Sci. Technol., 21 (2010), 025901.
- 16) H. Kobatake, H. Fukuyama, I. Minato, T. Tsukada and S. Awaji: J. Appl. Phys., 104 (2008), 054901.
- 17) T. Tsukada, H. Fukuyama and H. Kobatake: Int. J. Heat Mass Transf., 50 (2007), 3054.
- 18) S. Ozawa, N. Takenaga, T. Hibiya, H. Kobatake, H. Fukuyama, M. Watanabe and S. Awaji: Mater. Sci. Eng. A, 495 (2008), 50.
- 19) M. Watanabe, M. Adachi, T. Morishita, K. Higuchi, H. Kobatake and H. Fukuyama: Faraday Discuss., 136 (2007), 279.
- 20) M. Adachi, T. Aoyagi, A. Mizuno, M. Watanabe, H. Kobatake and H. Fukuyama: Int. J. Thermophys., 29 (2008), 2006.
- 21) M. Tanno, M. Watanabe, H. Kawauchi, A. Mizuno, M. Adachi, H. Kobatake and H. Fukuyama: Proc. 2nd Int. Symp. e-Therm 2010, Committee of e-Therm 2010, Tsukuba, (2010), 116.
- 22) C. Dumay and A. Cramb: Metall. Mater. Trans. B, 26 (1995), 173.
- 23) H. P. Wang, C. D. Cao and B. Wei: Appl. Phys. Lett., 84 (2004), 4062.
- 24) S. M. Chathoth, B. Damaschke, K. Samwer and S. Schneider: Appl. Phys. Lett., 93 (2008), 071902.
- 25) A. Mizuno, K. Murai, H. Kawauchi, M. Tannno, S. Kohara and M. Watanabe: Mater. Res. Soc. Symp. Proc., Vol. 1528, Cambridge Univ. Press, Cambridge, (2013), VV10-05.
- 26) J. Brillo and I. Egry: Int. J. Thermophys., 24 (2003), 1155.
- 27) L. Kirkup and R. B. Frenkel: An Introduction to Uncertainty in Measurement, Cambridge Univ. Press, Cambridge, (2006), 97.
- 28) T. B. Massalski: Binary Alloy Phase Diagrams, 2nd Ed., ASM International, Materials Prak, OH, (1996) CD-ROM.