Abstract
In order to develop a process to effectively desulfurize liquid steel, a desulfurization of liquid steel was performed in a specially designed equipment. Reaction between a layer of liquid slag (CaO–MgO–Al2O3) and multiple steel droplets generated from a liquid steel was attempted in a two-zone heating furnace. The liquid steel containing S was melted in a crucible at an upper zone of the furnace, and droplets were generated by falling the liquid steel through a hole at the bottom of the upper crucible. The droplets were allowed to free-fall and passed through the liquid slag melted in the other crucible at a lower zone of the furnace. The liquid steel accumulated at the lower crucible was sampled and was analyzed for the S content. It was found that desulfurization took place in two distinctive modes: dynamic and static mode. A model equation was formulated in order to interpret the obtained experimental data, and apparent rate constants for the dynamic mode (kd) and the static mode (ks) were obtained. While the ks was in the order of 10−5 m sec−1 which is in agreement with the literature data obtained by usual metal-slag reaction, the kd was much higher than the ks, as high as in the order of 10−3 m sec−1. In order to maximize the desulfurization rate by the droplets/liquid slag, it is required to keep the slag having higher sulfide capacity while the desulfurization takes place. It further requires an even distribution of the droplets in the slag layer.
1. Introduction
Desulfurization technologies have been well developed, such as the desulfurization in a Torpedo Ladle Car (TLC) and/or Kanbara Reactor (KR).1) In the TLC, an injection of flux into the hot metal along with a carrier gas is accomplished. On the other hand, KR uses a mechanical stirrer in order to promote mixing between the hot metal and the flux. Both processes are effective to decrease the S content, initially in the order of a few hundreds of ppm to below 50 ppm in a short time. But S content in ultra-low S steels should be decreased below 10 ppm within the process time. A new breakthrough for the desulfurization should be developed. One of the new processes may utilize a reaction between steel droplets and desulfurizing flux.
Previous researches about chemical reaction in liquid steel in the form of droplets, including desulfurization, are rare. There were a few studies regarding mass transfer across slag/metal droplet interface, simulating upper part of blast furnace hearth. Turkdogan et al.2) investigated Mn, Si transfer between C-saturated liquid iron droplets and blast furnace type liquid slag at 1753 K. They observed extremely fast reaction rate (reaching equilibrium within 1–2 sec), which has never been reported in conventional experiments. They speculated it to solute-induced interfacial turbulence and vaporization/absorption of volatile gas species (SiO(g), SiS(g), Mn(g)). Subsequent study in a similar topic was carried out by Wu et al.,3) employing free falling of a liquid iron drop (1.5 × 10⁻³ kg) in the liquid slag at 1773 K. They also found very rapid reaction rate (reaching near equilibrium in 1 sec). They attributed it to an emulsification of the metal drops during the falling through the slag, which might significantly enlarge reaction interface.
Regarding rapid desulfurization of liquid droplet, Kang et al.4) performed a series of experiments. They allowed a S transfer between a free-falling steel droplet and a liquid slag composed of CaO–MgO–Al2O3 at 1873 K. They employed an X-ray fluoroscope in order to observe the falling behavior of the droplet in-situ. As soon as the droplet arrived at the bottom of the liquid slag, the droplet was quenched with the slag, and S content in the droplet was analyzed. What they found were as follows: 1) falling time of the droplet depended on the size and the S content of the droplet, as shown in the Fig. 1, 2) the extent of desulfurization increased as mass of droplet decreased and CaO content in the slag increased, and 3) the desulfurization took place in two distinctive modes. According to them, the desulfurization in a dynamic mode (while the droplet was falling through the slag layer) was much faster than the desulfurization in a static mode (when the droplet stays at the bottom of the slag layer), as seen in Fig. 2(a). They analyzed the desulfurization kinetics using the following first order reaction:
|
d[
%S
]
dt
=-
k
app
A
V
[
%S
]
| (1) |
where [%S],
t, k
app, A, and V are mass pct. of S in the droplet, reaction time, apparent rate constant, reaction interfacial area, and volume of the droplet, respectively. k
app in the dynamic mode was two order higher than that in the static mode. They accounted for such enhanced desulfurization by 1) the contact of fresh slag while falling, 2) enhanced internal circulation in the metal phase, and 3) emulsification of the metal/slag interface which increases the reaction interface.


As was observed, increasing the CaO content in the slag increases the extent of desulfurization as well as the reaction rate, thus, the reaction rate might be partly controlled by the mass transfer in the slag. Moreover, the contact of fresh slag for the free-falling droplet was considered to be partly responsible for the enhanced reaction rate. In a practical point of view, desulfurization should be applied for a large mass of steel. Therefore, it is necessary to examine whether such enhanced desulfurization using droplet can be applicable where many numbers of multiple droplets react with the liquid slag. In the previous investigation by Kang et al.,4) results are only reported for the single droplet reaction. As can be seen in Fig. 2(b), change of the S content in the individual droplet may be similar to that shown in Fig. 2(a). When the individual droplets are merged to form a liquid steel bath, then the averaged S content in the steel bath would be that shown in the Fig. 2(c).
In this regard, the purpose of the present study is to examine desulfurization of liquid steel using multiple droplets with low initial S content, in order to be more practical. In the present study, an experimental equipment was set up, and desulfurization of liquid steel was attempted by falling multiple droplets onto liquid slag. A mathematical model was developed in order to interpret the desulfurization behavior in both modes (dynamic and static) while the multiple droplets react with the liquid slag and are merged at the bottom of the slag, forming a liquid steel bath. Using the model, apparent rate constants for the desulfurization in both modes are evaluated, and it is discussed how the multiple droplet desulfurization could be different to the previous single droplet desulfurization.
2. Experimental
2.1. Materials
Steel sample was made from high purity electrolytic iron and FeS powder in an alumina crucible in an induction furnace under purified Ar atmosphere, in order to obtain samples with approximately [%S]0 = 0.004, 0.006, and 0.012, respectively. Ar gas used in the present study was purified passing through a CaSO4 column, and Mg chip at 723 K. A quartz tube was used to sample part of the liquid steel for S analysis. The remained steel was cooled, cut vertically into two pieces. These were put in the other alumina crucible (OD 0.065 × ID 0.06 × H 0.1 m) for remelting to be used in the desulfurization.
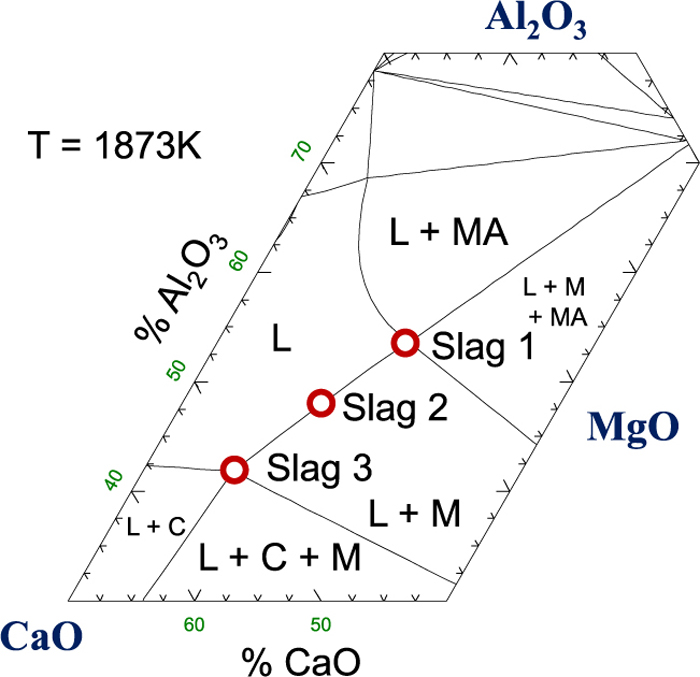
Slag samples were made by mixing powders of Al2O3, MgO, and CaO, which was preliminary calcined from CaCO3. The mixture was melted in a graphite crucible, quenched, ground, and was burned again under air in order to remove trace of C. The slag as much as 0.32 kg was put in a MgO crucible (0.06 × 0.05 × 0.1 m). The slag composition was chosen to vary CaO/Al2O3 ratio as shown in Fig. 3.
2.2. Apparatus for Two-Zone Heating
Experiment for the desulfurization of the liquid steel was carried out in a two-zone heating furnace. A schematic figure of the apparatus is shown in Fig. 4. It is an induction heated furnace, composed of two parts, an upper heating zone and a lower heating zone. Both zones can be heated independently. A reaction chamber was composed of a quartz tube (OD: 0.155 m) sealed by upper and bottom brass end caps. An inner quartz tube (OD: 0.14 m) in the lower zone was to support the upper zone assembly. Two graphite susceptors were used as the heating element in each zone, and those were insulated by alumina tube. The alumina crucible containing the steel sample was put in the upper zone, and the MgO crucible containing the slag was placed in the lower zone. One hole (ϕ = 4 × 10⁻³ m) was drilled at the bottom of the alumina crucible in the upper zone in order to allow the liquid steel to free-fall as droplets. An alumina rod was installed as a stopper in order to close/open the hole. Temperature in each zone was continuously measured by B-type thermocouples (Pt-30Rh/Pt-6Rh). In a preliminary run, a high speed camera was installed in order to record a video for falling droplets from the upper zone to lower zone.

Temperature in each zone was controlled to reach 1873 K. After the steel sample melts completely, the stopper rod was lifted up in order to allow the liquid steel to fall by forming droplets. The droplets were free-falling to the MgO crucible in the lower zone where the slag sample was already molten. During the falling of the steel droplets, only part of the liquid steel fell down to the MgO crucible, while rest part of the steel stayed in the alumina crucible in the upper zone. At each run, mass of remained steel in the upper zone was measured, and mass of fallen steel, W, to the lower zone was obtained by the difference of the masses in the upper zone. After all droplets fell, they were accumulate at the bottom of the slag in the MgO crucible, and they were periodically sampled using quartz tubes, followed by water quenching. The sample was subjected to the analysis of its S content (LECO CS-844 C/S analyzer).
3. Results
3.1. Temperature Profile in Each Reaction Zone
As the temperature of the liquid steel in the upper zone is important for falling droplets, temperature profile of each heating zone was checked in two separate runs. In the first run, only upper zone was heated, and the temperature inside an empty alumina crucible was measured by a B-type thermocouple. In the second run, both zones were heated, and the temperature in an empty alumina (upper zone) and in a MgO (lower zone) were measured. For each measurement, after setting a predetermined temperature via PID controller attached to the induction furnace, the temperature was measured until it approaches at a constant value. The temperature reading was recorded. Then, the thermocouple was lifted up by some distance (one or a few centimeter), and was held at the new position. When the temperature reading was stable, it was also recorded. This procedure was repeated.
The results are shown in Fig. 4. When only the upper zone was heated, there was a significant temperature difference (~55 K) within 0.02 m, due to a severe heat loss through a hole drilled at the bottom of graphite susceptor in the upper zone. When both zones were simultaneously heated, the temperature difference in the upper zone decreased considerably (17 K over 0.013 m, then almost constant temperature over 0.02 m). In actual experiments where two zones were always simultaneously heated, the bottom of the alumina crucible in the upper zone was set to 1873 K.
3.2. Falling of Droplets
3.2.1. Before Entering Liquid Slag Layer
A separate run was tried in order to observe the behavior of droplet falling. The falling droplets were recorded with a high speed camera at a speed of 500 frames per second. Approximately 0.12–0.13 kg of the liquid steel was dropped. The recorded image for this particular run was analyzed using Image J software (ver. 1.32).5) In this trial run, total number of droplets was 244, and the time for falling all of the droplets was 9.252 sec. The appearance of the droplet falling were not identical for all the droplets observed, but roughly could be categorized in three different behaviors as shown in Fig. 5:
1. 0 < t (sec) < 0.526: (Behavior 1) droplets fell down in forms of droplet from the beneath of the hole (Figs. 5(a) and 5(c)).
2. 0.548 < t (sec) < 2.742: (Behavior 2) droplets fell down, first forming a stream followed by forming droplet (Figs. 5(b) and 5(d)).
3. 2.802 < t (sec) < 9.252: (Behavior 3) droplets fell down in forms of droplet from the beneath of the hole, similar to the Behavior 1 (Fig. 5(e)).
From the recorded video, diameter of individual droplet and time interval for each droplet generation were analyzed, and those are shown in Fig. 6. Although there were inherent scatters, in particular for the diameter of droplets, it was tried to summarize the observation as follows. The time interval between each subsequent droplet for the Behaviors 1 and 2 are seen to be similar, in average of 0.020 and 0.013 sec, respectively. The time interval for the Behavior 3 was significantly different, and it increased as the droplet continuously fell. The average diameter of the droplets for the Behaviors 1, 2, and 3 were 5.25 × 10⁻³, 3.81 × 10⁻³, and 7.63 × 10⁻³ m, respectively. It is seen that Behaviors 1 and 2 may be assumed similar each other, while the Behavior 3 should be distinguished. 81% of droplets belong to the former, and 19% of the droplets belong to the latter. In order to utilize this information for the analysis of reaction kinetics as will discussed in the Sec. 4, this information was treated in a simple manner. The average time interval between each subsequent droplet in the Behaviors 1 and 2 (Δt) was assumed to be 0.014 (± 0.006) sec, while that in the Behavior 3 (Δt’) was fitted to give an expression Δt’ = 1.14 × 10⁻³n – 0.118 (sec), where n is the index number of each droplet. The average diameter of droplets in the Behaviors 1 and 2 (d) was 4.004 × 10⁻³ (± 1.299 × 10⁻³) m, while that in the Behavior 3 (d’) was 7.629 × 10⁻³ (± 0.669 × 10⁻³) m. Detailed information regarding the appearance of the droplet falling is seen in the Table 1.

Table 1. Results of image analysis of falling droplets.
| Behaviors 1 and 2 | Behavior 3 |
|---|
| d × 10−3 (m) | Δt (sec) | d’× 10−3 (m) | Δt’ (sec) |
|---|
| Average | 4.004 | 0.014 | 7.629 | –a) |
| Maximum | 9.411 | 0.034 | 8.702 | 0.246 |
| Minimum | 0.941 | –b) | 5.880 | 0.020 |
| Uncertainty | 1.299 | 0.006 | 0.669 | – |
| Total number of droplets | 197 (81%) | 47 (19%) |
a) Δ
t’ = 1.14×10
−3n – 0.118 (sec) where
n is the index number of droplet.
It was assumed in the subsequent analysis that these behaviors (the average diameter, the average time interval, and proportions between the Behaviors) may be applied for the other runs for desulfurization. Only the Δt’ was modified to Δt’ = 1.14 × 10⁻³ (n × 0.123/W) – 0.118 (sec), when the mass of reacted steel, W (kg), was different to that of this test run (0.123 kg). This will be used in the kinetic analysis described in Sec. 4.1. It should be stressed that the estimated time (Δt’) is only applicable for the results obtained in the present study using the equipment shown in the Fig. 4.
3.2.2. After Entering Liquid Slag Layer
In the present study, a time for passing through the slag layer by a droplet was not determined, but a report of the similar study by Kang et al.4) was utilized. They used approximately 0.55 to 0.57 kg slag contained in a MgO crucible (ID: 0.06 m), which resulted in 0.048 to 0.05 m depth of the slag layer assuming the density of slag = 4 × 10³ kg m−3. As seen in Fig. 1, the falling time of a droplet in the slag layer observed by an X-ray fluoroscope was shorter as the mass of droplet was heavier, CaO/Al2O3 of slag was lower, and initial S content in the droplet was lower. The latter two cases were interpreted in such a way that desulfurization reaction at the interface between the droplet and the slag retards the falling of the droplet in the slag layer.4)
In the present study, approximately 0.32 kg slag was melted in a MgO crucible (ID: 0.05 m), which results in 0.041 m depth of the slag. Average mass of droplet was estimated either 2.3 × 10⁻⁴ kg (Behaviors 1 and 2) or 1.62 × 10⁻³ kg (Behavior 3), assuming the density of liquid steel = 7 × 10³ kg m−3. Because the initial S content employed in the present study was lower than those used by Kang et al.,4) it is expected that the falling time of each droplet (Δts) might be shorter. It was assumed to be 0.2 sec, the lower limit of the falling time reported by Kang et al.,4) in the present study for further analysis in Sec. 4.
3.3. Desulfurization of the Steel Droplets by the Liquid Slag Layer
Actual desulfurization tests were carried out by melting approximately 0.4 kg steel in the upper zone, followed by dropping the liquid steel onto the slay layer in the lower zone. When the falling of the droplets was completed, the accumulated liquid steel in the MgO crucible in the lower zone was sampled, and analyzed for S content. Results are shown in this section for a series of experiment by varying 1) initial S content in the liquid steel, 2) CaO/Al2O3 ratio of the CaO–MgO–Al2O3 slag, and 3) mass of steel reacted with the liquid slag. All these results are shown in Figs. 7, 8, 9.

Decreasing S content in the steels with various initial S content is shown in Fig. 7 where the Slag 3 (the highest CaO/Al2O3 ratio) was used. The change of S content obtained by analyzing the steel bath accumulated in the MgO crucible looks similar to that shown in the Fig. 2(c). In the early stage of the desulfurization reaction (t < ~ 20 sec), the S content decreased rapidly, then still decreased but slowly. Clearly, such change of the S content cannot be simply described by a first order reaction rate as seen in the Eq. (1).
Figure 8 shows the desulfurization of the liquid steel ([%S]0 = 0.006) by various slags of CaO/Al2O3 ratio. It is well understood that increasing CaO/Al2O3 ratio increases sulfide capacity of liquid slag.6,7,8) Figure 9 shows how the mass of reacted liquid steel affects the desulfurization, while the mass of the liquid slag (Slag 3) was kept the same. Decreasing the mass of the liquid steel to the half increased the desulfurization rate significantly. The extent of desulfurization was also significantly improved.
4. Discussions
4.1. Model Calculation for Desulfurization when Multiple Droplets Fall through the Slag
In order to evaluate the speed of desulfurization in the dynamic mode, it is necessary to compare the desulfurization rate in the dynamic mode as well as in the static mode. While the previous investigation by Kang et al.4) employing a single droplet revealed that the apparent rate constant, kapp, in the dynamic mode was one or two order higher, it is interesting to test whether it also applies in more general case (large mass of steel generating multiple droplets). However, due to inherent difficulty in the experiment, it was almost not possible to sample the each droplet immersed in the liquid slag. All the droplets first traversed in the slag, but eventually they settled down at the bottom of the crucible and formed a liquid bath. Only the liquid steel bath could be sampled in the present study. While the droplets had formed the liquid steel bath, each droplet had experienced the desulfurization in the dynamic mode followed by the static mode. This situation is schematically shown in Fig. 10. In order to extract the apparent rate constants in both modes, a rough but simple mathematical model was developed in the present study with the following assumptions:

a. Each droplet keeps a spherical shape and does not collide each other during passing through the slag layer (dynamic mode).
b. A time required for passing the slag layer by each droplet is the same as Δts, as discussed in Sec. 3.2.2.
c. While each droplet falls through the slag layer, the slag keeps its desulfurizing potential.
d. When each droplet arrives at the bottom of the crucible, it stays in a form of two hemispheres, until the bottom surface is fully covered by the hemispheres (static mode).
e. Once the bottom surface is fully covered, the accumulated droplets form a liquid bath in a form of cylinder, and subsequently arriving droplets are merged in the liquid bath, increasing the height of the cylinder (static mode).
f. After all the droplets arrived, it keeps the desulfurization in the static mode as usual slag-metal reaction in a vessel.
g. Desulfurization kinetics is described by a first order rate equation.4,9,10,11,12,13)
Along with the above assumptions, the desulfurization of the liquid steel was analyzed and it is shown in the following section. All the symbols are defined in the Nomenclature.
I. Droplets are passing through the slag layer (dynamic mode)
In this stage, the desulfurization rate is described as:
|
d[
%S
]
dt
=-
A
d
V
d
k
d
[
%S
]=-
6
d
k
d
[
%S
]
| (2) |
|
ln
[
%S
]
I
[
%S
]
0
=-
6
d
k
d
Δ
t
s
| (3) |
where d, A
d, and V
d are the diameter (m), surface area (m
2), and volume (m
3) of a droplet, respectively. k
d, [%S]
0, and [%S]
I are the apparent rate constant in the dynamic mode, the initial S content, and the S content just after the droplet passes out of the slag layer, respectively. Therefore, the S content of all the droplets vary from [%S]
0 to [%S]
I, during this stage (dynamic mode), and the droplets arrive at the beneath of the slag layer with the S content as much as [%S]
I.
II. Droplets arrived at the bottom of the crucible accumulate until they completely cover the bottom (dynamic mode + static mode, n ≤ α)
While a first droplet arrives at the bottom, a second droplet follows to pass the slag layer in a time interval of Δt. During this time interval, for the first droplet in the form of two hemispheres:
|
d[
%S
]
dt
=-
A
d
V
d
k
s
[
%S
]
=-
2×(
(
4π
(
d/2
)
2
)
×(
1/2
)
)
2×(
(
(
4π/3
)
×
(
d/2
)
3
)
×(
1/2
)
)
k
s
[
%S
]
=-
6
d
k
s
[
%S
]
| (4) |
|
ln
[
%S
]
II,1
[
%S
]
II,1
0
=-
6
d
k
s
Δt
| (5) |
where k
s is the apparent rate constant in the static mode, [%S]
0II,1 and [%S]
II,1 are the S content in the first (1) steel droplet when it just arrived at the bottom, and that in the one (1) steel droplet when it underwent the desulfurization in the static mode for Δ
t, respectively. At this particular step (only one droplet at the bottom), obviously [%S]
0II,1 = [%S]
I.
After the Δt, the second droplet arrives at the bottom and is assumed to merge with the first droplet. By mass balance consideration,
|
[
%S
]
II,1
ρ
V
d
100
+
[
%S
]
I
ρ
V
d
100
=
[
%S
]
II,2
0
2ρ
V
d
100
| (6) |
|
[
%S
]
II,2
0
=
[
%S
]
II,1
+
[
%S
]
I
2
| (7) |
where [%S]
0II,2 means the S content in the steel composed of 2 droplets, just after the merging. The merged droplets then undergo the static desulfurization until a subsequent droplet arrives. [%S]
I and [%S]
II,1 are obtained by
Eqs. (3) and
(5), respectively, therefore the [%S]
0II,2 can be calculated. Through similar steps of
Eqs. (4),
(5),
(6),
(7), the S content in the accumulated steel droplets can be calculated. In a general form, the S content in
n numbers of merged droplets at the bottom is:
|
[
%S
]
II,n
0
=
(
n-1
)
[
%S
]
II,n-1
+
[
%S
]
I
n
, (
n≤α
)
| (8) |
This calculation is repeated until the bottom of crucible is covered completely by the droplets (
n =
α). The number of droplets required to completely cover the bottom surface (
α) can be estimated as:
|
A=π
(
D
2
)
2
=π
(
d
2
)
2
×2×α
| (9) |
where D and d are the inner diameter of crucible (0.05 m) and diameter of the droplet (4.004 × 10
−3 m). Thus,
α is calculated to be 78. The S content in the accumulated droplets just after the bottom surface was completely covered is:
|
[
%S
]
II,α
0
=
(
α-1
)
[
%S
]
II,α-1
+
[
%S
]
I
α
| (10) |
III. Droplets form a liquid bath and are merging with the coming new droplets until all droplets arrive (dynamic mode + static mode, α < n ≤ δ)
After the bottom surface is completely covered, subsequent droplets still follow to pass the slag layer and to merge with the accumulated droplets. It is assumed that the accumulated droplets form a steel bath in a form of a cylinder (diameter of the bath is the same as D, height is varying as additional droplets merge). As a new droplet merges with the bath while the falling droplet follows the Behaviors 1 and 2:
|
[
%S
]
III,n
0
=
(
n-1
)
[
%S
]
III,n-1
+
[
%S
]
I
n
,(
n=α+1,α+2,⋯
)
| (11) |
where [%S]
III,α = [%S]
II,α. By a first order reaction kinetics for a time Δ
t, the S content in the steel bath composed of
n droplets becomes:
|
ln
[
%S
]
III,n
[
%S
]
III,n
0
=-
A
V
d
×n
k
s
Δt , (α<n≤β)
| (12) |
where A is the inner cross sectional area of the MgO crucible. The difference between the
Eq. (12) and the
Eq. (5) is the reaction interfacial area between the steel and the slag. In the stage III, the reaction interfacial area is assumed to be constant, as large as the inner cross sectional area of the crucible. Eventually, when the last droplet of the Behavior 2 (
β th) merges with the steel droplet, the S content in the bath is:
|
[
%S
]
III,β
=
[
%S
]
III,β
0
×exp(
-
3
D
2
2
d
3
×β
k
s
Δt
)
| (13) |
As was discussed in the Sec. 3.2.1, when the droplet falling behavior changes (Behavior 3,
β <
n), the size of droplet and the time interval were different to those in the Behaviors 1 and 2. In the following discussion, those were distinguished as d’ and Δ
t’, respectively. Similar to the
Eq. (6), the S content in the bath is changed by merging with the newly arrived droplet:
|
[
%S
]
III,β
βρ
V
d
100
+
[
%S
]
I
′
ρ
V′
d
100
=
[
%S
]
III,β
0
ρ(
β
V
d
+
V′
d
)
100
| (14) |
where V’
d is the volume of the droplet formed by the Behavior 3 (V’
d = 4
π/3 × (d’/2)
3), and [%S]’
I is the S content in the droplet formed by the Behavior 3, after just passing out of the slag. After the modified time interval Δ
t’, the S content in the bath changes according to the first order reaction rate equation:
|
[
%S
]
III,β+1
=
[
%S
]
III,β+1
0
×exp(
-
A
(
β
V
d
+
V′
d
)
k
s
Δ
t
′
)
| (15) |
In general case where
n >
β, the S content is expressed as:
|
[
%S
]
III,n-1
ρ(
β
V
d
+(
n-1-β
)
V′
d
)
100
+
[
%S
]
I
′
ρ
V′
d
100
=
[
%S
]
III,n
0
ρ(
β
V
d
+(
n-β
)
V′
d
)
100
| (16) |
|
[
%S
]
III,n
=
[
%S
]
III,n
0
×exp(
-
A
(
β
V
d
+(
n-β
)
V′
d
)
k
s
Δ
t
′
)
| (17) |
The calculation is repeated until all the droplets arrive at the steel bath (
n =
δ).
IV. The liquid bath continues to be desulfurized by the liquid slag on top of the bath (static mode)
Now, no more droplets are supplied, and the desulfurization of the steel bath becomes a normal slag-metal reaction with the constant volume and the constant reaction area. The S content in the steel bath is:
|
[
%S
]=
[
%S
]
III,δ
0
×exp(
-
A
(
β
V
d
+(
δ-β
)
V′
d
)
k
s
(
t-βΔt-(
δ-β
)
Δ
t
′
)
)
| (18) |
where (
t –
βΔ
t – (
δ –
β)Δ
t’) represents the reaction time after all the droplet merged into the steel bath.
In the present experiment, actual sampling of the steel bath was performed after all the droplets accumulated in the steel bath. Therefore, the experimentally obtained S content corresponds to the [%S] in the Eq. (18) at each time t. During the solving the Eq. (18), the previous Eqs. (2), (3), (4), (5), (6), (7), (8), (9), (10), (11), (12), (13), (14), (15), (16), (17) are used. All parameters for the calculations are known, except for the rate constants kd and ks. By fitting the Eq. (18) to the experimental data shown in the Figs. 7, 8, 9, the kd and ks were evaluated. As seen in the Fig. 2, the decrease of experimentally determined [%S] in a later stage corresponded to the results of static desulfurization, which was controlled by the ks. However, the sudden decrease at the beginning of the desulfurization is thought to be contributed by both the dynamic (kd) and the static (ks) desulfurization. Therefore, in the present analysis, the ks was first evaluated by fitting the decreasing rate of [%S], then the kd was evaluated subsequently to reproduce the initial decrease of the S content in the later stage. This process was repeated until a satisfactory reproduction to the experimental data was obtained. The obtained kd and ks for each experimental condition are listed in the Table 2. The calculated S content using the obtained rate constants are shown as lines in the Figs. 11, 12, 13. The calculations are in favorable agreement with the experimental data obtained in the present study. It is evident that the rate in the dynamic mode is much faster than the rate in the static mode.
Table 2. Obtained apparent rate constants for the desulfurization in the dynamic mode (k
d) and the static mode (k
s). Common results (slag 3, W = 0.206 kg, [%S]
0 = 0.006) are in
bold.
| Condition | kd (m sec−1) | ks (m sec−1) | W (kg) | Note |
|---|
| Different initial [%S]0 |
| 0.004 | 0.29 × 10⁻³ | 1.90 × 10⁻⁵ | 0.218 | Fig. 11, with Slag 3, |
| 0.006 | 1.60 × 10⁻³ | 1.00 × 10⁻⁵ | 0.206 |
| 0.012 | 0.30 × 10⁻³ | 1.70 × 10⁻⁵ | 0.217 |
| Different steel mass reacted W, g |
| 206 | 1.60 × 10⁻³ | 1.00 × 10⁻⁵ | 0.206 | Fig. 12, with Slag 3,
[%S]0 = ~ 0.006 |
| 110 | 2.70 × 10⁻³ | 2.50 × 10⁻⁵ | 0.110 |
| 95 | 3.20 × 10⁻³ | 3.00 × 10⁻⁵ | 0.095 |
| Different slag composition |
| Slag 1 | 0.04 × 10⁻³ | 0.46 × 10⁻⁵ | 0.219 | Fig. 13,
[%S]0 = ~ 0.006 |
| Slag 2 | 0.20 × 10⁻³ | 1.70 × 10⁻⁵ | 0.257 |
| Slag 3 | 1.60 × 10⁻³ | 1.00 × 10⁻⁵ | 0.206 |

The obtained rate constants in the static mode (ks) are one or two order lower than those in the dynamic mode (kd). This is in good agreement with the report of Kang et al.4) Moreover, the kd when a slag saturated by CaO and MgO was used (Slag A in their report) was 2.82 × 10⁻³ m sec−1.4) This value is very close to the kd obtained in the present study, 1.60 × 10⁻³ m sec−1 under similar condition (using the Slag 3). Also, the ks values estimated in the present study are in the similar order to that reported by Deng et al.14) (ks = 5.52 × 10⁻⁵ m sec−1). This lends a strong support of the developed model in the present study, although a number of the assumptions. And the enhanced desulfurization in the dynamic mode was also confirmed when there were multiple numbers of droplets.
4.2. Analysis of the Desulfurization in the Dynamic Mode
The enhanced desulfurization in the dynamic mode was attributed to the facts that 1) the contact of fresh slag while falling,4) 2) enhanced internal circulation in the metal phase,2,4) and 3) emulsification of the metal/slag interface which increases the reaction interface.3,4) A few observations in the present study are to be noted in order to further discuss what has played a major role for such enhanced desulfurization in the dynamic mode.
The time required for each droplet to pass though the slag layer was less than 1 second, according to the in-situ X-ray observation by Kang et al.4) On the other hand, the interfacial area change due to severe emulsification of immersed liquid iron was observed after a few tens of seconds (dephosphorization15)) or after a few minutes (Al oxidation by reduction of SiO216)). This time scale was much longer than what was allowed for falling droplets, employed in the study of Kang et al.4) as well as that in the present study. Therefore, the role of the emulsification may be ruled out.
The increase of CaO/Al2O3 ratio in the slag (from Slag 1 to Slag 3) increased the kd significantly, as much as 40 times, while the ks increased only two times. Because the high CaO/Al2O3 ratio in the CaO–MgO–Al2O3 slag results in the high sulfide capacity (CS), it is not difficult to expect that the Slag 3 would result in a faster desulfurization rate. However, such significantly difference in the increase of the rate constants (40 times vs 2 times) should deserve more careful consideration. The slag composition would not significantly alter the internal circulation of steel droplet, thus it is considered that the reason 2) may not play a major role.
Contact of a fresh slag seems to play a significant role in the enhanced desulfurization in the dynamic mode. As shown in the Figs. 11, 12, 13, the model calculations demonstrate the sudden decrease of the [%S] at the beginning of the desulfurization. And from the Fig. 12 and the estimated kd listed in Table 2, it is seen that the slag having high CaO/Al2O3 ratio (or high CS) provides higher kd, resulting in an enhanced desulfurization. This tells that the contact of a fresh slag having high CS is more efficient to enhance the desulfurization. However, it should be stressed that the calculations underestimate [%S] in the earlier stage of the desulfurization (t < ~ 100 sec) in most cases. This may be attributed to the fact that the slag, which continuously had contacted with the falling droplets, gradually had lost its desulfurizing potential. This is because the droplets fell on almost same position on the slag during the experiment, according to the geometry of the equipment. And this had limited the effective volume to be used for the desulfurization in the dynamic mode, and consequently it retarded the desulfurization in the dynamic mode. It subsequently affect the desulfurization in the static mode by introducing the new droplet with higher [%S] (>[%S]I) to the steel bath. This is why the experimentally determined [%S] in the earlier stage was higher than the calculated results.
The above analysis suggests that the mass transfer in the slag phase would have controlled the desulfurization employing the falling droplets through the slag layer. This is reasonable because 1) chemical reaction for desulfurization at high temperature is generally fast,4,9,10,11,12,13) 2) mass transfer of S in the liquid steel droplet required short time to deliver the S to the reaction interface, and 3) diffusion of S in the slag near the passage of the falling droplets is not fast enough to promptly absorb the S from the droplets (See Appendix A).
Consequently, it is evident that the droplets should be dispersed evenly in the slag layer while they are falling, in order to maximize the desulfurization capacity in the dynamic mode. Although the current desulfurizing processes (TLC, KR) try to increase the reaction interfacial area by injection or stirring, utilization of falling steel droplets on the desulfurizing slag would readily achieve such goal: increasing the reaction interfacial area, contacting fresh slag, decreasing time required for mass transfer of S in the steel.
4.3. Influence of Droplet Deformation on the Reaction Rate
It was assumed in the present model analysis that the droplets kept a sphere shape when it passed through the slag layer, and keep a hemisphere shape when it stayed at the bottom of the crucible before it forms a steel bath. However, the droplets might be deformed during the above moments, and have resulted in enlargement of reaction interfacial area, followed by resulting in the desulfurization rate. In order to confirm this, a test was made using the model equation with intentionally increased reaction interfacial area during the above moments. While keeping all other parameters to be the same as previously used, only the area (Ad) and the kd were allowed to vary in order to get satisfactory agreement with the experimental data. The increase of the area up to five times affected the value of kd negligible (ex., 1.60 × 10⁻³ to 1.56 × 10⁻³). This may alter the calculated [%S] shown in the Figs. 11, 12, 13, but negligibly. Therefore, in the present study, such deformation of the falling droplets could be neglected in the analysis of desulfurization.
5. Conclusions
Enhancement of desulfurization of liquid steel was attempted by using steel droplets passing through a slag layer, which has been suggested by Kang et al.4) In order to test this idea in more practical condition with a large mass of the steel, in the present study, the desulfurization employing multiple steel droplets were investigated by experiments and mathematical analysis. The following conclusions were obtained.
(1) There were two distinctive modes of desulfurization, namely a dynamic mode (the desulfurization occurred while steel droplets were falling the slag layer) and a static mode (the desulfurization occurred while the steel accumulated at the bottom of the reaction crucible).
(2) A rough but simple mathematical model was developed in order to analysis the reaction kinetics, which simultaneously takes into account the dynamic and static modes of desulfurization of multiple steel droplets.
(3) Estimated apparent rate constants for the dynamic mode (kd) was one or two orders higher than that for the static mode (ks), and this is in good agreement with the previous investigation.4)
(4) In the dynamic mode of desulfurization, the diffusion of S in the slag phase may control the reaction rate. This suggests that even distribution of steel droplets in the slag layer is beneficial to increase overall desulfurization rate.
Acknowledgement
This work was financially supported by POSCO Ltd., and valuable discussions with Drs. Jeong-Do Seo and Ja-Yong Choi, Technical Research Laboratories, POSCO Ltd. are acknowledged. This work was inspired by an earlier investigation by Professor Emeritus Hae-Geon Lee, GIFT, POSTECH.
Nomenclature
α: Number of droplets enough for covering the bottom surface of the MgO crucible
β: Number of droplets showing the Behaviors 1 and 2 (γ > α in the present study)
γ: Number of droplets showing the Behavior 3
δ: Total number of droplets fallen (δ = β + γ)
ρ: Density of the liquid steel, kg m−3
A: Inner cross sectional area of the MgO crucible in the lower zone, m2
Ad: Surface area of a droplet, m2
d: Diameter of a droplet in the Behaviors 1 and 2, m
d’: Diameter of a droplet in the Behavior 3, m
D: Inner diameter of the MgO crucible in the lower zone, m2
DS: Diffusivity of S in slag, m2 sec−1
L: Approximate diffusion length of S in slag while droplets fall, m
kapp: Apparent rate constant for desulfurization in a general first order rate equation, m sec−1
kd: Apparent rate constant for desulfurization in the dynamic mode, m sec−1
ks: Apparent rate constant for desulfurization in the static mode, m sec−1
n: index number of each droplet (1 ≤ n ≤ δ)
[%S]: Mass pct. of S in the liquid steel
[%S]0: Initial [%S]
[%S]I: [%S] in a droplet after passing through the slag layer in the Behaviors 1 and 2.
[%S]’I: [%S] in a droplet after passing through the slag layer in the Behavior 3.
[%S]0II,n: [%S] in a steel bath made by n droplets, accumulated at the bottom of the MgO crucible during the stage II, just after merging with a new steel droplet (n th)
[%S]II,n: [%S] in a steel bath made by n droplets, accumulated at the bottom of the MgO crucible during the stage II, before merging a new steel droplet (n+1 th)
[%S]0III,n: [%S] in a steel bath made by n droplets, accumulated at the bottom of the MgO crucible during the stage III, just after merging with a new steel droplet (n th)
[%S]III,n: [%S] in a steel bath made by n droplets, accumulated at the bottom of the MgO crucible during the stage III, before merging a new steel droplet (n+1 th)
[%S]0IV: [%S] in a steel bath made by δ droplets, accumulated at the bottom of the MgO crucible during the stage IV, just after merging with a last droplet (δ th)
[%S]IV: [%S] in a steel bath made by δ droplets, accumulated at the bottom of the MgO crucible during the stage IV, after time t
t: A reaction time, sec
Δt: A time interval between each droplet formation in the Behaviors 1 and 2, sec
Δt’: A time interval between each droplet formation in the Behavior 3, sec
Δts: A time taken for a droplet passing through the slag layer, from the top of the slag to the bottom of the slag, sec
Vd: Volume of a droplet in the Behaviors 1 and 2, m3
V’d: Volume of a droplet in the Behavior 3, m3
W: Mass of steel reacted with liquid slag, kg
Appendix A.
Estimation of S Diffusion in a Slag while Steel Droplets Pass through the Slag Layer
The purpose of this appendix is to evaluate how fast S could be absorbed in the slag while the steel droplets are falling (dynamic mode). It is assumed that 1) a reaction S = (S2−) is fast, 2) the steel droplet keeps its shape as a sphere of diameter d (= 4 × 10⁻³ m), 3) all the steel droplets pass through a same passage, and 4) up to 0.1 mass pct. of S can be absorbed into the slag without decreasing rate of S absorption. An example calculation is demonstrated to show that mass transfer of S in the slag by diffusion is not fast enough to absorb the S transferred from the falling steel droplets.
Impurity diffusion coefficient of S is known for CaO–Al2O3–SiO2 slag,17) and it is also assumed that the diffusion coefficient of S in the CaO–Al2O3–MgO slag used in the present study is not very different from the former.
|
D
S
=
D
0
exp(
-
E
D
RT
)
| (A.1) |
where D
0 and E
D are 10
−3.85 m
2 sec
−1 and 205 kJ mol
−1, respectively.
17) Thus,
DS at 1873 K is 2.71 × 10
−10 m
2 sec
−1. While the steel droplet containing S pass through the slag layer, it may be thought that the S diffuses in the slag to a direction perpendicular to the movement of the droplet. The diffusion length may be estimated:
where t is taken to be 10 sec, the time taken for all droplets passing through the slag layer. The calculated
L is 1.04 × 10
−4 m. Roughly, the slag volume which absorbs S is estimated to be a pipe shape whose outer diameter, inner diameter, and height are d + 2
L, d, and 4.1 × 10
−2 m (See Sec. 3.2.2). Along with an approximate slag density of 4 × 10
3 kg m
−3, the mass of the slag absorbing S and the mass of S absorbed are 8.7 × 10
−4 kg and 8.7 × 10
−7 kg, respectively. The latter is much less than the mass of S contained in steel droplets (1.2 × 10
−5 kg, from 0.2 kg steel of 60 ppm initial S content). Therefore, the slag volume secured by diffusion of S is thought to be small to absorb the S while the droplets pass through the passage made by the slag volume. This limits the desulfurization of the liquid steel in the dynamic mode.
References
- 1) P. J. Koros: The Making, Shaping and Treating of Steel, Steelmaking and Refining Volume, 11th ed., ed. by R. J. Fruehan, AISE Steel Foundation, Pittsburgh, PA, (1998), Ch. 7.
- 2) E. T. Turkdogan, G. J. W. Kor and R. J. Fruehan: Ironmaking Steelmaking, 10 (1980), 268.
- 3) A. Wu, P. C. Hayes and H.-G. Lee: ISIJ Int., 38 (1998), 213.
- 4) S.-M. Kang, D.-Y. Kim, J.-S. Kim and H.-G. Lee: ISIJ Int., 43 (2003), 1683.
- 5) Image J, Ver. 1.32, NIH, USA, http://imagej.nih.gov/ij/index.html, (accessed 2014-07-01).
- 6) M. Nzotta: Scand. J. Metall., 26 (1997), 169.
- 7) M. Hino, S. Kitagawa and S. Ban-Ya: ISIJ Int., 33 (1993), 36.
- 8) Y.-B. Kang and A. D. Pelton: Metall. Mater. Trans. B, 40B (2009), 979.
- 9) M. G. Frohberg and A. Nilas: Trans. Iron Steel Inst. Jpn., 9 (1969), 355.
- 10) J. C. Fulton and J. Chipman: Trans. Metall. Soc. AIME, 215 (1959), 113.
- 11) B. Deo and P. Grieveson: Steel Res., 57 (1986), 514.
- 12) B. Deo and P. Grieveson: Steel Res., 59 (1988), 263.
- 13) J.-K. Jung and J. J. Pak: J. Kor. Inst. Met. Mater., 38 (2000), 585.
- 14) J. Deng and F. Oeters: Steel Res., 61 (1990), 438.
- 15) A. N. Assis, J. Warnett, S. Spooner, R. J. Fruehan, M. A. Williams and S. Sridhar: Metall. Mater. Trans. B, 46B (2015), 568.
- 16) M. A. Rhamdhani, G. A. Brook and K. S. Coley: Metall. Mater. Trans. B, 37B (2006), 1087.
- 17) K. Nagata, Y. Ono, T. Ejima and T. Yamamura: Handbook of Physico-chemical Properties, ed. by Y. Kawai and Y. Shiraishi, ISIJ, Tokyo, (1998), Ch. 7.
- 18) C. W. Bale, E. Belisle, P. Chartrand, S. A. Decterov, G. Eriksson, K. Hack, I.-H. Jung, Y.-B. Kang, J. Melancon, A. D. Pelton, C. Robelin and S. Petersen: Calphad, 33 (2009), 295.
- 19) I.-H. Jung, S. A. Decterov and A. D. Pelton: J. Phase Equil. Diff., 25 (2004), 329.