2. Experiment of Single Roll Driven Rolling
2.1. Experiment Overview
Model cold rolling experiment was done according to the conditions shown in Table 1. In this experiment, aluminum strips were rolled with thickness reduction ratio from 2% to 40% without lubrication.
Table 1. Experimental conditions.
| Rolled material | Aluminum (A1050-H24) |
| Material dimensions [mm] | 3.0t×50w×1250L |
| Roll diameters [mm] | Work roll : 80 |
| Backup roll : 160 |
| Drive mode | 1.Top driven/Bottom idle
2.Top idle/Bottom driven |
| Reduction in thickness [%] | 2, 5, 7, 10, 15, 20, 30, 40 |
| Peripheral speed of driven WR [rpm] | 4.0 |
| Lubrication | Dry |
Figure 1 shows the schematic view of the experiment. In order to carry out single roll driven rolling, a joint which connected a WR and a mill motor of the twin drive rolling mill was detached from spindle. In order to investigate the effect of the weight of the material, rolling experiments were carried out in the conditions of top roll driven – bottom roll idle and top roll idle – bottom roll driven. Rotary encoders were attached directly to both top and bottom WRs to measure precise change of peripheral speed of the rolls. Rolling was conducted for approximately six seconds after front-end of material was rolled in, and then finished by stopping mill motor during rolling.
2.2. Results
Figure 2 shows the warped shapes of rolled strips. The fact that the warped shapes exhibit almost symmetrical behavior corresponding to the drive condition of WRs indicates that the effect of the weight of the material is not significant under the current rolling conditions.
Figure 3 shows the relationship between shape factor and curvature of rolled shapes. The shape factor Γ is defined as ratio of contact arc length ld to strip average thickness hm as shown in Eqs. (1), (2), (3), where, ld, hm, R’, H and h denote contact arc length, average strip thickness, flattened roll radius, entry-side thickness and delivery-side thickness, respectively. R’ is calculated by Hitchcock’s roll flattening equation using measured rolling force. As shown in Fig. 4, warped shape of a rolled strip is approximated as an arc with radius of curvature ρ. In Fig. 3, the radius of curvature ρ of the warpage is normalized using the WR radius R.
According to Fig. 3, when shape factor is smaller than 1.2, rolled strip tends to curve toward the idle roll side. On the other hand, when shape factor is larger than 1.2, direction of warpage is reversed and rolled strip tends to curve toward the driven roll side.
In order to understand this warpage behavior, an investigation was carried out concerning the peripheral speed of work roll and the forward slip ratio.
2.2.1. Peripheral Speed of WR
Figure 5 shows an example of peripheral speed of WRs measured by rotary encoders. After about four seconds from the start of data measurement, front-end of material enters into the roll-bite, and then the top WR (idle) starts to rotate. The peripheral speed of the top WR is always lower than that of the bottom WR (driven), that is, the differential speed rolling is realized. Note that immediately after the material enters to the roll-bite, the peripheral speed of the bottom WR on the driven side decelerates for approximately 0.3 seconds. It is considered that this is due to the so-called impact drop phenomenon whereby the peripheral speed of the WR falls when the rolling torque on the mill motor increases abruptly as a result of front-end of material entry into the roll-bite. The warped shapes evaluated in Fig. 2 or Fig. 3 apparently includes the part of the material that is rolled with the non-steady-state peripheral speeds. As can be judged from Fig. 2, this length is much shorter than the rolled length over which the curvature of the warpage is evaluated. Also, no pronounced variations in the warped shape of the rolled strips are observed in the part concerned. Taking these facts into account, it is considered that the effects of the non-steady-state rolling conditions immediately after the beginning of rolling of the material front-end on its warpage behavior can be ignored throughout this report.

Figure 6(a) shows relationship between the shape factor Γ and ratio of peripheral speed of WRs measured by rotary encoders. The measured speeds are divided by the target peripheral speed of the driven WR. Figure 6(b) shows relationship between the shape factor and differential speed ratio χ. Here, the differential speed ratio χ is defined as ratio of difference between the top roll speed VT and the bottom roll speed VB divided by the higher roll (driven roll) speed VHi, as shown in Eq. (4).
|
χ=(
V
T
-
V
B
)
/
V
Hi
| (4) |
According to these figures, with the increase of the shape factor, the speed difference between top and bottom WR increases. Especially, it is observed that measured speed of idle roll begins to decrease markedly in the vicinity where the shape factor exceeds 1.2.
Then, it is found that single roll driven rolling makes a state of differential speed rolling, and idle roll always serves as a lower speed roll. Also it is proved from this experiment that differential speed ratio increases as reduction in thickness increases.
2.2.2. Forward Slip Ratio
Forward slip ratio is calculated by measuring interval of imprinted lines on the rolled strip surfaces of the scribed lines scratched on WR surfaces. Figure 7(a) shows the relationship between the shape factor and the forward slip ratio, and Fig. 7(b) shows difference in forward slip ratio between top and bottom roll side. When the shape factor is 1 or less, the forward slip ratio on the side of the driven roll is slightly larger than that of the idle roll, but when the shape factor exceeds 1, the top-and-bottom difference in the forward slip ratio is reversed and the forward slip ratio on the side of the idle roll becomes larger than that of driven roll. Furthermore, as the shape factor increases further, the forward slip ratio on the driven roll side gradually tends to zero, and on the contrary, the forward slip ratio on the idle roll side monotonically increases with the shape factor, and thus difference in the forward slip ratio between top and bottom roll side expands.
3. Single Roll Driven Rolling Analysis Using Rigid Plastic Finite Element Method
In the previous chapter, details of the warpage behavior and characteristics of sheet material deformation during single roll driven rolling was observed precisely through various experimental results of sheet warpage curvature, peripheral speed of WRs, and forward slip ratio. In this chapter, numerical analyses were done using rigid plastic finite element method to clarify the stress and strain distributions evolved around the roll-bite in the single roll driven rolling, and also to discuss the mechanism of the warpage behavior.
3.1. Analytical Conditions
Calculations were carried out by rigid plasticity FEM codes12) reported by Yamada et al. 2-dimensional (plane strain) steady-state rolling analyses were done under the conditions shown in Table 2. The analytical conditions were set according to the model rolling mill dimensions and the experimental conditions described in the previous sections. WRs were assumed to be rigid. The peripheral speed of top WR (idle) was adjusted using iterative scheme incorporated with the contact analysis scheme (adjusting positions of both ends of contact regions and updating streamline profiles) into the steady-state rolling analysis flow.12) The adjustment was done until absolute value of rolling torque of top WR (idle) became less than the value of 0.02 times the value of bottom WR (driven). Number of element discretization of the sheet material analyzed was 60 in thickness direction and 30 to 120 (depending on the contact length) in rolling direction within the roll-bite. The yield stress was calculated with an exponential equation approximated from measured stress-strain curve obtained using tensile test of the material. Three values were set for the friction coefficient (coulomb’s law) tentatively and it was decided to select appropriate value for the friction coefficient based on a comparison between analytical results and experimental results.
Table 2. Analysis conditions.
| Material thickness [mm] | 3.0 |
| Roll diameter [mm] | Work roll : 80 |
| Drive mode | Top idle/Bottom driven |
| Reduction in thickness [%] | 2, 5, 7, 10, 15, 20, 30, 40 |
| Peripheral speed of driven WR [rpm] | 4.0 [Bottom] |
| Yield stress [MPa] | 158.9ε0.063
(ε: Equivalent strain) |
| Friction coefficient | 0.2, 0.3, 0.4 |
Figure 8 shows relation between numerical results of normalized curvature and the shape factor Γ, in comparison with the experimental ones described in the previous sections. The phenomenon whereby the direction change of sheet warpage with increasing the shape factor Γ observed in the experimental results is reproduced using the FE-code. In addition, numerical values of the curvature reveal quantitative agreement with experimental ones, except the region around the shape factor Γ is between 1.0 and 2.0 where the curvature changes abruptly.
This excellent accuracy of warpage prediction by the rigid-plastic FEM code can be attributed to the following improvements of the code compared to the previous reports.6,13)
(1) Regarding boundary conditions on the delivery section of the analysis area, both the warping moment and the shearing force exerted on the section were set free in case of the current FE-code, while only the moment was set free in case of the FE-code used in the previous reports.
(2) Rigorous numerical scheme for the contact analysis was developed and implemented, so calculation accuracy was improved owing to exact positioning of the entrance and exit of the roll-bite.
(3) Concerning element partitioning, number of elements was increased by roughly a factor of 10 in both the sheet thickness direction and the rolling direction compared to that adopted in the previous reports.
Figure 8 reveals that the best match between the experimental results and the analysis results of the curvature can be obtained by setting friction coefficient value to 0.2. In the following figures, all the analytical results presented are obtained with the friction coefficient value of 0.2.
The analytical results of rolling torque and forward slip ratio were also compared with the experimental ones. As shown in Figs. 9(a) and 9(b), quantitative agreement between the experimental results and the analysis results is observed.
3.3. Discussion about Strip Warpage Behavior in Single Roll Driven Rolling
3.3.1. Characterization of Rolling Torque Relating with Peripheral Speed of WR and Forward Slip Ratio
Here, a discussion of the features of single roll driven rolling obtained from both the experiment and numerical calculation is carried out from the viewpoint of the rolling torque.
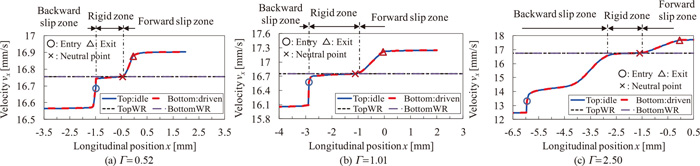
The resultant force of normal pressure that acts on the contact surfaces between WRs and rolled material surfaces roughly goes toward the center of each WR. Consequently, it does not contribute to rolling torque. Rather, it is frictional stress acting on boundary surfaces between the WRs and the rolled material that contributes to rolling torque. Figure 10 shows frictional stress corresponding to two shape factor (Γ=1.01, 2.50) that acts on top and bottom surfaces of the material being rolled in the roll-bite, analyzed when the top WR is idle as shown in Table 2. Here, origin of longitudinal position x is defined at the position of upstream-most delivery end point among two contact regions on top and bottom surfaces of the rolled material. The position x increases along rolling direction.

On the contact surface with the idle WR in the single roll driven rolling, rolling torque is set to zero, which causes the resultant force due to frictional stresses acting on the forward slip zone balances with that on the backward slip zone. On the other hand, on the contact surface with the driven WR, since all of torque that is required for rolling is necessary to be provided, the region over which frictional stress acts on the rolled material in the rolling direction, in other words, the backward slip zone, becomes even wider than the forward slip zone. If reduction in thickness is larger and the shape factor increases, the necessary rolling torque will become even larger. Consequently, as can also be seen from Figs. 10(a) and 10(b), difference in length between the backward slip zone and the forward slip zone on driven WR side surface increases further, and the neutral point approaches the roll-bite exit.
As speed at entrance side of the material is the same both top and bottom surfaces, the fact that the backward slip zone becomes wider, indicating backward slip ratio becoming larger, is equivalent that the WR speed becomes higher. In other words, when reduction in thickness increases and shape factor increases, the driven WR speed increases compared with the material speed or peripheral speed of the idle WR. Consequently, by considering peripheral speed at the driven WR as a reference, the idle WR relatively slows down, thus allowing for the results of Fig. 6 to be explained.
Also, as the neutral point always exists at roughly center of the contact arc length on the idle WR side, the forward slip ratio increases monotonically along with increase in reduction in thickness, i.e., increase in the shape factor. On the other hand, on the driven WR side, rolling torque increases along with increase in reduction in thickness, i.e., increase in the shape factor. Consequently, the backward slip zone becomes wider, the neutral point moves to roll-bite exit, and the forward slip ratio progressively approaches zero, allowing for the result of Fig. 7 to be understood.
3.3.2. Characterization of Material Plastic Deformation Behavior in Roll-bite, and Investigation of Mechanism of Strip Warpage Behavior in Single Roll Driven Rolling
3.3.2.1. Characterization of Material Plastic Flow during Rolling by Focusing Attention on Shear Bands and Sheet Warping Behavior
To study mechanism of warpage behavior in asymmetrical rolling, it is useful to observe stress and strain distributions in the roll-bite with reference to that of symmetrical rolling. There exist prior literatures2,3) which showed that configuration of slip lines (a plastic strain concentrated band) due to plastic deformation generated inside the roll-bite has a crucial effect on warpage behavior. Based on this information as reference, Fig. 11 shows equivalent plastic strain rate distribution in case of symmetrical rolling calculated under the rolling conditions of Table 2, and Fig. 12 shows equivalent plastic strain rate distribution in case of asymmetrical rolling where top WR is idle as shown in Table 2, for three representative shape factors (Γ=0.52: virtually no warpage, Γ=1.01: maximum upward warpage, Γ=2.50: maximum downward warpage; saturation). Note that from here on, rolling direction is denoted as x-direction, and thickness direction is denoted as y-direction.

From Figs. 11 and 12, it can be seen that narrow band-like areas in which equivalent plastic strain rate is concentrated emanate from top and bottom surfaces of the rolled material at entrances of the roll-bite, and propagate into the rolled material at an angle of roughly 45 deg. to the rolling direction, then intersect each other at the center of thickness, and proceed to the material surfaces on the opposite side.
A further discussion of band-like areas with concentrated plastic strain rate follows: Figs. 13 and 14 use contour figures to indicate magnitude of principal shear strain rate, and also use arrows to indicate direction of principal shear stress. Figure 13 is for symmetrical rolling, and Fig. 14 is for asymmetrical rolling with top WR idle condition. By comparing these figures with equivalent plastic strain rate distribution of Figs. 11 and 12, it is possible to confirm that essence of equivalent plastic strain rate is roughly the same as principal shear strain rate. In other words, the band-like area with concentrated plastic strain rate can be regarded as so-called shear band in which shear plastic deformation is concentrated. In addition, direction of principal shear stress shown in Figs. 13 and 14 coincides roughly with the direction of propagation of the shear bands, and it can also be confirmed that almost all shear deformation at each shear band is generated in a direction along the shear band.


Figures 15 and 16 show speed in the rolling direction of top and bottom surfaces of the material in the roll-bite. Figure 15 is for symmetrical rolling, and Fig. 16 is for asymmetrical rolling with top roll idle condition. By comparing Figs. 11, 13 and 15 with Figs. 12, 14, and 16, it can be observed that speed of the material surface changes intensively at location where shear bands intersect with the material surface. As mentioned above, almost all shear deformation in the roll-bite is generated in a direction along each shear band, hence, it is understood that shear band configuration inclined with respect to the reduction direction causes increase in material speed in the rolling direction. As a result of this observation, observed material speed distribution differs from distribution that is stipulated in the classical rolling theory based on the slab method. Since this conclusion is obtained through elaborate analyses of material deformation in the roll-bite using the rigid plastic FEM, it is believed that the conclusion prevails over the classical rolling theory.

Here, a further discussion is made with attention focused on the phenomenon of rolling warpage. As can be seen from Figs. 11, 12, explicit shear bands inevitably bring out non-deformed zones generated in the vicinity of surface of the rolled material at the center of the roll-bite. Also, according to Figs. 15 and 16, it is observed that surface speed of the material coincides with WR speed in the non-deformed zone that is the closest to the roll-bite exit, and that roll-bite exit speed of the material is determined by adding a speed change caused by the shear bands generated between the non-deformed zone and the exit of the roll-bite. Direction and curvature of warpage are determined by difference in top and bottom speeds at the roll-bite exit. Hence, according to Figs. 14 and 16, it is clearly understood that, in case of top WR idle condition, when the shape factor is Γ=1.01, material speed in the non-deformed zone near the roll-bite exit on the bottom surface is already larger than that on the top surface because driven roll speed is always larger than idle roll speed, and, in addition, that speed increase at shear bands at the roll-bite exit for the bottom surface causes the material to warp in upward direction.
Now discussion will focus on the warping behavior for the rolling condition where the shape factor is Γ=2.50 and the top roll is idle. In this case, in the vicinity of the roll-bite exit, it is observed from Fig. 14 that an intensive shear band exists only on the top surface of the material, and increase in the material speed on the top surface becomes prominent, while no noticeable shear band is observed on the bottom surface of the material in the vicinity of the roll-bite exit. However, regarding WR and the material speed, as the driven WR on the bottom side is faster than the idle WR on the top side, there remains a question concerning whether or not the material speed on the top surface overtakes WR speed on the bottom side, i.e., material speed on the bottom surface. In order to understand the mechanism of downward warpage in this rolling condition, the question has to be answered clearly. Figure 17 shows material velocity distribution along the rolling direction when the shape factor is Γ=2.50, under the condition in symmetrical rolling and also in top WR idle rolling. This figure also shows distribution of magnitude of principal shear strain rate indicated in Figs. 13 and 14, using contour lines. Also, dotted line in the figure indicates position where the speed of the material coincides with the driven WR speed.

In Fig. 17(b) for top WR idle condition, it can be seen that the material speed accelerates along the boundary between the shear band in the vicinity of the roll-bite exit and non-deformed zone at the exit from the bottom surface to the top surface. The material speed at the bottom surface is roughly equal to the bottom WR speed at the exit side of the shear band, and also virtually equal to the material speed at the roll-bite exit on the bottom surface. Accordingly, starting from the bottom surface, the material progressively accelerates along the boundary between the shear band and the non-deformed zone at the exit until it reaches the top surface. As a result, the material exit speed at the top surface becomes higher than that at the bottom surface, and this explains downward warpage.
However, looking at Fig. 17(a) for symmetrical rolling, no acceleration of material speed can be observed along the boundary between the shear band in the vicinity of the roll-bite exit and the non-deformed zone at the exit. The following is a discussion concerning this difference in material speed behavior between top WR idle condition and symmetrical rolling condition.
Figure 18 shows definitions of material speed components and coordinate system at the boundary between the shear band in the vicinity of the roll-bite exit and the non-deformed zone at the exit. The coordinate perpendicular to the boundary is defined as ξ, material speed component in ξ direction as vξ, the coordinate along the boundary as η, and material speed component in η direction as vη. And material speed components νx and νy are defined in the rolling direction x and the thickness direction y, respectively.
In view of material warpage behavior, material speed in the rolling direction vx and its variation in η direction are currently at issue. Since the material speed in the rolling direction vx expressed as
v
x
=
v
ξ
𝓁
ξ
+
v
η
𝓁
η
, where
𝓁
ξ
and
𝓁
η
are directional cosines of ξ axis and η axis with respect to x axis, following equation can be obtained.
|
∂
v
x
∂η
=
∂
v
ξ
∂η
𝓁
ξ
+
∂
v
η
∂η
𝓁
η
| (5) |
On the other hand, shear strain rate
ε
˙
ξη
along the shear band is calculated by the following equation.
|
ε
˙
ξη
=
1
2
(
∂
v
ξ
∂η
+
∂
v
η
∂ξ
)
| (6) |
From
Eq. (6), following relationship is obtained.
|
∂
v
ξ
∂η
=2
ε
˙
ξη
-
∂
v
η
∂ξ
| (7) |
Consequently, by substituting this equation into
Eq. (5), following equation is obtained.
|
∂
v
x
∂η
=2
ε
˙
ξη
𝓁
ξ
-
∂
v
η
∂ξ
𝓁
ξ
+
∂
v
η
∂η
𝓁
η
=2
ε
˙
ξη
𝓁
ξ
-
∂
v
η
∂ξ
𝓁
ξ
-
∂
v
ξ
∂ξ
𝓁
η
| (8) |
Note that law of conservation of volume that is expressed by the following equation was used to obtain the last term of
Eq. (8).
|
∂
v
ξ
∂ξ
+
∂
v
η
∂η
=0
| (9) |
The partial derivatives with respect to
ξ of the material speed component on the right side of
Eq. (8) should be zero to accommodate boundary condition of the shear band connected to the non-deformation zone as we can confirm in
Figs. 14 and
15. Consequently, the following equation is obtained.
|
∂
v
x
∂η
=2
ε
˙
ξη
𝓁
ξ
| (10) |
means that acceleration of the material speed along the boundary between the shear band and the non-deformed zone at the exit is equivalent to shear strain rate. As confirmed in
Figs. 11,
12,
13,
14, the essence of rolling deformation is shear deformation along the shear bands. Consequently, acceleration of material speed along the shear band is tantamount to promotion of rolling deformation itself. On the other hand, as downstream side of the boundary of the shear band is the non-deformation zone, in order to allow relationship
∂
v
x
/
∂η
≠0, it is necessary that the exit side material rotate as a rigid body. In other words, it can be understood that occurrence of warpage promotes rolling deformation. In the case of symmetrical rolling, on the other hand, shear bands intersect at the center of thickness, resulting in symmetry in the vertical direction. Consequently, top and bottom of material constrain each other, and relationship
∂
v
x
/
∂η
=0 holds. In other words, warpage does not occur. From the foregoing discussion, it can be understood that acceleration of material speed at the boundary between the shear band in the vicinity of the roll-bite exit and the non-deformed zone at the exit occurs under top WR idle condition, and in the case where top and bottom peripheral speed is same, acceleration does not occur.
3.3.2.2. Discussion about Mechanism of Formation of the Shear Bands and Warpage Behavior in Connection with Shear Stress Field Around Roll-bite
Up to now, relationship between material warpage behavior and shear bands is discussed. Next, discussion is carried out concerning relationship between configuration of the shear bands and rolling conditions. To ensure that material is extended in the rolling direction, in other words, to ensure that rolling takes place, it is necessary that shear bands be inclined with respect to reduction direction and penetrate material in thickness direction, resulting in entire cross-section undergoing plastic deformation. These shear bands occur due to deviatoric stress applied to the rolled material. In case of 2-dimensional problem in x-y coordinate system, independent variables of the deviatoric stress tensor are difference in normal stresses σx-σy and shear stress τxy. Of these, τxy is particularly important as it has direct relationship with drive mode of WR.
Figure 19 shows shear stress τxy distribution in x-y coordinate system in symmetric rolling conditions, and Fig. 20 shows shear stress τxy distribution in x-y coordinate system when top WR is idle, for each shape factor. The figures also show distribution of magnitude of principal shear strain rate indicated in both Figs. 13 and 14, using contour lines.


In the following passage, discussion is carried out concerning relationship between the shear stress field and the shear bands referring to Figs. 13, 14, 19 and 20. In case of symmetrical rolling conditions, when the shape factors are Γ=0.52 and Γ=1.01, positive shear stress fields emanate from a pre-deformation zone on the bottom surface of the roll-bite entrance toward the material thickness center and also from the top surface of the backward slip region in the roll-bite into the material thickness toward the exit of the roll-bite. The pre-deformation zone is defined as plastically deforming region just before the rolled material makes contact with WR. Also, negative shear stress fields emanate from a pre-deformation zone on the top surface of the roll-bite entrance toward the material thickness center and also from the bottom surface of the backward slip region in the roll-bite into the material thickness toward the exit of the roll-bite. With above observation of the shear stress fields, it is found that each shear band emanates from the pre-deformation zone and penetrates thickness by threading its way through shear stress zones of the same sign. In the case where the shape factor is Γ=2.50, in addition to shear stress fields similar to that of Γ=0.52 and Γ=1.01, characteristic shear stress fields occur in the forward-slip zone in the roll-bite, resulting in shear bands that stretches round through the material thickness while proceeding from entry to exit of the roll-bite: bottom → top → bottom, and top → bottom → top. In other words, regarding the shear bands, it is understood that, with the pre-deformation zone as a starting point, the shear band propagates through the material thickness searching for shear stress fields of the same sign toward the exit of the roll-bite.
In case of top WR idle condition, when shape factor is Γ=1.01, since frictional force acting on the backward slip region of the rolled material from the bottom driven WR has to become large compared to that of the symmetrical rolling for supplying rolling torque with the bottom WR only, the negative shear stress field emanated from the backward slip zone on the bottom WR becomes also larger than that on the top WR. As a result, a strong shear band that penetrates material thickness is formed from the pre-deformation zone on the top material surface toward the negative shear stress field emanated from the backward slip zone on the bottom WR. Consequently, the plastic deformation on the bottom surface of the material in the vicinity of the roll-bite exit intensifies, widening difference in velocity of the material at the roll-bite exit on top and bottom surfaces, and the difference becomes even greater than peripheral speed difference between top and bottom WRs, thus causing the rolled material to warp in upward direction. When the shape factor is Γ=2.50, as rolling torque increases with increase of reduction in thickness, the backward slip zone on the bottom WR that supplies rolling torque increases in length. In other words, the neutral point on the bottom WR side approaches the roll-bite exit, and the negative shear stress zone corresponding to rolling torque widens while forward slip zone and positive shear stress zone virtually disappears. As a result, shear bands are not generated in the vicinity of the roll-bite exit on the bottom surface of the material, but instead shear bands in the vicinity of the roll-bite exit on the top surface coming from the bottom surface of the material in the middle of the roll-bite become intensified, and as mentioned above, material in the vicinity of the roll-bite exit on the top surface is accelerated, resulting in downward warpage.
3.3.2.3. Discussion about Mechanism of the Shear Stress Field Generation
It is understood that the shear band configuration, which governs warpage behavior, is determined by the shear stress field in the roll-bite. Accordingly, mechanism for determining configuration of the shear stress field will be discussed here making reference to Figs. 19 and 20.
Under all of shape factor conditions, a prominent shear stress field occurs in the pre-deformation zone immediately in front of the roll-bite entrance. It is noteworthy that this shear stress field bears reverse sign to that of shear stress that occurs in the backward slip zone where the material is pulled into the roll-bite, and also that it is a starting point of the shear bands, which constitute essence of rolling deformation. Accordingly, first an explanation is given of mechanism of occurrence of this shear stress field, using schematic sketch of Fig. 21. Inside the roll-bite, as thickness of the rolled material is reduced due to plastic deformation, shear stress also acts on the material outside and adjacent to the roll-bite because the material is a continuous body. This shear stress is a cause of the pre-deformation zone where thickness of the material starts to reduce immediately in front of the roll-bite entrance.

On the material surface in the backward slip zone of the roll-bite, a high shear stress bearing opposite sign to the shear stress acting on the pre-deformation zone is observed. This stress is frictional stress that acts to pull the material into the roll-bite. In addition, when the shape factor is Γ=2.50, shear stress in the vicinity of the roll-bite exit is also prominent. This is because contact arc length increases, and effect of friction shear stress in the forward slip zone becomes large.
In addition, as distinctive behavior, it is observed that the shear stress field started from the material surface in the backward slip zone shifts to the roll-bite exit side as it approaches center part of thickness. With this configuration of the shear stress field, the shear band starting from the pre-deformation zone can penetrate in thickness direction at an oblique angle, which is indispensable to produce elongation at the shear band, as shown in Figs. 19 and 20. Hence the configuration of the shear stress field is extremely important. The cause of this is discussed in the following passage.
Figure 22 is a schematic view of a contour diagram that indicates diffusion of shear stresses to inside of the material in case where reverse-direction frictional stresses, i.e. shear stresses, act on the surface of the material. In case where any other external forces do not exist, the shear stresses inside the material are diffused symmetrically with respect to the center line, as shown in Fig. 22. Although sign on the stress is reversed, this situation is close to shear stress distribution on the top surface shown in Fig. 20(c). In Fig. 20(c), since the top WR is idle, the neutral point is located near the center of contact arc length, and the frictional stress reverses its sign with respect to the neutral point, rendering almost symmetric distribution of the shear stresses caused by the frictional stresses.

With such distribution of the shear stresses in mind, Fig. 23 depicts a schematic view of distribution of the shear stresses inside the material in the vicinity of the roll-bite. In the backward slip zone of the roll-bite, as already mentioned, frictional stress acts on the material pulling into the roll-bite. On the other hand, frictional stress does not act on the surface of the pre-deformation zone because there is no contact with WR. However, in the pre-deformation zone, a shear stress bearing opposite sign to that of the backward slip zone is generated, as shown in Fig. 21.

In order to take into consideration the effect of this shear stress acting in the pre-deformation zone, it is assumed that the rolled material is cut along a vertical line that passes through starting point of contact with WR. Through this cross-section, a shear stress of opposite sign to the shear stress in the backward slip zone is acting from the pre-deformation zone to the backward slip zone. As shown in Fig. 23, this is equivalent to upward shear stress acting as an external force on the material in the backward slip zone. Consequently, when considering diffusion of the shear stresses in the material that is enclosed by this cross-section and WR surface, it is understood that shear stress distribution is generated with line of symmetry starting from starting point of contact with WR and inclined at an angle of approximately 45 deg. As shown in Fig. 23, positive shear stress field acting in the backward slip zone shifts to the roll-bite exit side as it approaches center part of thickness of the material. In other words, shear stress field that acts in the pre-deformation zone also has a significant effect on stress field inside the roll-bite, and, in addition, the pre-deformation zone is starting point of the shear bands, which constitute essence of rolling deformation. It can thus be concluded that pre-deformation zone performs an extremely important role for rolling deformation.
Summing up discussion concerning plastic deformation behavior inside the roll-bite, it can be understood that shear stress fields at the roll-bite entrance and also inside the roll-bite are determined by rolling conditions including WR drive conditions, that the shear bands, which constitute essence of rolling deformation, are formed according to this shear stress field, and that warping behavior is determined by strength and configuration of the shear bands at the roll-bite exit.


