Regular Article
Interpretation on Iron Ore Granulation Process Based on Particle-size Analysis
2016 Volume 56 Issue 11 Pages 1964-1972

Details
2016 Volume 56 Issue 11 Pages 1964-1972
The adopted conventional granulation and proposed pre-wetting granulation for six sinter mixtures were reinvestigated and interpreted from the perspective of particle size analysis. To research the experimental data from the two processes, two mass fractal models were adopted and further discussed in the characterization of particle size distribution for these sinter mixtures. It was found that: (1) Compared to conventional granulation, the pre-wetting granulation can significantly change the particle size distributions of the sinter mixtures before and after granulation. (2) A fractal characteristic for the particle sizes of the sinter mixtures was observed in the two granulation processes. The particle size distributions of the mixtures can be simulated by the proposed fractal models. (3) Using such fractal model as a bridge, the granule sizes can be predicted by moisture content and fractal parameters of the researched sinter mixture. However, due to the preferential growth of pre-wetted particles, the predictive models on particle sizes built in conventional granulation did not work well in pre-wetting granulation. (4) A prediction model on green bed permeability was developed with fractal parameters of the granules. With these findings, this work can be meaningful for ore-blending optimization and granulation enhancement.
Granulation plays a critical role in iron ore sintering process. It influences not only the green bed permeability before ignition, but also the high temperature reactions, such as fuel combustion,1,2) primary sinter melt formation3,4) during sintering. The most important issues being researched in iron ore granulation are the two: the method or technology to rearrange the distributions of chemical compositions or mineral phases in the granules,5) and the other one to optimize the size distribution6,7) of the granules for any assigned sinter mixture. The first issue aims to adjust or control chemical reactions of the granules in high-temperature sintering, so that the quality of sintered ores can be guaranteed or improved further. With the purpose to increase sinter productivity via improving the green bed permeability, the second issue is exactly what this paper wants to concern.
The quasi-particles8) and permeability in terms of JPU (Japanese Permeability Units)6) were widely used to characterize the granules and the green bed permeability, respectively. The influences of particle size grading9,10) and physical properties11,12,13) of iron ores on granulation results have been investigated by researchers. However, the particle size distributions (PSDs) of sinter mixtures were usually not treated as an integral whole in the past research. The quantitative influence of such integral PSDs of sinter mixtures on the final granulation results, especially on the green bed permeability is still not very clear.
The conventional granulation for six sinter mixtures14) and pre-wetting granulation15) for two sinter mixtures were conducted under laboratory conditions. In pre-wetting granulation, the particles of some iron ores in sinter mixtures were selected and partially wetted before being mixed and granulated with other materials in conventional granulation procedures. The particle sizes for each sinter mixture before and after granulation were measured according to the manual sieve method.8,16) The green bed permeability of the granules was measured according to the reported procedure17,18) and further discussed. According to the fractal theory,19) two mass fractal models for the PSDs of sinter mixtures in granulation were developed. In general, the evolution of PSD in the two granulation processes was investigated and discussed. The implication of the adopted mass fractal model for granulation enhancement of sinter mixtures was also explored.
In this paper, the raw materials from a Chinese sinter plant were adopted to prepare 6 sinter mixtures. With moisture content (WMC, %), the chemical compositions for these raw materials are shown in Table 1. Ore-A, Ore-B and Ore-C were Brazilian hematite iron ores with TFe > 64.00%, while Ore-D to Ore-G were four Australian limonite ores with LOI (Loss of ignition) > 5.00%. The Ore-PIB (the proportion-fixed iron-bearing blend) was a mixture of 4 kinds of recycling iron bearing materials and 4 kinds of undersized iron ore fines (sinters, pellets and lump ores). The proportion for each component in Ore-PIB was kept at a fixed value. Dolomite, serpentine, limestone and quicklime are the four fluxes, and coke breeze is the fuel used in sinter mixtures.
| Materials | WMC | TFe | FeO | CaO | SiO2 | MgO | Al2O3 | LOI | C |
|---|---|---|---|---|---|---|---|---|---|
| Ore-A | 7.74 | 65.29 | 0.16 | 0.02 | 1.36 | 0.09 | 1.49 | 2.18 | 0.00 |
| Ore-B | 5.60 | 65.11 | 0.61 | 0.02 | 4.06 | 0.06 | 0.61 | 1.48 | 0.00 |
| Ore-C | 5.42 | 64.51 | 0.45 | 0.02 | 4.30 | 0.05 | 0.68 | 2.04 | 0.00 |
| Ore-D | 8.37 | 61.26 | 0.32 | 0.03 | 3.69 | 0.06 | 2.25 | 5.88 | 0.00 |
| Ore-E | 7.90 | 58.27 | 0.22 | 0.04 | 5.55 | 0.08 | 1.37 | 10.13 | 0.00 |
| Ore-F | 8.21 | 59.14 | 0.21 | 0.05 | 4.38 | 0.08 | 1.50 | 9.52 | 0.00 |
| Ore-G | 8.32 | 61.53 | 0.29 | 0.02 | 3.05 | 0.16 | 2.06 | 6.34 | 0.00 |
| Ore-PIB | 5.43 | 54.28 | 7.09 | 7.35 | 4.62 | 1.62 | 1.70 | 1.66 | 0.00 |
| RSF | 0.20 | 57.52 | 7.95 | 9.92 | 4.63 | 1.65 | 1.66 | 0.00 | 0.00 |
| Dolomite | 0.82 | 0.15 | 0.00 | 31.14 | 1.71 | 20.50 | 0.21 | 45.67 | 0.00 |
| Serpentine | 6.73 | 4.90 | 0.00 | 1.31 | 38.61 | 38.99 | 0.93 | 12.04 | 0.00 |
| Limestone | 1.12 | 0.14 | 0.00 | 55.03 | 0.51 | 0.41 | 0.17 | 43.65 | 0.00 |
| Quicklime | 0.00 | 0.00 | 0.00 | 82.70 | 3.48 | 1.43 | 0.00 | 12.32 | 0.00 |
| Coke breeze | 6.02 | 0.57 | 0.00 | 0.32 | 6.50 | 0.05 | 4.50 | 88.06 | 84.90 |
Seven iron ores (Ore-A to Ore-G), Ore-PIB and RSF (Return Sinter Fines) are the so-called iron bearing materials. The particle sizes and moisture capacity20) (MC, the dry basis saturation moisture content for a given iron ore) of these iron bearing materials were given by Table 2. The content of nuclei particles (>0.7 mm)21) for Ore-E, Ore-F and RSF was the highest, while the moisture capacity (MC) for Ore-D, Ore-F and Ore-G was the largest (>16%).
| Materials | Ore-A | Ore-B | Ore-C | Ore-D | Ore-E | Ore-F | Ore-G | Ore-PIB | RSF |
|---|---|---|---|---|---|---|---|---|---|
| <0.2 mm | 25.13 | 39.53 | 31.41 | 12.25 | 5.23 | 7.37 | 21.35 | 34.12 | 7.46 |
| 0.2–0.7 mm | 21.50 | 16.65 | 20.00 | 23.31 | 14.46 | 15.67 | 26.08 | 18.64 | 11.67 |
| > 0.7 mm | 53.37 | 43.82 | 48.59 | 64.44 | 80.31 | 76.96 | 52.57 | 47.24 | 80.87 |
| MC | 14.20 | 8.61 | 10.35 | 16.68 | 14.33 | 18.21 | 17.80 | – | – |
All iron bearing materials but RSF were the ingredients in ore blend design. As shown in Table 3, the ore blends for six sinter mixtures were obtained using a linear programming model.22) In this model, the constraints from industrial requirements were: (1) for chemical compositions, SiO2 varied from 3.40% to 4.20%, Al2O3 varied from 1.30% to 1.70% and TFe varied from 59% to 62%; (2) for material components, the proportion of Ore-PIB was fixed at 20.00%, the content of Brazilian hematite iron ores (the total content of Ore-A to Ore-C) varied from 30% to 40% and the content of Australian limonite ores (the total content of Ore-D to Ore-G) varied from 40% to 50%.
| Ore blend | Ore-A | Ore-B | Ore-C | Ore-D | Ore-E | Ore-F | Ore-G | Ore-PIB |
|---|---|---|---|---|---|---|---|---|
| OB-1# | 20.00 | 5.00 | 5.00 | 0.00 | 33.56 | 16.44 | 0.00 | 20.00 |
| OB-2# | 14.61 | 12.75 | 9.14 | 0.00 | 0.00 | 43.50 | 0.00 | 20.00 |
| OB-3# | 8.00 | 20.00 | 8.50 | 0.00 | 0.00 | 41.62 | 1.88 | 20.00 |
| OB-4# | 8.00 | 15.44 | 6.56 | 8.90 | 0.00 | 29.10 | 12.00 | 20.00 |
| OB-5# | 10.27 | 5.00 | 16.00 | 0.00 | 0.00 | 46.92 | 1.81 | 20.00 |
| OB-6# | 8.00 | 18.00 | 4.00 | 0.00 | 2.37 | 39.00 | 8.63 | 20.00 |
Then, with ore blends, RSF, fluxes and coke breeze, the 6 sinter mixtures (from SM-1 to SM-6) were prepared using another linear programming model. In this model, the basicity (R, mass ratio of CaO to SiO2) of 2.0 for sintered ore was chosen as the objective function. The proportions (dry basis) for quicklime, coke breeze and RSF were fixed at a constant value, while the proportions of ore blends and other three fluxes were varied. All the six mixtures were studied in conventional granulation. SM-1 and SM-3 were investigated in pre-wetting granulation.
2.2. Granulation ProceduresThe conventional granulation14) and pre-wetting granulation15) for sinter mixtures were carried out under laboratory conditions. A rotary-type mixer and a rotary-drum granulator were the main apparatus for these laboratorial granulation experiments. In the frist stage of granulation, the mixer was used for one-minute of dry-mixing and two-minute of partial wet-mixing. In the second stage, the horizontal granulator (0.128 m3 in volume, 416 mm in internal diameter) was chosen for four-minute granulating. The motion from rolling to cascading is recommended23,24) for the granulation of sinter mixtures. With a Froude number of 0.57×10⁻² and a inclination angle of 2°–3° for the granulator, this rolling cascading motion was ensured with a filling degree of about 13%. This filling degree is corresponding to about 25 kg handling capacity (Mhc≈25 kg at as-received state) of sinter mixtures for each batch granulation.
By knowing the initial moisture content at as-received state (WMC(ini), %) and the target moisture content (WMC(tar), %) of the sinter mixtures, the total required water (Mrw(H2O), kg) added in a batch granulation is given as follows:
| (1) |
Besides, in both granulations, quicklime would be fully slaked before being mixed and granulated with other raw materials. The procedures for the two granulations were described as follows.
2.2.1. Procedures of Conventional GranulationAt the same experimental conditions, five levels of moisture content from 4.0% to 9.0% for the six mixtures were investigated in the conventional granulation. In this granulation, all the as-received raw materials (including slaked quicklime) would be mixed in the rotary mixer for one-minute of dry-mixing. After that, a part of the mixture (about 0.5 kg) was sampled for measuring the PSD(raw) before granulation. Subsequently, 80% of the total required water (MC1=0.8×Mrw(H2O), kg) was sprayed onto the particles in the next two-minute of partial wet-mixing. Then, the mixture was transferred into the horizontal granulator for four-minute of granulation. During the same period, the rest of the total required water (MC2=0.2×Mrw(H2O), kg) was added into the granulator in the form of water drops. Finally, after the four-minute granulating, the granulation results were measured and analyzed.
2.2.2. Procedures of Pre-wetting GranulationThe pre-wetting granulation for SM-1 and SM-3 was conducted at a fixed moisture content. Before conducting the normal procedures of the conventional granulation, in pre-wetting granulation, the pre-wetting treatment on the particles for some iron ores would be carried out. Three important issues in this technology should be figured out in advance: the selection criteria for meterials to be pre-wetted, the principle for a proper pre-wetting degree (PWD) and the strategy of water distribution in granulation.
To choose iron ore fines to be pre-wetted, high proportion in ore blends, high value of moisture capacity (MC) and high content of nuclei particles (>0.7 mm) are all the selection criteria. Considering these criteria for iron ores in Tables 2 and 3, Ore-E and Ore-F were pre-wetted for SM-1 and SM-3 in pre-wetting granulation.
As for the second issue, before distributing water in granulation, a proper pre-wetting degree (PWD) must be determined in the pre-wetting treatment. For the pre-wetting of ore i, the principle is that the WMC (tar)ore i based on a PWD should be larger than the optimal moisture content of the given sinter mixture in conventional granulation. Herein, for both SM-1 and SM-3, the lowest PWD of Ore-E and Ore-F was chosen at 65%, and a higher PWD of 85% was also investigated to study the effect of pre-wetting degree on the granulation bahviour in pre-wetting granulation.
The last issue is to distribute water into different stages of granulation. The total required water (Mrw(H2O)) in pre-wetting granulation would be distributed in the following three stages: pre-wetting treatment, two-minute of partial wet-mixing and the last four-minute of granulation. For k kinds of pre-wetting ores, the total amount of water required in pre-wetting treatment (MPW) of a batch granulation was given by the following equation:
| (2) |
Where, MPW(i) is the amount of water to pre-wet ore i (kg). MPW(i) can be determined by the mass of ore i (More i-pw, kg) to be pre-wetted, the initial moisture content (WMC (ini)ore i, %wet basis) and the target moisture content of ore i (WMC (tar)ore i, %wet basis). The WMC (tar)ore i can be expressed based on the saturation moisture content of ore i (WMC (sat)ore i, %wet basis) and the pre-wetting degree of this ore ((PWD ore i, %)).
| (3) |
With WMC (tar)ore i, MPW(i) can be calculated as follows.
| (4) |
Thus, the pre-wetting treatment on ore i can be carried out by spraying the amount of water (MPW(i)) onto the particles of ore i in 3 minutes. Then the pre-wetting on other ores can be conducted similarly.
After that, these pre-wetted particles and slaked quicklime would be mixed with other raw materials in the next one-minute dry-mixing. In the second stage of water distribution, excluding the water used in pre-wetting treatment, a certain amount of water (MP1=0.8×Mrw(H2O)-MPW) would be sprayed onto the rolling particles in two-minute of partial wet-mixing. In the last stage, the rest water (MP2=0.2×Mrw(H2O), kg) was added into the granulator during the four-minute of granulation via water drops.
2.3. Methods to Evaluate GranulationTo evaluate granulation results, moisture content, green bed permeability and particle size distribution (PSD) are the most important parameters. The methods to measure and analyze these parameters were briefly stated in this section.
2.3.1. Moisture ContentThe moisture content (WMC, %wet basis) for a given material was measured based on the weight loss of a 1 kg sample before and after drying in a muffle furnace at 110±10°C for 2 h. The moisture content after one-minute dry-mixing was noted as WMC(raw) for sinter mixtures before granulation, and WMC(ini) is the as-received moisture content for sinter mixtures. Due to the slaking of quicklime or the pre-wetting of some particles, WMC(raw) and WMC(ini) would usually be different from each other. The one after four-minute granulating was marked as WMC(granules) for sinter mixtures after granulation. Usually this moisture content is equal to the target moisture content (WMC(tar)) in a given batch granulation.
2.3.2. Green Bed PermeabilityAccording to Ergun’ equation25) given by the following equation, the permeability of a packed bed is dependent on its bed properties.
| (5) |
Where, ΔP is the pressure drop across the bed, mm H2O; Δh is the height of the packed bed, mm; k1 and k2 are the constant parameters; εb is the void fraction; DSV is the surface/volume mean diameter, mm; ηg is the gas viscosity, kg.m−1.s−1; Ug is the gas flow velocity, m.s−1; ρg is the gas density, kg.m−3;
Based on Ergun’ equation (Eq. (1)), the permeability in terms of JPU (Japanese Permeability Units)6) was developed for the green bed of granules. It can be determined with the following equation:6)
| (6) |
Thus, the green bed permeability for sinter mixtures was determined by measuring the pressure drop (∆P, mm H2O) of the packed granule bed (234 mm in height and 210 mm in diameter) at an air flow rate of 60 m3/h.
2.3.3. Particle Sizes and Its CharacterizationBased on manual-sieving method,8) the particle sizes of sinter mixtures were measured without any pretreatments, such as muffle furnace drying or liquid nitrogen freezing. The particles of the selected sample were sieved into 6 size fractions using the following sieve sizes: 10 mm, 8 mm, 3 mm, 0.7 mm and 0.2 mm. The weight percentage for particles of each size fraction was measured and recorded. Based on the recorded data, W+8, −10(raw) is the content of particles from 8 mm to 10 mm after one-minute dry-mixing in granulation, and thus the other notations (W+10(raw), W+3, −8(raw), W+0.7, −3(raw), …) can be speculated. The notation PSD(raw) is the particle size distribution of sinter mixtures after one-minute dry-mixing, while PSD(granules) represents the one for sinter mixtures after four-minute granulating.
The PSDs of sinter mixtures can be expressed16) by frequency distribution curve or cumulative size distribution curve. With a cumulative undersize curve, two mass fractal models were adopted herein to characterize the PSD of sinter mixtures. In soil particle size analysis, the mass fractal model (simple fractal model, referred to as SF-model) was developed26) and given as follows:
| (7) |
Where, YW(d<D) is the undersized cumulative content of particles with a size d less than a given comparative size D; Dmax is the upper size limit of the particles; Df is the fractal dimension of the particle sizes.
Considering the non zero value of the minimum particle size (lower size limit, Dmin>0), an improved fractal model (labeled as IF-model) based on SF-model (given by Eq. (7)) was developed:27)
| (8) |
As shown in Fig. 1, the PSD of a sinter blend28) was chosen to validate the two fractal models. Both the two models provided a good fit to the data, with Radj2 larger than 0.98. This indicated that: (1) the PSD(raw) of this sinter mixture is fractal. (2) With these fractal models, the optimization of sintering blending22) can be conducted from the perspective of size grading. Since the two models showed little difference in simulating the PSD of this mixture, the SF-model given by Eq. (7) was adopted in the following research.
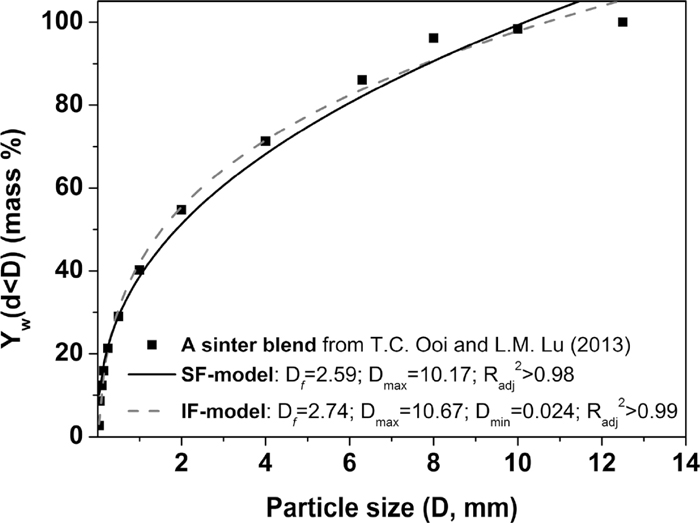
Validation on fractal models with published data.
In later discussion, the fractal dimension (Df), maximum diameter (Dmax) before granulation were noted as Df(raw) and Dmax(raw), respectively. While, Df, Dmax and permeability of the granules were marked as Df(granules), Dmax(granules) and JPU.
The granulation results for SM-1 in conventional granulation were shown by Fig. 2. In the conventional granulation, increasing moisture content (WMC, %) resulted in a notable decrease of W−3(granules) and an inverted V shape of W+3,−10(granules) (see the double arrow lines in Fig. 2 from WPT1 to WPT5).
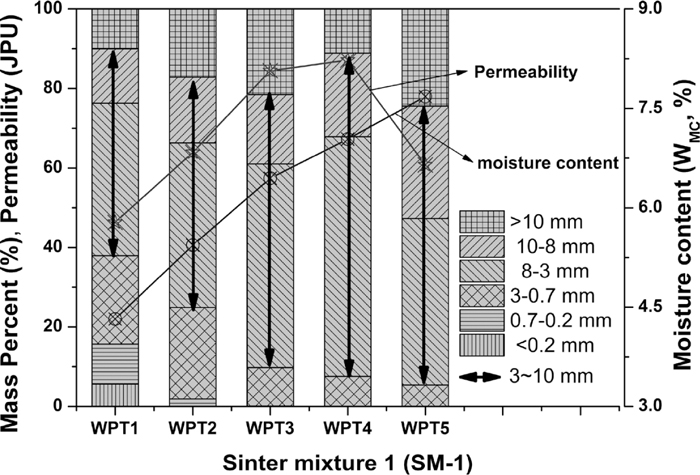
Granulation results for SM-1 in conventional granulation.
Based on W+3,−10(granules) or permeability (JPU), the optimum granulation was obtained at WPT4 with optimum moisture content of 7.04%. When moisture content increased beyond the optimum value from WPT4 to WPT5, the content of coarse particles (>10 mm) (W+10(granules)) would increase dramatically. Besides, no particles smaller than 0.7 mm were left with a moisture content higher than 6.0% (sample of WPT3, WPT4 and WPT5). It is believed29) that the granulated product is larger in size and narrower in size distribution than its original feed. This conclusion can be confirmed by the results given by Fig. 2.
To analyze the PSD(granules), the fractal analysis based on SF-model for SM-1 and SM-2 was illustrated by Fig. 3.
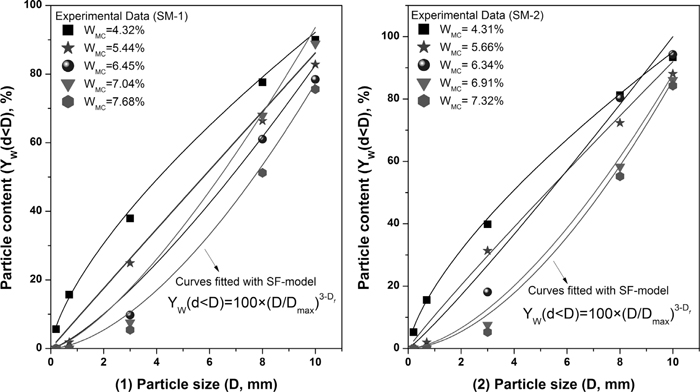
Fractal analyses for SM-1 and SM-2 in conventional granulation.
With Radj2>0.95, the PSDs(granules) for both SM-1 and SM-2 in conventional granulation were well fitted by SF-model. The Df(granules), Dmax(granules) were obtained from the fitting curves. For both the two mixtures, the similar evolution of particle size distribution was observed in Fig. 3. Thus, the parameters for SM-1 and SM-2 in the conventional granulation were summarized in Table 4.
| Sample | Before granulation | After granulation | ||||||
|---|---|---|---|---|---|---|---|---|
| Df | Dmax (mm) | WMC (%) | W+3 (%) | W+3,−8 (%) | Df | Dmax (mm) | JPU | |
| SM1-1# | 2.176 | 12.125 | 4.32 | 62.05 | 38.38 | 2.325 | 11.408 | 46.36 |
| SM1-2# | 1.976 | 12.965 | 5.44 | 75.08 | 41.44 | 1.993 | 11.508 | 63.95 |
| SM1-3# | 2.101 | 13.506 | 6.45 | 90.25 | 51.26 | 1.670 | 11.511 | 84.46 |
| SM1-4# | 1.957 | 13.985 | 7.04 | 92.43 | 60.29 | 1.570 | 10.453 | 87.17 |
| SM1-5# | 2.191 | 12.988 | 7.68 | 94.58 | 41.87 | 1.266 | 11.583 | 60.77 |
| SM2-1# | 2.296 | 11.871 | 4.31 | 60.16 | 39.19 | 2.334 | 10.778 | 33.30 |
| SM2-2# | 2.29 | 12.83 | 5.66 | 68.64 | 37.72 | 2.056 | 10.831 | 52.92 |
| SM2-3# | 2.24 | 12.779 | 6.34 | 81.90 | 65.33 | 1.941 | 10.000 | 78.56 |
| SM2-4# | 2.28 | 11.861 | 6.91 | 92.42 | 46.52 | 1.314 | 10.778 | 89.36 |
| SM2-5# | 2.222 | 12.113 | 7.32 | 94.75 | 45.90 | 1.188 | 10.852 | 60.50 |
Similarly, the results for other mixtures (SM-3 to SM-6) in conventional granulation can also be measured and recorded. With thses experimental data, the effect of moisture content on Df(granules) was described by Fig. 4.
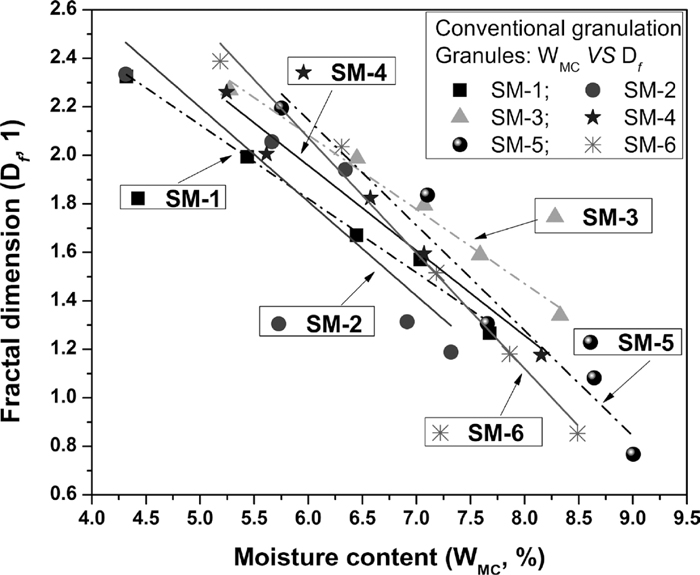
Effect of moisture content on Df(granules) in conventional granulation.
As shown in Fig. 4, increasing moisture content resulted in a linear decreasing of Df(granules). Considering the conclusion confirmed by Fig. 2, it can be inferred from Fig. 4 that the decrease of Df(granules) is accompanied with the tightening of particle size distribution and the increasing of granule size. Fractal dimension (Df(granules)) could be a comprehensive parameter to characterize the particle sizes of the granules.
3.2. Pre-wetting GranulationIn pre-wetting granulation, the particle size analyses based on SF-model for SM-1 were described by Fig. 5. Both the two batches of granulation under PWD=65% and PWD=85% were carried out at moisture content of 5.80% (WMC=5.80%). With Radj2>0.93, the fractal characteristics for the PSDs of SM-1 in pre-wetting granulation was also observed in Fig. 5.
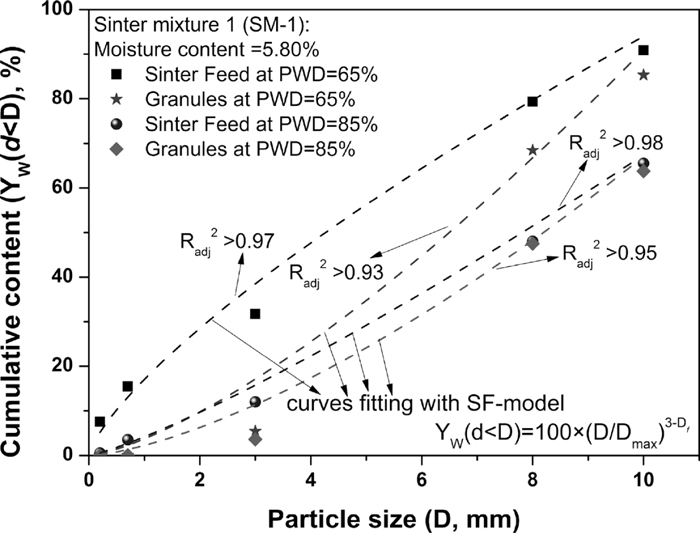
Fractal analyses for SM-1 in pre-wetting granulation.
Comparing to the sinter feed of SM-1 at PWD=65%, for sinter feed of SM-1 at PWD=85%, it was found that: (1) the granule growth has already taken palce during the one-minute of dry-mixing. (2) The fine particles (<3 mm) decreased a lot from 31.70% to 12.00% and coarse particles (>10 mm) increased dramaticlly from 9.12% to 34.51%. From two minute of partial wet-mixing to four-minute of granulation (from PSD(raw) to PSD(granules)), the granule growth for SM-1 at PWD=65% was noticeable, while that for SM-1 at PWD=85% was not enhanced so much. Thus, it can be inferred that: (1) the granule growth in pre-wetting granulation will happen in the following three stages: one-minute of dry-mixing, two minute of partial wet-mixing and four-minute of granulation; (2) furthermore, the granule growth in one-minute of dry-mixing can be enhanced by increasing PWD of the pre-wetted materials.
Similarly, as shown in Fig. 6, the particle sizes for SM-3 in pre-wetting granulation were analyzed with SF-model. With Radj2>0.93, the PSDs for sinter feed and granulated product were fractal.
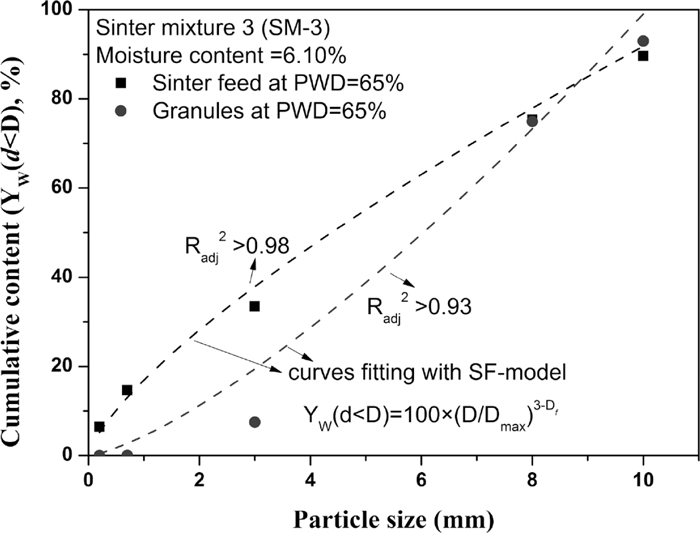
Fractal analyses for SM-3 in pre-wetting granulation.
Considering the fitting curves in Figs. 5 and 6, the particle sizes of sinter mixtures after one minute of dry-mixing (PSD(raw)) show a better fractal feature than that after four minute granulating (PSD(granules)).
The effect of pre-wetting treatment on the granulation bahviour of SM-1 was discussed in Fig. 7. As mentioned above, the granulated product of WPT4 was the optimum result for SM-1 in conventional granulation. With WMC=5.8%, the samples of PD-1 and PD-2 were the results for SM-1 in pre-wetting granulation at PWD=65% and PWD=85%, respectively.
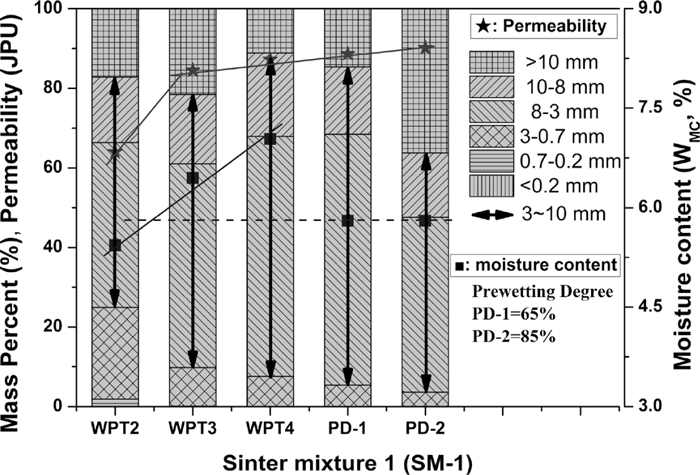
Effect of pre-wetting treatment on SM-1.
Taken WPT2 and WPT3 as reference, the pre-wetting granulation for SM-1 generated quite a different PSD(granules). At a similar moisture content (WMC=5.8%), the W+3,−10(granules) of PD-1 was much higher than that (W+3,−10(granules) of WPT2 and WPT3) in conventional granulation. The W+10(granules) for both PD-1 and PD-2 was also higher than that of WPT2 and WPT3. It can also be noticed that the PSD(granules) with PWD=85% (PD-2 in Fig. 7) had an unusual high content of coarse granules (>10 mm). Besides, the sludge-like particles for Ore-E and Ore-F would be made with PWD=85%, which is definitely not good for granulation. Thus, it can be inferred that: (1) the granule growth for SM-1 has been promoted significantly by pre-wetting granulation; (b) the pre-wetting of Ore-E and Ore-F with PWD=85% would have a detrimental effect on the granule size-grading of SM-1.
According to the green bed permeability (JPU) in Fig. 7, pre-wetting treatment improved the granulation of SM-1 greatly. At a lower moisture content (WMC=5.8% < 7.04%), the permeability for both PD-1 and PD-2 was even better than the optimum permeability in conventional granulation. The difference in granule growth mechanism between conventional granulation and pre-wetting granulation can explain this phenomenon.
It is widely accepted24) that the particle growth in conventional granulation is the layering of fine particles onto larger nuclei particles. This mechanism can be referred to as random growth mechanism, because these larger nuclei particles were randomly and simultaneously layered by fine particles. In Fig. 7, the granule growth for SM-1 in pre-wetting granulation was enhanced by pre-wetting treatment on particles of some iron ores. The preferential granule growth30) of the pre-wetted particles plays a great role in the pre-wetting granulation of sinter mixtures. These pre-wetted particles were layered or coated by fine particles preferentially. Thus, comparing to conventional granulation, the granulation result of sinter mixtures can be improved further by pre-wetting granulation, due to such preferential and non homogeneous growth of nuclei particles.
4.2. Prediction Models on Granule SizesBased on the the experimental data for the six sinter mixtures in conventional granulation, the predictive models on granule sizes were given by Eqs. (9) and (10), respectively.
| (9) |
| (10) |
The two models were obtained by using multiple linear regression analysis, the Radj2 for Eqs. (9) and (10) is 0.841 and 0.875. With these prediction models, the resulting granule sizes can be predicted by the particle sizes of the raw sinter mixtures and the moisture content adopted in conventional granulation.
It is known that increasing Dmax(raw) would contribute to the increase of the granule size, which is accompanied by the increase in W+3(granules) and decrease in Df(granules). So, the coefficients of Dmax(raw) to the predicted W+3(granules) and Df(granules) would be positive and negative accordingly. It is accepted that W+3(raw) has a positive impact on the consequent W+3(granules). As already confirmed by Fig. 4, the increase in Df(raw) is accompanied by a wider PSD(raw) with the decrease of W+3(raw). So, as given by Eq. (9), the Df(raw) would reduce the value of W+3(granules). The coefficient of Df(raw) in predicting Df(granules) is positive (given by Eq. (10)), because the PSD of the granules is generated from that of the raw sinter mixture.
The correspondence between the predicted values and the observed values for W+3(granules) and Df(granules) in the two granulation processes was shown in Fig. 8.
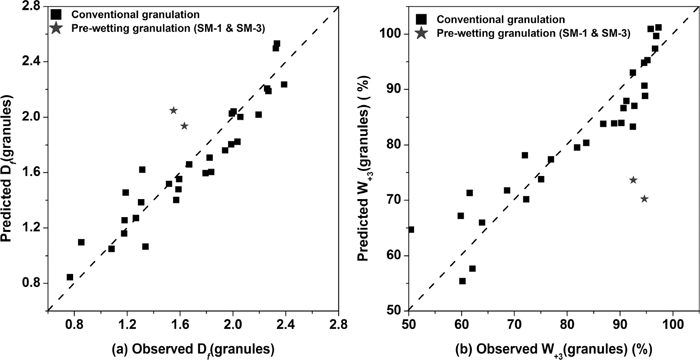
Comparison of the granule parameters between the observed values and the predicted values in two granulations: (a) Df(granules); (b) W+3(granules).
As for the results in conventional granulation (the square dots of data in Fig. 8), the predicted values based on the two prediction models (Eqs. (9) and (10)) are in good agreement with the observed values of W+3(granules) and Df(granules). This indicated that in conventional granulation, the W+3(granules) and the size gradation of the granules (Df(granules)) can be predicted based on the fractal parameters of sinter raw mixtures and the adopted moisture content.
However, the prediction models (Eqs. (9) and (10)) did not work well with the results from pre-wetting granulation (the starlike dots of data in Fig. 8). As discussed above, due to the preferential granule growth of the pre-wetted particles, pre-wetting granulation can promote the granule growth of a sinter mixture further. At the same moisture content, sinter mixtures in pre-wetting granulation would generate more larger granule particles. Since the Eq. (9) was built based on experimental data from conventional granulation, the predicted W+3(granules) should be equal to the observed W+3(granules) in conventional granulation, which is obviously smaller than the observed W+3(granules) in pre-wetting granulation. Therefore, as shown in Fig. 8, the observed values were larger than the predicted values for the W+3(granules) in pre-wetting granulation. The same reason can account for this low correspondence between the observed values and the predicted values of Df(granules) in pre-wetting granulation.
4.3. Prediction on Green Bed PermeabilityIt is well known31) that an increase of moisture content in granulation would be accompanied by a parabolic or an inverted U shaped curve of the green bed permeability. The curve segment before permeability reaching its maximum value on permeability moisture curve is the most important part highlighted by most researchers. Thus, this part of data from permeability moisture curve in conventional granulation was selected to build the prediction model on green bed permeability for the six sinter mixtures.
Taken fractal parameters of the granules from conventional granulation as the input variables, using multiple liner regression analysis, the prediction model on green bed permeability was obtained and expressed by the following equation (Radj2=0.77).
| (11) |
It is known that the granules larger in size and narrower in size distribution (a decrease in Df(granules)) would benefit the loose packing structure of the granules, giving a higher permeability (an increase in permeability). Meanwhile, increasing Dmax(granules) would increase the heterogeneity of the packed bed, which would be good for the improvement of green bed permeability. This can be the physical meaning of Eq. (11).
As illustrated in Fig. 9, the correspondence between the predicted values and the observed values for permeability (JPU) was quite good. It seems that this prediction model is universal, free from the type of granulation technology. According to Ergun’s equation, particle size and its distribution have a decisive impact on mean particle diameter and bed voidage. The permeability of the packed bed would be determined by the PSD(granules). According to the analyses in “3 Granulation results”, the PSD(granules) can be integrally characterized by fractal parameters of Df(granules) and Dmax(granules). Since the predition on green bed permeability with Eq. (11) was obtained based on fractal parameters of the granules. So, no matter what kind of granulation technology was applied, provided fractal parameters of PSD(granules), the permeability can be predicted with Eq. (11). This is exactly the physical meaning of Eq. (11) and also explains why the permeability in pre-wetting granulation can also be predicted by Eq. (11).
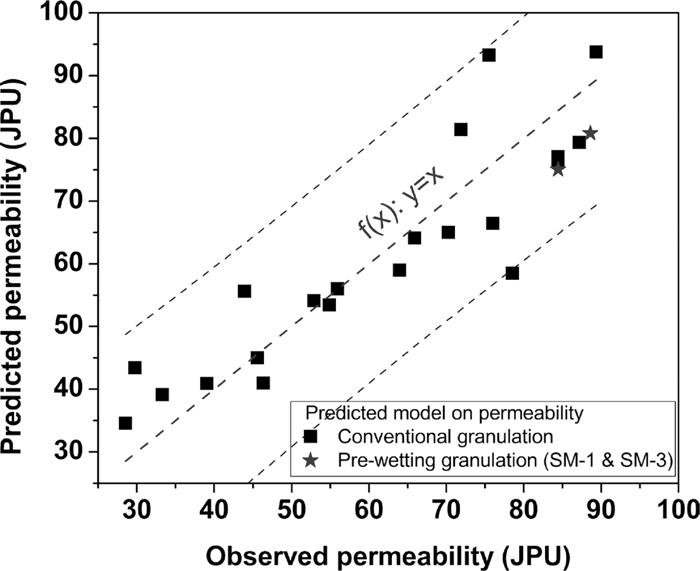
Comparison of the observed value versus the predicted value of permeability.
Based on the research results, there would be an alternative method to maintain a suitable permeability before ignition by adjusting and controlling the size gradation of the granules. Here, the adopted mass fractal model with fractal dimension for PSD would play a critical role as a bridge between the particle sizes of the granules and the permeability of the packed bed.
Six sinter mixtures from a sinter plant were prepared and studied in the research of two granulation processes. The granulation results were interpreted from the perspective of particle size analysis. Two mass fractal models on the PSDs (particle size distributions) of sinter mixtures in granulation were proposed and discussed in this paper. The application of such mass fractal models in predicting granulation results was also explored. From this paper, the following conclusions can be drawn.
(1) Compared to the adopted conventional granulation, the proposed pre-wetting granulation would significantly change the PSDs of the sinter mixtures before and after granulation.
(2) The particle sizes of the studied sinter mixtures are fractal in granulation process. The PSDs of the sinter mixtures can be simulated by the proposed two fractal models.
(3) The adopted mass fractal model (SF-model) was applied as a bridge to build quantitative relations of the PSDs of sinter mixtures before and after granulation to the resulting permeability before ignition. The granule sizes in terms of W+3(granules) and Df(granules) can be predicted by the following two models:
(4) As for the six sinter mixtures in granulation, before reaching the optimal permeability with the increase of moisture content, the size gradation of the granules has a significant effect on the green bed permeability. Free from the type of granulation technology, provided fractal parameters of the granules, the permeability can be predicted by the following equation:
The authors are especially grateful to National Natural Science Foundation of China (NSFC) (Grant No. 51522403) for the financial support on this work. The support from General Program of National Natural Science Foundation of China (Grant No. 51474164 ) is also appreciated.