Abstract
The electrochemical decomposition of carbon dioxide to form carbon and oxygen gas in CaCl2–CaO molten salt was studied. A water model experiment was carried out to study the influence of the tip shape of the pipe, the pipe diameter and the wettability of the gas injection pipe on the bubble shape in the molten salt. Bubbles were formed with both a horizontal tip and an oblique tip when the wettability of the gas injection pipe was good. The specific surface area of the bubbles when using the oblique tip was smaller than when using the horizontal tip. On the other hand, slug flows appeared when wettability was poor. In a hot model experiment, the current density was measured, and it was found that the CO2 gas concentration decreased. Precipitated carbon was detected from the sample after the experiment. With the same pipe, the decrease of the CO2 gas concentration when using the oblique tip was more remarkable than when using the horizontal tip. It is likely that the form of the CO2 gas in the molten salt was bubble-shaped.
1. Introduction
Global warming caused by the increasing level of CO2 in the atmosphere has been taken up as an international problem, and reduction of CO2 emissions is a global issue. The total amount of CO2 emissions in 2012 in Japan was approximately 1276 million tons. Emissions from the steel industry were approximately 150 million tons, or 11.6% of total emissions in Japan.1)
Some reports have investigated reduction of iron ore with hydrogen in order to avoid generation of CO2 emissions. However, there are problems with this approach, as an endothermic reaction is involved2) and the technology has not been commercialized. Therefore, it is thought that iron ore reduction with carbon will continue to be the mainstream for the foreseeable future. The Japanese steel industry, which uses carbon reduction, experienced the two Oil Crises of the 1970s, and in response, the industry implemented a large number of energy saving measures, including the regenerative burner system and coke dry quenching (CDQ) heat recovery system.3) From the viewpoint of carbon-saving, Japanese steel technology is the world’s most advanced. CO2 is generated by various steel manufacturing processes, but the largest source is the blast furnace process.
Under these circumstances, Japanese steel makers are participating in a National Project called COURSE50 (CO2 Ultimate Reduction in Steelmaking Process by Innovative Technology for Cool Earth 50) with the aim of developing technologies to reduce CO2 emissions from steel works. A technology for collecting CO2 generated by the blast furnace is being developed as part of COURSE50. However, it is necessary to examine the uses of the CO2 which is collected in such processes. CCS (Carbon dioxide Capture and Storage) for collected CO2 is being studied intensively, led by Europe, the United States and Japan, and a CO2 reuse technology represented by CCU (Carbon Capture and Utilization) is expected in the future. If an efficient technique for decomposing CO2 into carbon and oxygen is developed, reuse as resources will be possible. For example, carbon and oxygen gas produced from CO2 gas can be used as raw materials in steel manufacturing processes.
In an earlier studies, we suggested a method for decomposing CO2 gas by using electrolysis of molten salt and a ZrO2 solid electrolyte.4,5,6,7,8,9) As a new method to reduce metallic oxides such as titanium, vanadium, tantalum and nickel to their metallic state, an OS process consisting of electro-reduction of CaO and calciothermic reduction in a CaCl2 bath has been studied.10) The energy inputs in the CO2 gas decomposition reaction in this method are supplied by electro-reduction of CaO and the calciothermic reduction. The steel works is advantageous for practical application of this invention because it is close to production facilities where CO2 and exhaust heat are generated, enabling use of this waste heat as a thermal energy source. Since the CO2 decomposition process requires a new electric energy input, the process can be established by using renewables such as solar power and wind power. In particular, as the electric energy used in this process is direct current (DC), the process is effective for the direct use of renewable energy, in that DC generation is the mainstream. In a study using CaCl2–CaO molten salt and 9.7% CO2–Ar mixed gas (CO2 gas and Ar gas were blown at 5.0×10⁻⁸ m3/s and 4.7×10⁻⁷ m3/s, respectively), K. Otake et al.6) reported that the current efficiency was 78.5% and the collected carbon yield was 36%. Although the CO2 decomposition amount is low because of the small scale of the experiments at the present stage (for example, the CO2 decomposition amount is about 1.5 parts per billion with a large blast furnace), this is considered to be one potential process for the future.
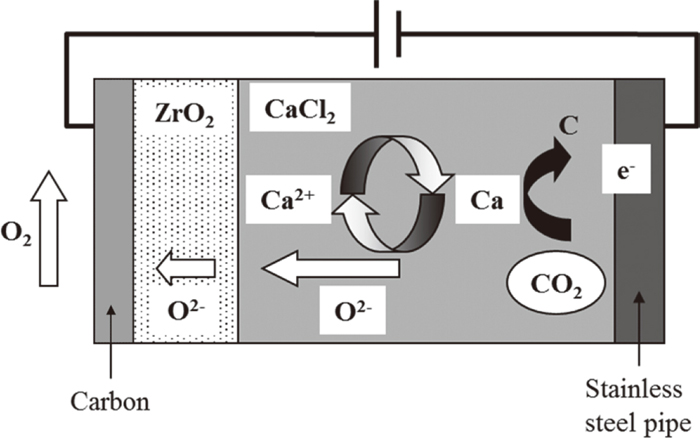
A schematic diagram of the reduction mechanism4,5,6,7,8,9) is shown in Fig. 1. The decomposition mechanism of CO2 gas is shown in Eqs. (1), (2), (3), (4). CaO is ionized in the molten salt, as represented by Eq. (1). When an electrical voltage is applied between two electrodes, metallic Ca is produced near the cathode, as shown in Eq. (2). This metallic Ca rapidly dissolves in CaCl2, and the dissolved Ca then reacts thermodynamically with the CO2 gas near the cathodic electrode to produce carbon and CaO by the reaction in Eq. (3). Because this byproduct CaO is ionized again, these chemical reactions (Eqs. (1), (2), (3)) are repeated cyclically in the furnace. On the other hand, the oxygen anions in the molten salt diffuse through the ZrO2 solid electrolyte and are removed as oxygen gas at the opposite side of the ZrO2 anode, as shown in Eq. (4). When considering the diffusion rate of oxygen anions in a ZrO2 solid electrolyte, a higher electrolysis temperature is desired. Carbon powder was inserted inside the ZrO2 tube to give electrical conductivity. Therefore, the anodic reaction in Eq. (4) should be modified as Eq. (5). The reaction in Eq. (5) (i.e., formation of CO2) occurs inside the ZrO2 tube. However, this is not desirable from the viewpoint of complete CO2 decomposition to carbon and oxygen gas. This technical problem should be addressed in the future.
|
1/2
CO
2
(
g
)
+Ca=1/2 C+CaO
| (3) |
|
O
2-
(
in molten salt
)
=
O
2-
(
in
ZrO
2
)
=1/2
O
2
+
2e
-
| (4) |
|
O
2-
(
in
ZrO
2
)
+C=CO or
CO
2
+
2e
-
| (5) |
Another mechanism is carbonate formation in molten salt.11) CO2 gas dissolves as carbonate ions (Eq. (6)), and electrochemical decomposition of these carbonate ions occurs on the cathodic electrode, as shown in Eq. (7).
|
CO
2
(
g
)
+
O
2-
=
CO
3
2-
| (6) |
|
CO
3
2-
+
4e
-
=C+
3O
2-
| (7) |
Uchiyama et al. reported that the amount of CO2 gas decomposition could be increased by increasing the surface area of the ZrO2 solid electrolyte used for the anode,7) and proposed that the O2− transfer rate in the ZrO2 solid electrolyte of the anode is one of the rate-determining processes of the CO2 gas decomposition mechanism. However, the cathode mechanism is expected to be involved in CO2 gas decomposition.
In previous studies, a stainless steel pipe was used as the CO2 gas inlet into the molten salt and as the cathodic electrode.7) For reaction control of CO2 and Ca in the molten salt, corresponding to Eq. (3), it is important to investigate the shape and form of the CO2 gas bubbles. For example, the amount of CO2 gas decomposition is expected to be increased by increasing the specific surface area per unit volume of CO2 gas bubbles by forming fine bubbles and inducing the rise of those CO2 gas bubbles near the cathodic electrode.
Although it is difficult to observe bubbles under the high temperature and airtight conditions necessary in experiments, the water model experiment is one of the most useful methods for understanding the form of bubbles. Therefore, in this study, we investigated the influence of the tip shape of the pipe, the pipe diameter and the wettability of the gas injection pipe on the bubble shape in a water model experiment and hot model experiment.
2. Water Model Experiment
2.1. Experimental
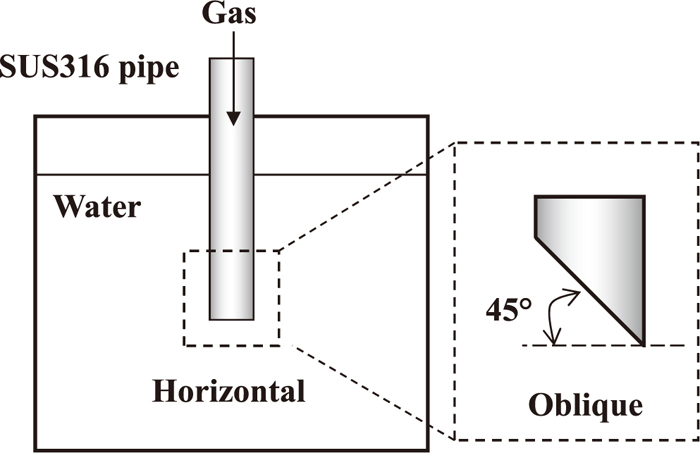
Figure 2 shows a schematic view of the water model experiment. In this experiment, the water and a transparent water tank represented the high temperature molten salt and refractory crucible of the hot model experiment, respectively, and the gas injection pipe (SUS316) to be used in the hot model experiment was placed in the top center of the water.
The shape of the bubbles from the gas injection pipe was investigated by using video cameras installed on the side surface and upper surface of the water tank. The bubble volume and specific surface area per bubble were calculated from the number of bubbles per minute and the injection rate. The specific surface area per bubble was calculated assuming a spherical bubble shape. A 90%CO2-Ar mixed gas was blown at the rate of 6.7×10⁻⁷ m3/s from the stainless steel pipe into the water of the water model apparatus.
The water model experiment was carried out to study the influence of the pipe diameter, pipe tip shape and wettability of the gas injection pipe on the bubble shape. Gas injection pipes with two different pipe diameters were used. Pipe type A was 6.0 mm in external diameter and 4.0 mm in internal diameter. Pipe type B was 3.0 mm in external diameter and 1.0 mm in internal diameter. The shapes of the pipe tip were a horizontal type and an oblique type. Wettability experiments were conducted by changing the contact angle by applying a water repellent to the surface of the gas injection pipe. In both the water model experiment and the hot model experiment, it was difficult to measure the contact angles of the gas when it was continuously injected through the pipe. Therefore, the measurements of the contact angle were carried out 4 times with a SUS316 plate. The contact angles without the water repellent were between 57° and 67° (good wettability), while those with the water repellent were between 102° and 121° (poor wettability), confirming that wettability changed when utilizing the water repellent.
2.2. Results
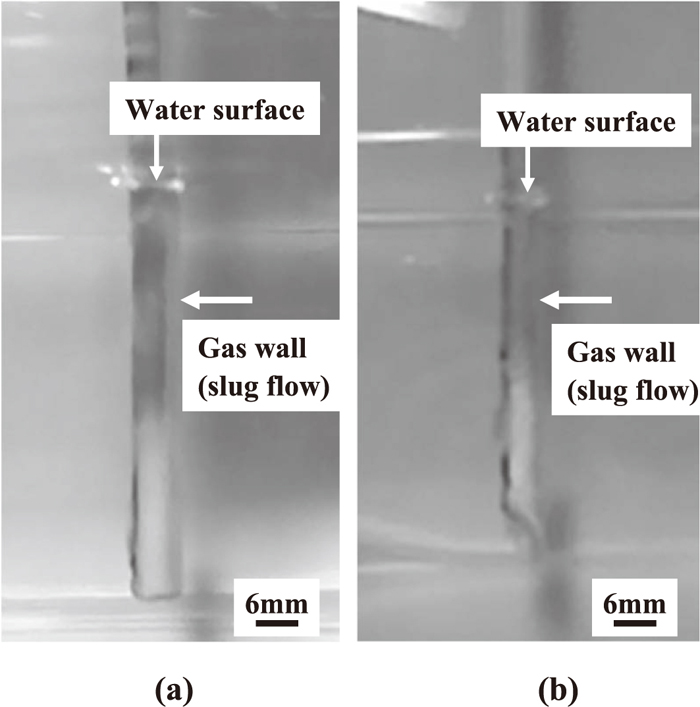
Figure 3 shows photographs of the water model experiment with pipe type A. Table 1 lists the experimental conditions and results. Figures 3(a) and 3(b) correspond to Test No. 1 and Test No. 2 in Table 1, respectively. Gas bubbles were generated under both the horizontal and oblique shape conditions, and the injected gas was released from the tip. Figure 4 shows photographs of the water model experiment with pipe type A when the water repellent was applied. Figures 4(a) and 4(b) correspond to Test No. 5 and Test No. 6 in Table 1, respectively. Gas bubbles were not generated under either the horizontal or oblique shape conditions, and the injected gas was not released from the tip. In this case, i.e., poor wettability of the gas injection pipe, the gas rose in such a way as to cover the pipe surface (slug flow). Without the water repellent, the number of bubbles was larger with the oblique shape than with the horizontal shape, and the number of bubbles increased when the external and internal diameters of the gas injection pipe were reduced. Therefore, reducing the external and internal diameters and use of the oblique tip shape is considered to be advantageous for increasing the reaction efficiency of Eq. (3), assuming good wettability of the gas injection pipe in the molten salt.
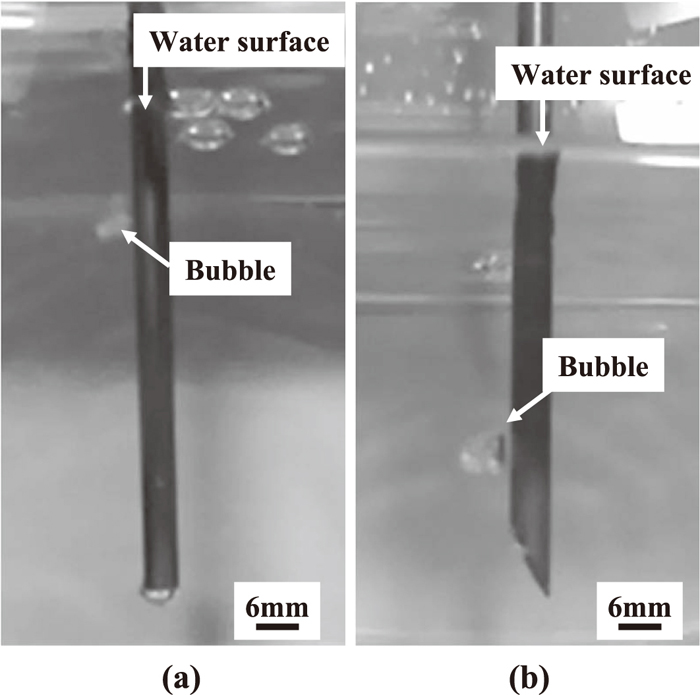
Table 1. Experimental conditions and results of water model experiment.
| Nozzle conditions | | | |
|---|
| Test No. | Pipe type | External diameter and internal diameter mm | Shape of the pipe tip | Water repellent | Number of bubbles per minute | Average bubble volume cm3 | Average specific sarface area per a bubble cm−1 |
|---|
| 1 | A | 6×4 | Horizontal | Not using | 150 | 0.267 | 7.513 |
| 2 | A | 6×4 | Oblique | Not using | 192 | 0.208 | 8.158 |
| 3 | B | 3×1 | Horizontal | Not using | 252 | 0.159 | 8.932 |
| 4 | B | 3×1 | Oblique | Not using | 331 | 0.121 | 9.782 |
| 5 | A | 6×4 | Horizontal | Applied | No bubbles | – | – |
| 6 | A | 6×4 | Oblique | Applied | No bubbles | – | – |
| 7 | B | 3×1 | Horizontal | Applied | No bubbles | – | – |
| 8 | B | 3×1 | Oblique | Applied | No bubbles | – | – |
On the other hand, under all the conditions of poor wettability (i.e., when the water repellent was applied), the injected gas was not released from the tip, but rather rose and covered the gas injection pipe surface, regardless of the tip shape and the external/internal diameters of the pipe. These results showed substantially the same tendency as previous studies.12,13,14)
3. Electrochemical Decomposition of CO2 Gas in CaCl2–CaO Molten Salt
3.1. Experimental
The setup of the hot model experiment is shown in Fig. 5.
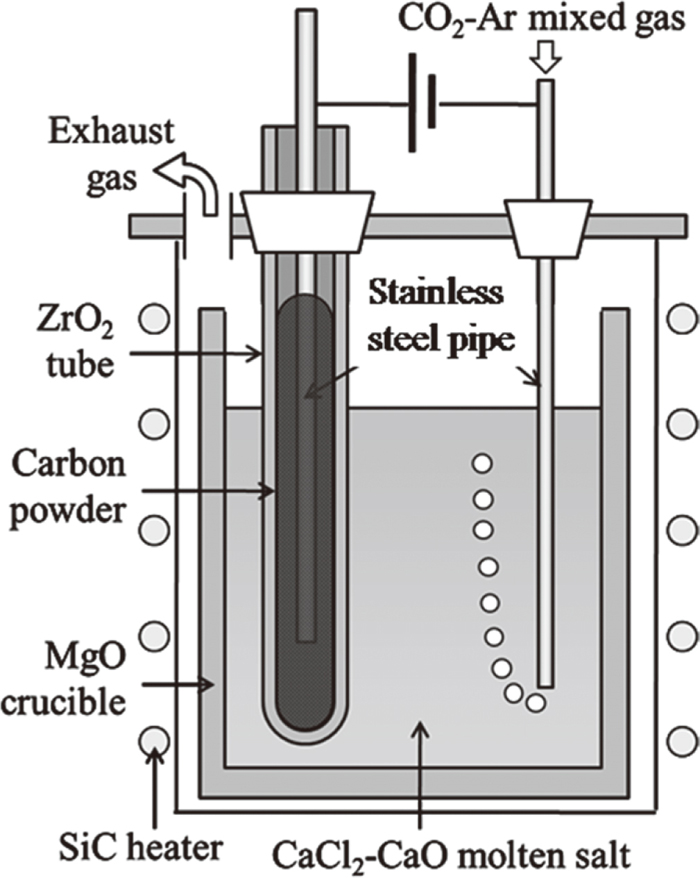
A stainless steel pipe was used as the CO2–Ar mixed gas inlet and as the cathodic electrode. The cathodic electrode in the hot model experiment was the same type of pipe (SUS316) as that used in the water model experiment. A one-end-closed tube made of a ZrO2 solid electrolyte was used to remove oxygen ions in the molten salt. The tube (external diameter: 17 mm, thickness: 2 mm, length: 500 mm) was produced by Nikkato Co. under the tradename YSZ-8. The electrical conductivity of YSZ-8 is 9.1 Ω−1m−1 at 1173 K. A carbon powder was alternatively inserted inside the ZrO2 tube to give electrical conductivity. This electrode was attached to the cover of the stainless steel vessel with a silicone stopper. When the outlet of this ZrO2 tube was inside the reactor, the oxygen gas, which was produced at the internal surface of the ZrO2 tube, reacted with the carbon produced in the molten salt. Namely, recombination of carbon with the oxygen gas occurred. Therefore, it was important to discharge the oxygen gas without allowing chemical contact with the molten salt; this was accomplished by using a long tube. CaCl2 (>95%, Wako Chemical Co.) was mixed with CaO (99.9%, Kanto Chemical), which was calcined in air in advance. The CaO was weighed to be 0.5 mol%. The magnesia crucible used in the hot model experiment was filled with this mixture as an electrolyte.
After the salt was dehydrated, the CaCl2–CaO mixture was heated up slowly to 1173 K in an Ar atmosphere. A CO2–Ar mixed gas was then blown through the cathodic pipe into the molten salt. The mixed gas passed through the molten salt, and the exhausted gas was introduced to the gas analyzers from the outlet. The CO2 saturation in the molten salt was checked by analyzing the CO2 concentration of the exhausted gas which had passed through the molten salt. When the CO2 concentration of the exhausted gas reached the blow CO2 concentration, the CO2 concentration in the molten salt was assumed to have reached saturation. After the salt was saturated with CO2 gas, electrolysis was started at 3.1 V. This electrolysis voltage was larger than the theoretical decomposition voltage of CaO and smaller than that of CaCl2. Since the voltage was applied from the state of sufficient CO2 in the molten salt, the reaction of CO2 and Ca generated by Eq. (2) occurred immediately after the voltage was imposed. During electrolysis, the concentrations of the CO2 gas and CO gas in the exhaust gas were measured at the outlet to investigate the decomposition behavior of the CO2 gas. The gas concentrations were measured with an infrared gas analyzer (Yokogawa Co.). After electrolysis with a constant cell voltage, the cathodic pipe was raised to the upper part of the vessel, and the furnace was cooled to room temperature in an Ar atmosphere. Black reduction products existed at the surface of the solidified salt and around the cathodic electrode. These substances were collected and washed with distilled water, acetic acid, distilled water, ethanol and acetone in that exact order in order to remove the solidified salt residue from the reduction products completely. The reduction products were observed with a transmission electron microscope (TEM, JEOL JEM-2000FX, acceleration voltage: 200 kV) and identified by powder X-ray diffraction (XRD, X’pert Pro, Philips Co.) measurement using Cu-Kα radiation. The submergence depth of the ZrO2 solid electrolyte in the molten salt was considered to be about 40 mm, as can be inferred from the line on the ZrO2 tube after cooling. Deepening the immersion of the anode (ZrO2 tube) and cathode (SUS316 pipe) is effective for increasing CO2 decomposition, but because the chamber structure did not allow supplemental addition of the sample material when the bulk decreased during dissolution of the salt, the immersion depth was approximately 40 mm in this experiment. The inner surface area of the ZrO2 solid electrolyte was calculated as 1.6×10⁻³ m2 from the immersion depth and the inner diameter of the solid electrolyte.
Electrochemical decomposition of CO2 gas was carried out to study the influence of the pipe tip shape and the pipe diameter. Two different pipe diameters were used in the gas injection pipes (pipe types A and B), and the shapes of the pipe tip parts were the horizontal type and oblique type. The combinations of these features resulted in a total of four types of pipes. A 9.68%CO2-90.32%Ar mixed gas was blown at the rate of 5.2×10⁻⁷ m3/s (2.3×10⁻⁶ mol/s) from the cathodic stainless steel pipe into the molten salt in a MgO crucible. The current value required for CO2 decomposition was calculated as 0.89 A by Eqs. (2) and (3). Therefore, the current density of the anode was calculated as 5.2×10² A/m2 from the surface area of the ZrO2 solid electrolyte (1.6×10⁻³ m2). In addition, the electric resistance of CO2 decomposition was calculated as 3.4 Ω at 3.1 V. Calculated from the thickness and the electrical conductivity of the ZrO2 solid electrolyte, its electrical resistance was 0.13 Ω at 1173 K. Thus, it was a condition that the complete decomposition of the injected CO2 depended on good contact between the carbon powder and the pipe inside the ZrO2 tube. As the current value is calculated as 0.89 A at 0.13 Ω, the maximum current density is expected to be approximately 1.4×10⁴ A/m2.
3.2. Results
Figure 6(a) shows the time dependency of the CO2 and CO gas concentrations in the exhaust gas and the time dependency of the current density during electrolysis with pipe A when the horizontal tip was used. Figure 6(b) shows the same values when the oblique tip was used. The surface area of the electrode for evaluation of the current density was measured from the height of the solidified molten salt after cooling. The depth of the molten salt is related to the area where oxygen ions are transferred from the molten salt to the internal surface of the ZrO2 tube. The anodic current density was derived from these surface areas. Since the current density was measured immediately after the voltage was imposed, the function of the ZrO2 solid electrolyte as an anode was confirmed. After electrolysis was initiated, the concentration of the CO2 gas decreased, while the concentration of the CO gas increased slightly, therefore suggesting that the decomposition of CO2 gas to carbon and oxygen gas occurred in the molten salt, and the ZrO2 solid electrolyte worked as an oxygen ionic conductor. The current density gradually decreased as the electrolysis duration became longer. This behavior is due to the decrease in the effective surface area of the ZrO2 solid electrolyte. Oxygen ions migrate from the molten salt to the ZrO2 solid electrolyte, and then to the internal surface of the ZrO2 tube, where oxygen gas is produced. As mentioned above, carbon powder was inserted inside the ZrO2 tube. However, the oxygen ions react with the carbon powder at the interface of the carbon and the internal surface of the ZrO2 solid electrolyte, and produce CO and CO2 by the reaction shown in Eq. (5). Because the carbon is consumed, the effective surface area inside the ZrO2 tube decreases and electrical resistance increases during electrolysis. The decrease in the CO2 gas concentration when the oblique tip was used was larger than that when the horizontal tip was used.
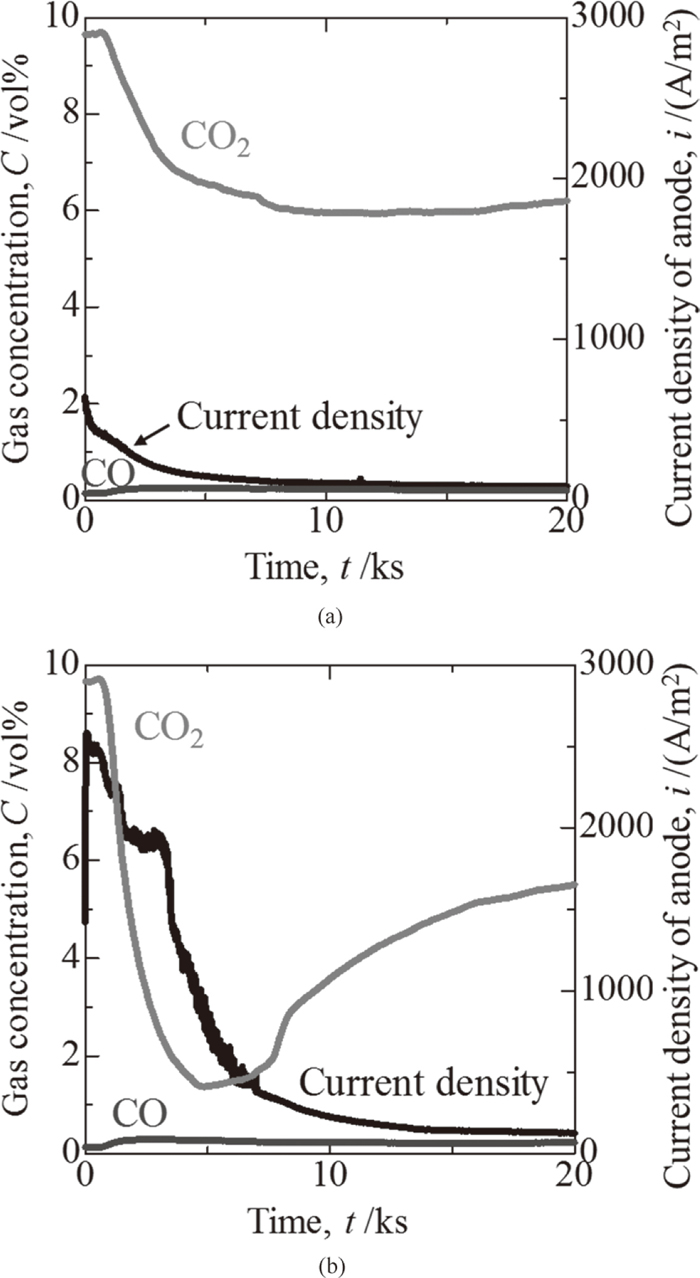
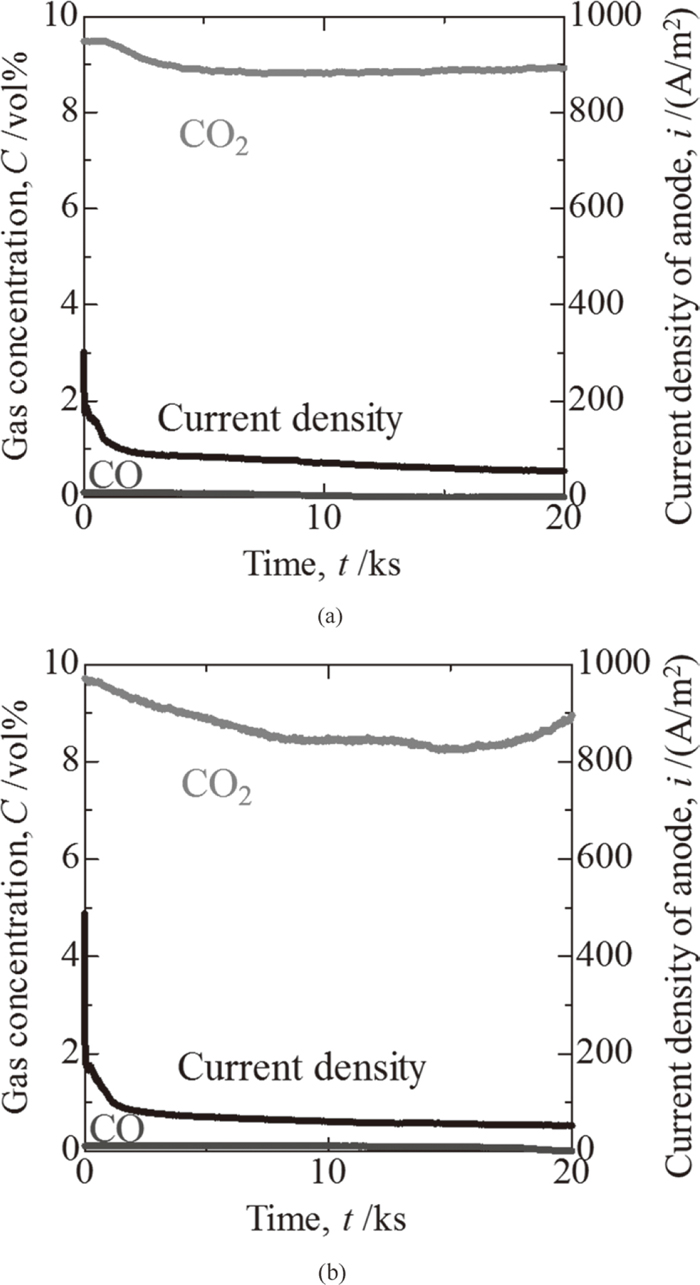
Figure 7(a) shows the time dependency of the CO2 and CO gas concentrations in the exhaust gas and the time dependency of the current density during electrolysis with pipe B when the horizontal tip was used, while Fig. 7(b) shows the same values when the oblique tip was used. As with the results for pipe A, after electrolysis was started, the concentration of the CO2 gas decreased. However, the decrease of the CO2 gas concentration with pipe B was smaller than that with pipe A.
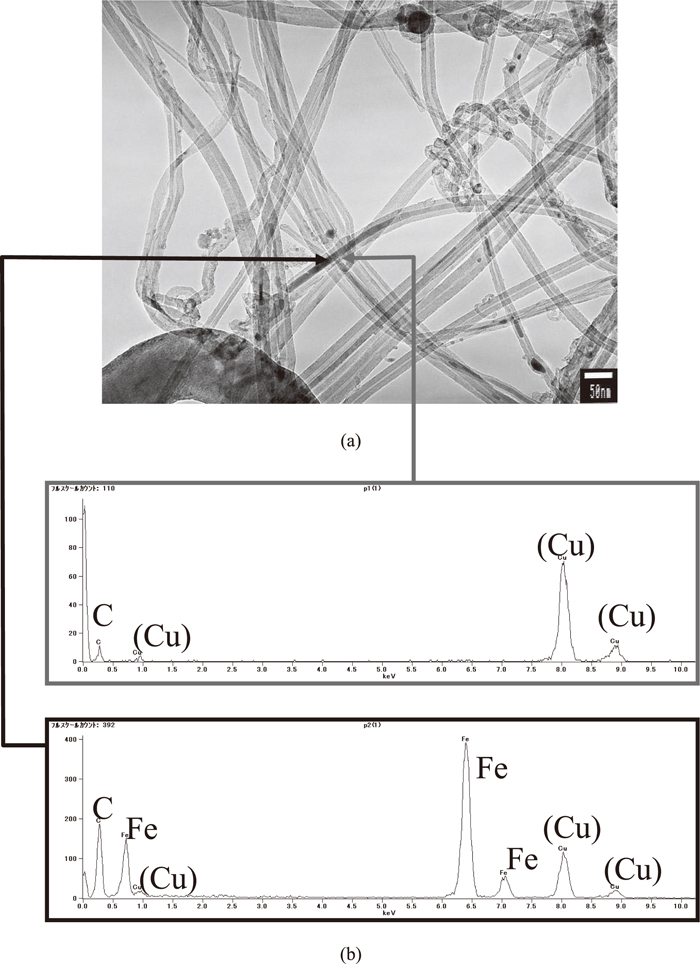
After electrolysis, the reduction product adhered to the cathodic electrode, and some parts of the black powder were recovered in the solidified salt. These were washed to remove the solidified salt and then observed by TEM. The images of the carbon produced in the molten salt are shown in Fig. 8. Carbon nanotubes contained in the black particles were frequently observed. These black particles were identified as carbon, iron and copper by Energy Dispersive X-ray (EDX) spectroscopy. The copper was derived from the stage mesh, and the iron was derived from the stainless steel pipe used as the cathodic electrode. According to TEM observation, the volume fraction of the carbon nanotubes was 5–30% of the total amount of precipitates recovered in the experiment.
4. Discussion
With the same pipe, the decrease of the CO2 gas concentration when using the oblique tip was more remarkable than when using the horizontal tip. This result is considered to correspond to an increase in the number of bubbles under the condition of good wettability (i.e., when not using the water repellent) of the gas injection pipe in the water model experiment. It is likely that the form of the CO2 gas in the molten salt was bubble-shaped. Therefore, the amount of CO2 gas decomposition was increased by increasing the specific surface area per unit volume of CO2 gas bubbles by generating fine bubbles.
When the injected gas was not released from the tip, and instead rose and covered the gas injection pipe surface, the decomposition efficiency of the CO2 gas was reduced significantly by blockage of the current around the cathodic pipe. In brief summary, it is thought that the injected CO2–Ar mixed gas decomposed while floating up in the molten salt after being released from the tip.
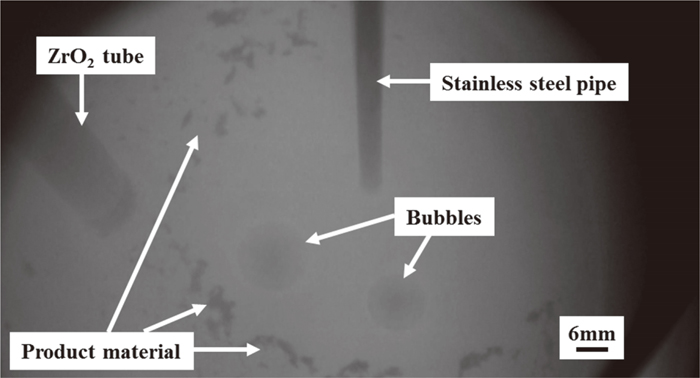
Figure 9 shows a photograph of the electrochemical decomposition of CO2 gas in CaCl2–CaO molten salt. This photograph was taken by mounting a glass window on the upper chamber in the experiment with pipe A with the horizontal tip. Since the evaporant has fogged the glass window, the photo is unclear. Bursting of bubbles was observed in areas away from the cathode pipe. Furthermore, a black substance was precipitated, and the precipitation range increased over the electrolysis time.
The decrease of the CO2 gas concentration when pipe B was used was smaller than when pipe A was used. Since the specific surface area per bubble under the pipe B conditions was larger than with pipe A, assuming the same shape of the pipe tip, use of pipe A for CO2 decomposition was expected to be advantageous to increase the reaction efficiency of Eq. (3). However, the decrease of the CO2 gas concentration when pipe B was used was smaller than when pipe A was used. This result is attributed to the difference in the area of the cathodic electrode. In this experimental apparatus, the SUS316 pipe is not only used as the gas injection site, but also has a cathodic electrode function. Because the external diameter of pipe A was 6.0 mm while that of pipe B was 3.0 mm, the cathode area of pipe B was half that of the pipe A. This was considered to have been an unfavorable condition for CO2 decomposition. Since the anodic current density was calculated from these surface areas, the anodic current density of pipe B was approximately half the value of pipe A when the horizontal tip was used. In summary, for improvement of CO2 decomposition and larger carbon production, it is important to increase the cathodic electrode area.
5. Conclusions
The influence of the gas injection pipe on CO2 decomposition by CaCl2–CaO molten salt was studied in water model and hot model experiments.
(1) The water model experiment was carried out to study the influence of the pipe tip shape, pipe diameter and wettability of the gas injection pipe on the bubble shape in the molten salt. Bubbles were formed with both the horizontal and oblique tips when the wettability of the gas injection pipe was good. On the other hand, slug flows appeared when wettability was poor.
(2) In the hot model experiment, the current density was measured, and it was found that the CO2 gas concentration decreased. Precipitation of carbon was observed by TEM and Energy Dispersive X-ray (EDX) spectroscopy of the samples after the experiment.
(3) With the same pipe, the decrease of the CO2 gas concentration when using the oblique tip was more remarkable than when using the horizontal tip. It is likely that the form of the CO2 gases in the molten salt was bubble-shaped. It is thought that the injected CO2 gas decomposed while floating up in the molten salt in the form of bubbles after the gas was released from the tip.
(4) It was concluded that increasing the cathode electrode area is important for improvement of CO2 decomposition and larger carbon production.
Acknowledgements
The authors wish to thank M. Kitamura of Hokkaido University for his assistance with the experiments in this research.
References
- 1) National Greenhouse Gas Inventory Report of Japan 2014, National Institute for Environmental Studies, Tsukuba, (2014), 35.
- 2) K. Wada, K. Kodama and A. Sigemi: Tetsu-to-Hagané, 47 (1961), 1617.
- 3) T. Mori, T. Fujimura and S. Sato: Tetsu-to-Hagané, 64 (1978), 1914.
- 4) K. Otake, H. Kinoshita, T. Kikuchi and R. O. Suzuki: J. Phys.: Conf. Ser., 379 (2012), 012038.
- 5) R. O. Suzuki, K. Otake, T. Uchiyama, H. Kinoshita, N. Sakaguchi and T. Kikuchi: ECS Trans., 50 (2012), 443.
- 6) K. Otake, H. Kinoshita, T. Kikuchi and R. O. Suzuki: Electrochim. Acta, 100 (2013), 293.
- 7) T. Uchiyama, N. Sakaguchi, K. Otake, T. Kikuchi and R. O. Suzuki: CAMP-ISIJ, 25 (2012), 659, CD-ROM.
- 8) T. Uchiyama, T. Wakamatsu, N. Sakaguchi, T. Kikuchi and R. O. Suzuki: CAMP-ISIJ, 26 (2013), 231, CD-ROM.
- 9) T. Uchiyama, T. Wakamatsu, N. Sakaguchi, T. Kikuchi and R. O. Suzuki: CAMP-ISIJ, 26 (2013), 830, CD-ROM.
- 10) R. O. Suzuki, K. Teranuma and K. Ono: Metall. Mater. Trans. B, 34B (2003), 287.
- 11) B. Kaplan, H. Groult, A. Barhoun, F. Lantelme, T. Nakajima, V. Gupta, S. Komaba and N. Kumagai: J. Electrochem. Soc., 149 (2002), No. 5, D72.
- 12) Z. Wang, K. Mukai and D. Izu: ISIJ Int., 39 (1999), 154.
- 13) T. Watanabe and M. Iguchi: Tetsu-to-Hagané, 94 (2008), No. 8, 271.
- 14) T. Watanabe and M. Iguchi: ISIJ Int., 49 (2009), 182.