Regular Article
Parameters Optimization, Sticking Mechanism and Kinetics Analysis of Fine Iron Ore in Fluidized-Reduction Process
2016 Volume 56 Issue 11 Pages 1929-1937

Details
2016 Volume 56 Issue 11 Pages 1929-1937
ORD-S fine iron ore is reduced in fluidized bed, and fine iron ore particles are evaluated through mechanical and dynamic analyses. This study aims to obtain the changing direction of the operating parameters by synthetically analyzing the effect of temperature, velocity of reducing gas, reducing gas atmosphere, size of fine iron ore particle, and coating oxide composition on the fluidized reduction sticking process; draw economic, convenient, and effective operating parameters; and provide theoretical and technical basis for the economical and rational use of the ORD-S fine iron ore. The optimal operating parameters require to reduce ORD-S fine iron ore include 923 K to 1023 K temperatures, particle size range of 0.63 mm to 1.0 mm, linear velocity of 0.6 m/s, hydrogen accounting for 80 vol.% of the total carbon monoxide and hydrogen mixture, and coating MgO accounting for 2 mass% of the total quality of fine iron ore. Under the optimal experimental conditions, the critical radius of solid bridge is 90–105 nm, the apparent activation energy E of the chemical reaction is 22.48 kJ/mol, and the limit link of chemical reaction speed is the internal diffusion speed.
Fluidized beds have the advantage of directly reducing fine iron ore without the use of non-coking coal, replacing the blast furnace for fine iron ore reduction and pre-reduction; thus, efficient heat and mass transfer is achieved.1) However, defluidization caused by sticking easily occurs during the reduction of fine iron ores in the fluidized bed, and the lack of reduction gas resources delays the industrialization process.2,3,4,5)
To prevent defluidization in the fluidized bed, some methods were proposed by early scholars,6,7) such as coating oxide method,8) use of the stirring mechanism,9) and low temperature reduction method.3) Through previous research, the main factors that affect sticking include temperature, linear velocity of reduction gas, atmosphere of reducing gas, particle size of iron ore, and composition and content of the coating oxide. However, the effect of these factors on the fluidized reduction of primary and secondary roles is uncertain. Currently, scholars recognize three mechanisms behind sticking. First, the iron surface has high energy and forms a strong adhesion force among the reducing fine iron ore particles. Second, the high-energy iron whiskers of the fine iron ore particles interconnect on the surface. Gransden et al.10) found that the iron whiskers of the surface particles form mutual collision between iron atoms, resulting in the reunion of defluidization. Third, high-temperature zones, where CaO–SiO2–FeO will stick together, are produced when sticking occurs. R. Degel11) found a strong tendency to produce sticking when the temperature reaches 1083 K. As the temperature increases, fine iron ore gradually soften and melt. However, the mechanical analysis of microscopic iron atoms and the kinetics of the reduction process during sticking are uncertain.
This study on reducing ORD-S fine iron ore is conducted under atmospheric pressure. The aim of this study is to determine operating parameters and optimization direction as well as obtain economical, convenient, and effective operating parameters through the orthogonal experimental method. Furthermore, the effect of temperature, linear velocity of reducing gas, atmosphere of the reduction gas, particle size of iron ore, and composition and content of the coating oxide ingredients on fluidized reduction and sticking is evaluated. Under the optimal parameters, the mechanical sticking of microscopic particles is analyzed. The fluidized state is evaluated according to the particles with the same force, and the radius of the critical solid bridge when sticking occurred is derived. The apparent activation energy and the reduction reaction speed control links are evaluated using dynamic analysis. Fluidized bed industrialization should eventually be achieved.
The fine iron ore used in this experiment is Brazil ORD-S fine iron ore, and the composition and size of the particles are shown in Tables 1 and 2. Three levels of particle ranges at <0.15, 0.15–0.63, and 0.63–1.0 mm are selected in this study. The MgO content is greater than 99 mass% magnesium oxide powder additive and the average particle diameter of MgO is 5.8 μm. Meanwhile, the CaO content in the calcium oxide powder additive is greater than 99 mass%, and the average particle size is 5.8 μm.
| Compositions | TFe | FeO | CaO | MgO | SiO2 | P | MnO | Al2O3 |
|---|---|---|---|---|---|---|---|---|
| Mass% | 65.99 | 0.41 | 0.058 | 0.047 | 3.330 | 0.079 | 0.047 | 0.96 |
| Size | <0.15 mm | 0.15 mm– 0.63 mm | 0.63 mm– 1.0 mm | 1 mm– 3 mm | >3 mm |
|---|---|---|---|---|---|
| Proportion | 22% | 31% | 33% | 9% | 5% |
The main apparatus in this study is a fluidized bed whose reactor is a double quartz tube, and the inner tube is another fluidized bed. Gas is preheated through appearance and inner tube sandwich and then flows into the fluidized bed. The outside of the outer tube contains heated cabinets. The different flows of carbon monoxide and hydrogen are regulated by multiple sets of flow meters to ensure that the composition content and velocity meet the experimental requirements. Through the inner tube reduction of iron ores, the reduction temperature in the fluidized bed is measured by thermocouple. Preheating and cooling of fine iron ores in the fluidized bed is conducted by passing through high-purity nitrogen for exhaust and protection. To evaluate the fluidized reduction sticking situation, the bed pressure difference ΔP is measured using a Pressure sensor. The experimental apparatus is shown in Fig. 1.

Experimental apparatus.
The factors that affect fluidized reduction, namely, reduction temperature, linear velocity of reducing gas, coating oxide in fine iron ore, particle size of fine iron ore, and H2 volume content in the reducing gas CO–H2 mixture, are considered in experimental programs and methods; three levels of various factors are taken.7,8,13,14,15) The five factors are denoted by letters A, B, C, D, and E, where A represents the reduction temperature, A1 represents 923 K temperature, A2 is 1023 K, and A3 is 1123 K; B represents the linear velocity of the reducing gas, B1 is 0.4 m/s, B2 is 0.6 m/s, and B3 is 0.8 m/s; C represents the coating oxide that accounts for 2 mass% of the total fine iron ore, C1 represents ORD-S fine iron ore without coating, C2 represents coating CaO that accounts for 2 mass% of the total fine iron ore, and C3 is coating MgO which accounts for 2 mass% of the total fine iron ore; D represents the diameter particles size of ORD-S fine iron ore, D1 denotes <0.15 mm, D2 denotes 0.15–0.63 mm, and D3 denotes 0.63–1.0 mm; E represents the hydrogen volume content in reducing gas mixture, E1 is 60 vol.%, E2 is 80 vol.%, and E3 is 100 vol.%. Tables 3 and 4 show the experimental programs.
| Factor | A | B | C | D | E | ||||||||||
|---|---|---|---|---|---|---|---|---|---|---|---|---|---|---|---|
| Temperature/K | Linear velocity/m/s | Coating agent | Particle size/mm | Hydrogen volume scale | |||||||||||
| Level | A1 | A2 | A3 | B1 | B2 | B3 | C1 | C2 | C3 | D1 | D2 | D3 | E1 | E2 | E3 |
| 923 | 1023 | 1123 | 0.4 | 0.6 | 0.8 | – | CaO | MgO | <0.15 | 0.15–0.63 | 0.63–1.0 | 0.6 | 0.8 | 1.0 | |
| Condition NO. | Temperature/ K | Linear velocity/ m/s | Coating agent | Particle size/mm | Hydrogen volume scale |
|---|---|---|---|---|---|
| 1 | 923 | 0.4 | – | <0.15 | 0.6 |
| 2 | 923 | 0.6 | CaO | 0.15–0.63 | 0.8 |
| 3 | 923 | 0.8 | MgO | 0.63–1.0 | 1 |
| 4 | 1023 | 0.4 | – | 0.15–0.63 | 0.8 |
| 5 | 1023 | 0.6 | CaO | 0.63–1.0 | 1 |
| 6 | 1023 | 0.8 | MgO | <0.15 | 0.6 |
| 7 | 1123 | 0.4 | CaO | <0.15 | 1 |
| 8 | 1123 | 0.6 | MgO | 0.15–0.63 | 0.6 |
| 9 | 1123 | 0.8 | – | 0.63–1.0 | 0.8 |
| 10 | 923 | 0.4 | MgO | 0.63–1.0 | 0.8 |
| 11 | 923 | 0.6 | – | <0.15 | 1 |
| 12 | 923 | 0.8 | CaO | 0.15–0.63 | 0.6 |
| 13 | 1023 | 0.4 | CaO | 0.63–1.0 | 0.6 |
| 14 | 1023 | 0.6 | MgO | <0.15 | 0.8 |
| 15 | 1023 | 0.8 | – | 0.15–0.63 | 1 |
| 16 | 1123 | 0.4 | MgO | 0.15~0.63 | 1 |
| 17 | 1123 | 0.6 | – | 0.63~1.0 | 0.6 |
| 18 | 1123 | 0.8 | CaO | <0.15 | 0.8 |
The weight of 150 g of fine iron ore is taken in each experiment. The fluidized bed is heated to the first setting temperature before the experiment and passed through the fine iron ore and mixed reduction gas with reduction time of 60 min. To obtain metallization rate η (
Metallization rate and differential pressure of each experiment are measured and shown in Table 5.
| Result NO. | A | B | C | D | E | Metallization rate/% | ΔP/pa |
|---|---|---|---|---|---|---|---|
| 1 | A1 | B1 | C1 | D1 | E1 | 65.64 | 982 |
| 2 | A1 | B2 | C2 | D2 | E2 | 60.29 | 1383 |
| 3 | A1 | B3 | C3 | D3 | E3 | 69.89 | 1581 |
| 4 | A2 | B1 | C1 | D2 | E2 | 73.58 | 600 |
| 5 | A2 | B2 | C2 | D3 | E3 | 74.35 | 1280 |
| 6 | A2 | B3 | C3 | D1 | E1 | 76.84 | 1610 |
| 7 | A3 | B1 | C2 | D1 | E3 | 51.57 | 1210 |
| 8 | A3 | B2 | C3 | D2 | E1 | 68.96 | 1520 |
| 9 | A3 | B3 | C1 | D3 | E2 | 62.36 | 900 |
| 10 | A1 | B1 | C3 | D3 | E2 | 70.98 | 1610 |
| 11 | A1 | B2 | C1 | D1 | E3 | 64.46 | 910 |
| 12 | A1 | B3 | C2 | D2 | E1 | 56.45 | 1350 |
| 13 | A2 | B1 | C2 | D3 | E1 | 57.71 | 1250 |
| 14 | A2 | B2 | C3 | D1 | E2 | 83.84 | 1580 |
| 15 | A2 | B3 | C1 | D2 | E3 | 72.54 | 580 |
| 16 | A3 | B1 | C3 | D2 | E3 | 75.96 | 1470 |
| 17 | A3 | B2 | C1 | D3 | E1 | 70.63 | 920 |
| 18 | A3 | B3 | C2 | D1 | E2 | 51.45 | 1280 |
The purpose of fluidized reduction is to achieve greater metallization rate without sticking. Therefore, higher metallization rate and pressure are chosen.
The orthogonal experiment analysis data are shown in Table 6. Note: Ki represents the sum of the test results for the corresponding level number i on each columns; ki=Ki/s, where s is the number of times that appear on any column in this table s=6; R=max{k1 , k2, k3}-min{k1 , k2, k3}.
;%0A%09%09%09newWindow.document.open();%0A%09%09%09newWindow.document.write('<img src=%22./Graphics/56_1929_tbl_6.jpg%22>');%0A%09%09%09newWindow.document.close();%0A%09%09)
|
Note: Ki represents the sum of the test results for the corresponding level number i on each columns; ki=Ki/s, where s is the number of times that appear on any column in this table s=6; R=max{k1 , k2, k3}-min{k1 , k2, k3}.
For the metallization rate, the primary and secondary factors affecting the fine iron ore fluidized reduction are coating oxide, temperature, linear velocity, particle size, hydrogen content of the gas mixture. The optimum process parameters are C3A2B2D2E3, specifically the coating MgO accounting for 2 mass% of the total fine iron ore, 1023 K temperature, linear velocity is 0.6 m/s, particle size range of 0.15–0.63 mm, and hydrogen accounting for 100 vol.% of reducing gas. For the pressure degree, the primary and secondary factors affecting the fine iron ore fluidized reduction are coating oxide, temperature, particle size, hydrogen content of the gas mixture, linear velocity. The optimum process parameters are C3A1D1E1B2, specifically the coating MgO accounting for 2 mass% of the total fine iron ore, 923 K temperature, particle size range of <0.15 mm, linear velocity of 0.6 m/s, and hydrogen accounting for 60 vol.% of reducing gas.
The optimum scheme is obtained under the given factor level conditions. Obtaining a better test scheme without defining the level is possible. Thus, when the selected factors and levels are not adjusted at the same time, the optimal scheme may not be suitable for the experiment. Thus, the levels of factors should be adjusted to achieve a better scheme.
The relationship between the factors and indicators can be drawn, with the factor levels as the horizontal coordinates and the experimental index of the average value of ki as the longitudinal coordinates (Fig. 2).

Change of metallization rate and pressure at different levels.
The impact of different factors on different indicators varies, so it will not be feasible to combine the importance order of the five factors affecting two indicators. However, the optimal scheme can be obtained using the comprehensive balance method. Specific balancing process is as follows.
Factor A (temperature): A heating process is conducted after the addition of the cold material, so that the metallization rate increases with the reduction reaction.12) When the temperature reaches a certain degree, the metallization rate reaches the maximum value. With the increase of temperature, the energy of the surface of the particles produced by the reduction also increases, which in turn increases the physical adsorption, making the energy of the iron whisker more prone to amalgamation, thus leading to sticking adhesion. Therefore, the selected level for the metallization rate is level 2. At low temperatures, the pressure degree is maintained at a high level with excellent efficiency. With the increase of temperature, the pressure difference decreases gradually, the sticking progressively deteriorates, and the temperature is selected at level 1. Considering the three levels and the two indicators, it is best to select the temperature between levels 1 and 2, that is, 923–1023 K.
Factor B (linear velocity): As the superficial gas velocity is increased, the upward gas drag force on the particles also increases. As the load on the particles decreases, particle spacing becomes larger, the tightness of the bed particles is reduced, porosity is increased, and the bed expansion rate increases, making it difficult for sticking to occur. With the increase in linear velocity of reduction gas, the metallization rate increases. However, when the linear gas velocity increases to a certain extent, the particles are blown out of the fluidized bed, and the metallization rate is reduced; therefore, level 2 is selected. As the particle size increases, the gravity of a single particle also increases along with the sticking force between the particles. When the linear velocity reaches a certain value, the particles are more prone to slipping. When the particle spacing in the bed is small, the expansion rate of the bed layer decreases gradually with the increase of particles, reducing the pressure difference. When the sticking force among the particles (Fc) exceeds the gas drag force (Fd), high temperature iron whiskers will reunite, which leads to the fluidization reduction of fine iron ore stick. Level 2 is selected for pressure difference. Considering the three levels and the two indicators, it is best to select the scheme of level 2. That is, the linear velocity of 0.6 m/s is selected.
Factor C (coating oxide): Different coating oxide will cause different surface morphologies. When MgO is added, the particle surface is smoother and more residues are found. The particles will be less prone to sticking and the metallization rate will reach a maximum value. When CaO is added, metallic iron largely accumulates on particle surfaces, resulting in less surface residues. These residues significantly advance to the peripheral, which makes sticking among the particles easier.8,13) A minimum rate of metallization ratio is set. For the metallization rate, MgO additive accounting for 2 mass% of the total amount of iron ore is selected. Upon oxide coating, adhesive force per unit area of the outer surface of the particles is reduced under the oxide isolation. However, sticking is not easily produced. From the experimental results, pressure is stable at a high level when the coating MgO that accounts for 2 mass% of the total quality of fine iron ore is used, resulting in the most efficient fluidization. Considering the three schemes and the two indicators, it is best to select the scheme of coating MgO that accounted for 2 mass% of the total quality of fine iron ore.
Factor D (particle size): As seen from formula (5), the larger the particle size results in more gas drag force among the particles, making the particles the less prone to loss of flow because of cementation. Therefore, appropriately increasing particle size can significantly improve metallization rate. However, the upper the limit of the particle size, which is the starting gas velocity of large particles, must be smaller than the set of superficial gas velocity. For the metallization rate, level 3 is selected. Increase of the particle momentum is conducive to reducing the particle sticking trend,14) but the specific impact mechanism of particle size on the sticking adhesive is also associated with the liner velocity of the reduction gas. Experimental results show that as the particles increase, the pressure difference decreases at first and increases eventually; thus, level 3 is selected. Considering the three levels and the two indicators, it is best to select the scheme with particle size of 0.63–1 mm.
Factor E (hydrogen content): In the CO-H2 system, the experimental results show that with the increase of H2 content, the time of bed layer pressure difference gradually declines. This is because when it reaches a certain reduction temperature, the particle surface generates iron whisker. The higher the temperature is, the higher the energy it has, which is the essential condition of the iron oxide. The reduction of iron oxide by hydrogen is an endothermic reaction, whereas the reduction of iron oxide by carbon monoxide is an exothermic reaction; therefore, hydrogen is more effective than carbon monoxide in reducing the energy of iron whisker to inhibit the sticking.15) With the increase of H2 content, the metallization rate gradually increases, and for the metallization ratio, level 3 is selected. The uniformity of H2 reduction is poor. Because of the reduction of H2O, the product of H2 can be adsorbed on the reaction interface, resulting in large H2O molecule polarization that is easily deformed. Thus, H2O molecules are more likely to be adsorbed and difficult to escape. Therefore, the lower part of the reduction product greatly reduces the reduction driving force of the upper part. Under the process of reducing defluidization in the reduction reaction of CO, the expansion of the bed is much bigger and the bed structure is looser compared with H2. The lower part of the reaction product CO2 is also relatively easy to desorb, and the gas is quickly released. The pressure difference is maintained at a higher level, resulting in better reduction effect; thus, level 1 is selected. Considering the three levels and the two indicators, it is best to select the scheme where hydrogen accounts for 80 vol% of the total carbon monoxide and hydrogen mixture.
Based on the above analyses, the best operating parameters are: 923–1023 K reduction temperature, particle size range of 0.63–1.0 mm, linear velocity of 0.6 m/s, hydrogen accounting for 80 vol.% of total carbon monoxide and hydrogen mixture, and coating MgO accounting for 2 mass% of the total quality of fine iron ore.
3.2. Analysis of Sticking Mechanism under the Optimum Operating ParametersIn order to further study on sticking mechanism, the best operating temperature range 923–1023 K are divided into six temperatures on average, respectively are 923 K, 943 K, 963 K, 983 K, 1003 K, 1023 K. Suppose all oxides of Fe are FeO, the reduction gas is CO–H2 mixture with 80 vol.% hydrogen content, the linear velocity of reduction gas is 0.6 m/s, the particle size range is 0.63–1.0 mm, coating MgO accounting for 2 mass% of the total quality of fine iron ore, and the metallization rate is 83.7%. To simplify the calculation, a single particle is taken as the object of this study. Particle restoration mechanics theory mainly includes three aspects, namely, gas drag force on the particle, cohesion among the particles, and gravity (Fig. 3).

Force of particles.
Particle sticking is affected by the external force, which is given by the following formula, when ΣF>0, iron ore powder is in fluidization state; when ΣF=0, the fine iron ore is in critical sticking state; and when ΣF<0, fine iron ore is in the defluidization state.
| (1) |
Where, Fd is gas drag force on the particle, N; Fc is particle cohesion, N; mg is gravity, N.
3.2.1. Analysis of FdAccording to bed pressure drop theory, the total drag of flow units can be calculated using the following formula:
| (2) |
Where fd is the total drag of flow units with the dimension of N/m3, ε is the fluidized bed void fraction with no dimension, μg is the gas viscosity with the dimension of Pa·S, u is the gas line speed with the dimension of m/s, dp is the particle diameter with the dimension of m and ρg is the gas density with the dimension of kg/m3.
The calculation of fluidized bed void fraction is defined in the following formula:
| (3) |
Where V0 is the volume of the material in the natural state and V is the volume of the material in the dense state.
The single powder particle drag is defined by the following formula.
| (4) |
Substitute formula (2) into formula (4) to obtain formula (5).
| (5) |
Under certain conditions, ε, ρg, and μg are fixed values. The main factors affecting gas drag on particles (Fd) are the reduction gas linear velocity (u) and the particle size (dp). Fd shows a quadratic relationship with the product of u and dp. Thus, Fd=f(udp) is the relationship of the quadratic function when u=0.6 m/s, ε=0.23, ρg and μg can be found in the list, and Fd=f(dp) is a quadratic function. Under different temperatures, the relationship between gas drag force on particles and particle size is shown in Fig. 4. In the same temperature and interparticle sticking force conditions, the larger the particle size is, the greater the gas drag force on the particle, making sticking during the reduction in the fluidized bed unlikely. With the same particle diameter and adhesive force between particles, the higher the temperature is, the greater the gas drag force on the particle. In the actual reduction process, sticking is the result of multiple factors.

Relationship between gas drag force and particle size at different temperature.
The sticking of the fine iron ore is caused by the formation of the solid bridge between particles. The sticking strength between particles is the solid bridge force, which can be expressed by the formula (6). In the formula (6) , tensile strength (σ) can better represent maximum carrying capacity of the metal under static stretching conditions. When the tensile strength (σ) of the particles of fine iron ore is below the maximum tensile stress (Fc is not large enough), their deformation is uniform, and When the tensile strength (σ) of the tensile samples is over the maximum tensile strength (Fc is large enough), the particles of fine iron ore will produce concentrated deformation and stick together. At different temperatures, the relationship between the sticking strength of particles and the radius of the solid bridge is shown in Fig. 5. At the same temperature, the sticking force increases with the increase of the solid bridge radius. When the solid bridge radius remains the same, the sticking force between particles at high temperature is larger than that in a low temperature condition. When the temperature exceeds a certain range, that is, when ΣF<0, the sticking of the fine iron ore will occur.
| (6) |

Relationship between adhesion force and the radius of solid bridge.
Where, x is radius of the solid bridge, m; σ is tensile strength of solid bridge, Pa, the value of σ which used in this manuscript is 4.0×10⁻⁶ Pa.
3.2.3. Analysis of Solid BridgesContact point of granules is defined as the point of contact consisting of a plurality of tiny crystals, and the model of three contact points is used for the calculation of adhesive force. When fine iron ore is reduced at hige temperature, the Surface diffusion of the iron atoms will form solid bridges (Fig. 6), which is the essential reason of sticking. When the particles stick together, they are in a stationary state. Then the critical radius (Xm) of the adhesion solid bridge can be calculated using formula (1) and (6). The Xm is given by following formula (7).
| (7) |

Microstructure of solid bridge.
Where, Xm is the critical radius of solid bridge; Fd is gas drag force on the particle, N; σ is tensile strength of solid bridge, Pa; mg is particle gravity, N.
The relationship between the radius of the sticking solid bridge and temperature was studied under different conditions within the operating range of the bubbling bed, and the results are shown in Fig. 7. The figure shows that the basic critical dimensions of the radius of the sticking solid bridge are 90–105 nm. The critical radius is related to the fluid properties of the particles, that is, the gas drag force. As the linear velocity of reduction gas increases, the gas drag force on the particles also increases, making defluidization unlikely to occur.16) With the increase in particle radius, the area of the particles exposed to the reduction gas increases. This behavior causes the gas drag force on the particles to increase, thereby increasing the critical radius of the sticking solid bridge. Because the critical solid bridge increases, sticking requires more adhesive force between particles.

Relationship between the radius of solid bridge and temperature.
The size of solid bridge radius depends on the iron atom diffusion rate, and the main factor involved is temperature. Based on surface atom diffusion, the calculation method of solid bridge radius is shown in formula (8).17)
| (8) |
Where, γ is surface tension, N/m; δ is lattice constant, m; k is Boltzmann’s constant, J/K; Ds is the surface diffusion coefficient, m2/s; γg is the curvature radius of contact stress, m; and t is the contact time of grains, s.
Diffusion coefficient can be calculated according to the Arrhenius equation, as seen in formula (9):
| (9) |
Where, D0 is surface self-diffusion coefficient, m2/s; E is surface diffusion activation energy, J/mol. For the surface diffusion of iron atoms, D0 is 2.4 m2/s, and E is 2.42×10⁵ J/mol.18)
At high temperatures, the lattice constant can be estimated according to theory of linear expansion, and the expression is given by following formula (10).
| (10) |
Where, δ0 is the lattice constant of the unit cell of Fe at room temperature, which number is 2.8664×10⁻¹⁰ m; α is the linear expansion coefficient, which number is 14.6×10⁻⁶/K.
The relationship between the radius of the solid bridge and time are studied at different temperatures using the formulas (8), (9), (10), and the results are shown in Fig. 8. When two ferromagnetic grains come in contact, they will form a solid bridge dozens of nanometers long; and as time progresses, the solid bridge slowly grows. As the temperature increase, the thermal motion of iron atoms intensifies. Consequently, these iron atoms obtain higher kinetic energy, making it easier for them to overcome the atomic barrier for migration. Thus, the growth rate of solid bridge is rapid, and its radius is relatively large. The higher surface energy of grains contributes to the dispersion power of the iron atom diffusion. With the formation of the solid bridge, the surface area and surface energy of the grains are reduced, causing the growth of the solid bridge to slow down in the later periods. When the temperature is lower than the Taman temperature (973 K), the solid bridge radius X, which is formed by the contact of the particles, is less than the critical radius of the solid bridge Xm. Under these conditions, the sticking force between the particles is insufficient for coherent sticking. When the temperature is higher than the Taman temperature (973 K), the solid bridge radius X is higher than the critical radius of the solid bridge Xm. Thus, the sticking force between the particles is large enough to cause defluidization.

Relationship between the radius of solid bridge and reduction time at different temperature.
In order to further study on reduction kinetics of fine iron ore, the best operating temperature range 923–1023 K are divided into six temperatures on average, respectively are 923 K, 943 K, 963 K, 983 K, 1003 K, 1023 K, the reduction gas is CO–H2 mixture with 80 vol.% hydrogen content, the linear velocity of reduction gas is 0.6 m/s, the particle size range is 0.63–1.0 mm, coating MgO accounting for 2 mass% of the total quality of fine iron ore.
The Arrhenius equation is as follows (11).
| (11) |
The rate constant of the reduction reaction can be obtained by following formula (12).
| (12) |
Taking the logarithm on the both sides of the equation, the following formula can be obtained:
| (13) |
Where k is the rate constant of reduction reaction; A is the pre-exponential factor; E is the apparent activation energy of the reaction; R is the gas constant (8.314); and η is the degree of reaction conversion.
The relationship between reduction degree of the ORD-S fine iron ore reduced on the fluidized bed and the reduction time is shown in Fig. 9. When the temperature rises from 923 K to 1023 K, the reduction degree gradually increases at the same reduction time. To obtain the same reduction degree, it need more reduction time at lower temperature, On the contrary, and to obtain the same reduction degree, it need less reduction time at higher temperature.

Relationship between the reduction degree and reduction time at different temperature.
The relationship between reduction rate
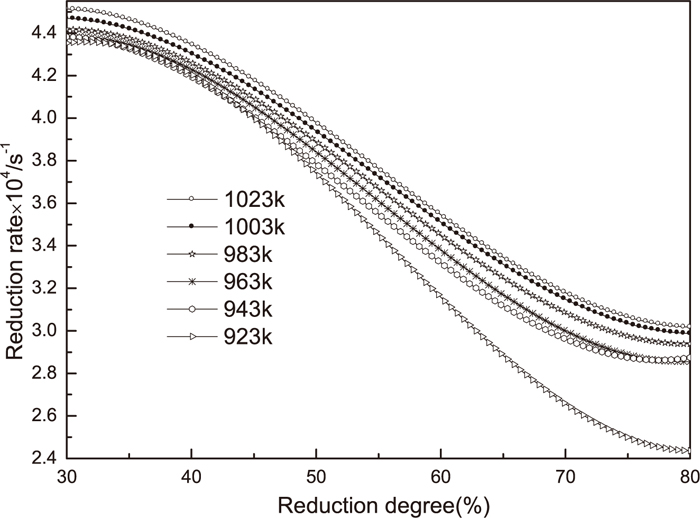
Relationship between the reduction rate and reduction degree at different temperature.
The reciprocal of 923 K, 943 K, 963 K, 983 K, 1003 K, 1023 K are 1.08×10⁻³ K−1, 1.06×10⁻³ K−1, 1.04×10⁻³ K−1, 1.02×10⁻³ K−1, 1.00×10⁻³ K−1, 0.98×10⁻³ K−1, and take these numbers as x axis. Reaction rate

Fitting curve between the reaction rate and the reciprocal of temperature at the same reduction degree.
The primary and secondary factors affecting the metallization rate during fluidized reduction are coating oxide, temperature, linear velocity, particle size, hydrogen content of the gas mixture. Meanwhile, the primary and secondary factors affecting the sticking of fine iron ore during fluidized reduction are coating oxide, temperature, particle size, hydrogen content of the gas mixture, linear velocity.
The optimal operating parameters require to reduce ORD-S fine iron ore are 923 K to 1023 K temperatures, particle size range of 0.63 mm to 1.0 mm, linear velocity of 0.6 m/s, hydrogen accounting for 80 vol.% of the total carbon monoxide and hydrogen mixture, and coating MgO accounting for 2 mass% of the total quality of fine iron ore.
Under the optimal experimental conditions for sticking mechanism analysis, the particles are found in a fluidized state by three main aspects of the joint action force, namely, gas drag force on the particles, sticking force between the particles, and gravity. When the joint action force is greater than zero, fine iron ore is in the fluidized state; when the joint action force is equal to zero , fine iron ore is in the critical sticking state; and when the joint action force is less than zero , fine iron ore is in the sticking flow state. Sticking loss of flow of the solid bridge critical radius is 90–105 nm. When the temperature is lower than the Taman temperature and the radius of the particle in contact with the instantaneous formation of the solid bridge (X) is less than the critical radius of solid bridge (Xm), the sticking force between particles is not enough to cause sticking loss of flow and to convert the fine iron ore to the fluidized state. When the temperature is higher than the Taman temperature and the radius of the particle in contact with the instantaneous formation of the solid bridge (X) is greater than the critical radius of solid bridge (Xm), the sticking force between particles is large enough to cause sticking loss of flow in fine iron ore.
Under the optimal experimental conditions, the average apparent activation energy E of the chemical reaction is 22.48 kJ/mol, and the limit link of chemical reaction speed is the internal diffusion speed.