Regular Article
Development of Recrystallization Texture in Severely Cold-rolled Pure Iron
2016 Volume 56 Issue 4 Pages 693-699
Details
2016 Volume 56 Issue 4 Pages 693-699
The mechanism of recrystallization texture development is changed by the chemical composition of materials, cold-rolling reduction, and annealing conditions. This study discusses the development of recrystallization texture for severely cold-rolled pure iron. In cold-rolled iron with 99.8% reduction, the deformation texture was a strong α-fiber (RD//<011>) with high strain. During annealing in a temperature range from 20°C to 800°C, in this highly strained α-fiber, the microstructure started to recover from a low temperature. Thereafter, recrystallized grains began to appear at 350°C, and many recrystallized grains were generated at random locations. Their textural components were {100}, {211}, {111}, and {411}, which were already included in the α-fiber. At 550°C, recrystallization was completed, and the resulting recrystallization texture was similar to the original cold-rolling texture. This texture was developed by unique microstructural changes, which could be classified as continuous recrystallization. During grain growth stage, the recrystallization texture changed into the {100}<012> component presumably by the selective growth of recrystallized grains governed by the size effect.
Controlling texture is essential to improve the deep-drawability and the magnetic property of steel sheets, thus texture control has been extensively studied. Specifically, recrystallization texture can be controlled by adjusting rolling and annealing conditions.
There are two major schools of thought regarding the formation of recrystallization texture: the oriented nucleation theory and the selective growth theory. Furthermore, the mechanism for the formation of recrystallization texture varies by the chemical composition of materials, cold rolling reduction, and annealing conditions.
Abe et al. have detailed the oriented nucleation theory of steel sheets with high drawability. They revealed that {111} recrystallization texture developed by reducing the grain size of pure iron prior to cold-rolling. Furthermore, they investigated the recrystallization behavior, which was cold-rolled by 50% reduction, and reported that recrystallized grains in the early stage of recrystallization were formed by the subgrain growth at near grain boundaries where the deformed structure was non-uniform. Moreover, the recrystallized grains had the same orientation as that of the texture changes took place by selective growth during recrystallization of a Ti-bearing interstitial free (IF) steel.2) The recrystallization texture of IF steels were formed by selective growth in which {111} recrystallized grains grew into deformed matrices with the α-fiber (RD//<011>) texture, where RD stands for rolling direction.
The recrystallization behavior after heavy cold-rolling reduction has also been reported. Similar to Abe et al., Gobernado et al. showed that the recrystallization texture of Fe-3.2%Si ferritic steel, which was cold-rolled by 95% reduction, was formed by oriented nucleation. The recrystallized grains, which preferentially had the {311}<136> component, nucleated in the heterogeneously deformed grains with the same orientation. On the other hand, Verbeken et al., using ultra low carbon steel cold-rolled by 95%, reported that the recrystallized grains with {554}<225> and {113}<471> components selectively grew into deformed grains with the {112}<110>4) component, which corresponds to the selective growth theory. These studies have demonstrated that the mechanism for the formation of recrystallization texture may be changed by various factors. Therefore, the purpose of this study was to clarify the mechanism for the formation of recrystallization texture in severely cold-rolled pure iron with 99.8% reduction.
An ingot of pure iron was made by the vacuum smelt furnace, and the chemical composition of the ingot is shown in Table 1. The ingot was annealed at 1200°C for 2 h in an Ar gas atmosphere, and forged into a rectangle with dimensions of 250 mm × 250 mm × 300 mm. The forged sample was annealed at 1200°C for 2 h, and then hot-rolled by 80% with 15 passes, after which the sample was 50 mm thick. Two samples were prepared to clarify the effect of cold-rolling reduction on recrystallization behavior. Both samples were cut from the above hot rolled sample. The first sample intended for severe cold rolling, was cold rolled from 50 mm to 0.1 mm, with a reduction of 99.8%. The second sample intended for normal cold rolling, was first sliced to 1 mm thickness. Then, the sample was cold rolled from 1 mm to 0.1 mm, with a reduction of 90%. Thus, two cold rolled samples 0.1 mm thick were prepared with reduction of 99.8% and 90% respectively.
| C | P | S | Mn | N | O | Fe |
|---|---|---|---|---|---|---|
| <10 | <20 | <3 | <30 | 6 | 215 | Bal. |
Squares of 25 mm were cut from the samples and annealed at a temperature range of 200–800°C in vacuum atmosphere (−10−2 Pa). The rate of heating was 10°C/min, and after annealing, the samples were quenched by means of Ar gas to room temperature. Observation of the microstructures of the cold-rolled samples and the annealed samples were performed by an optical microscope (OM), a scanning electron microscope-electron back scatter diffraction pattern (SEM-EBSD) and a transmission electron microscope (TEM). All the samples were observed on the transverse section. The samples observed by the OM were etched with nital. The samples observed by the SEM-EBSD were polished with colloidal silica. On the polished samples, OIM® scans with a step size of 0.1 μm were performed. The samples observed by the TEM were electro-polished.
Texture analysis was performed by X-ray diffraction (XRD) using a Mo target, in which {200}, {110} and {112} pole figures were measured and a series expansion technique was employed to calculate the ODF’s. In this study, φ2= 45° sections of Bunge’s Euler space were used to display the texture. Simultaneously, micro Vickers hardness test was carried out on the annealed samples to investigate the change in hardness with annealing temperature. The average value of micro Vickers hardness at eight measuring points was obtained, where load applied was 10 g and holding time was 15 s.
The cold-rolling textures of 90% and 99.8% reductions are given in the ODF’s in Fig. 1. The cold-rolling texture of 90% reduction showed α-fiber (RD//<011>) and γ-fiber (ND//<111>) texture, and the primary orientation was {211}<011>. In the γ-fiber texture, {111}<123> component is stronger than the other orientation components. Conversely, the cold-rolling texture of 99.8% reduction shown in Fig. 1(b) was a strong α-fiber. The main orientation was {100}<011> to {113}<011> components. Weak orientations appeared at {554}<225> and {111}<123>.

φ2 = 45° ODF sections showing cold-rolling textures for (a) 90% and (b) 99.8% reductions.
The deformed microstructures of 90% and 99.8% reductions are shown in EBSD inverse pole figure orientation map in Fig. 2. In the 90% cold-rolled sample, the deformed microstructure had a lamella structure, with a width of 5–10 μm. The upper region was the α-fiber, and the lower region was the γ-fiber, as shown in Fig. 2(a). Misorientation of the α-fiber grains is small, whereas that of the γ-fiber grains is large. In the 99.8% cold-rolled sample, the deformed microstructure consisted of a very fine lamella structure, with a width of 0.5 to 3 μm. As shown in Fig. 2(b), it mainly consisted of α-fiber. In the α-fiber, some regions had a large misorientation, indicated by arrows.

EBSD ND-orientation maps of the cold-rolled samples observed from the TD for (a) 90% and (b) 99.8% reductions.
Figure 3 shows the TEM micrographs observed in the 90% and 99.8% cold-rolled samples. In former, the lamella structure showed a large number of dislocation cells. In latter, sharp and fine lamella structures with elongated dislocation cells were observed, with the lamella width ranging from 0.02 to 0.2 μm. In stark contrast to the 90% cold-rolled sample, few dislocations were observed in some cells.

TEM micrographs of α-fiber structures observed from the TD in cold-rolled samples for (a) 90% and (b) 99.8% reductions.
Stored energies for cold-rolled samples were evaluated using the XRD peak width at half height considering the anisotropy of Young’s modulus, following Takechi et al.5) Figure 4 shows the orientation dependence of stored energies for both the samples. The orientations selected were {100}, {411} and {211} belonging to the α-fiber, and {111} belonging to the γ-fiber. In the 90% cold-rolled sample, the stored energies were of the order: {111}>{211}>{100}>{411}. In the 99.8% cold-rolled sample, the stored energies were given of the order: {100}>{211}>{411}>{111}. Although it has been reported that the {100} orientation is generally difficult to store strain energy,6) the stored energy of the {100} orientation after 99.8% is higher than that of the {111} orientation. With increasing cold-rolling reduction, the stored energies of {100}, {411} and {211} orientations became significantly large.

Stored energy in severely cold-rolled sample, calculated by changing the full width at half maximum resolved XRD peak.
The change in Vickers hardness with heating temperature was investigated for the 90% and 99.8% cold-rolled samples. As shown in Fig. 5(a), the microstructure of the 90% cold-rolled sample had both a dark and bright contrast area. The area for hardness measurement was the same area for microstructure observation as shown in Fig. 2(a). The dark contrast area, considering the result shown in Fig. 2(a), is regarded as the γ-fiber and similarly, the bright contrast area is considered the α-fiber. Figure 5(b) shows the change in Vickers hardness of each fiber textured microstructure against heating temperature. The hardness of the γ-fiber in the cold-rolled state was 230 HV, and this hardness value remained up till 400°C. When the heating temperature increased over 400°C, the hardness decreased. On the other hand, the hardness of the α-fiber remained 140 HV until 500°C. When the heating temperature increased over 500°C, the hardness decreased. Recrystallization completed at 550°C, in both areas, and the hardness was 80 HV.

(a) Optical micrograph of the cross section of cold-rolled sample with 90% reduction after measuring Vickers hardness, and (b) change in Vickers hardness as a function of annealing temperature for the same materials shown in (a).
On the other hand, the microstructure of the sample cold-rolled by 99.8% reduction had a very fine structure, as shown in Fig. 6(a). The change in Vickers hardness for this sample is plotted against heating temperature, as shown in Fig. 6(b). The hardness in the cold-rolled state was 260 HV, which is as high as that of the γ-fiber of the 90% cold-rolled sample. The hardness did not change up till 300°C. However, when the heating temperature increased over 300°C, the hardness started decreasing and remained constant at 500°C.

(a) Optical micrograph of the cross section of cold-rolled sample with 99.8% reduction after measuring Vickers hardness, and (b) change in Vickers hardness as a function of annealing temperature for the same material shown in (a).
Figure 7 shows the recrystallization behavior of the 90% cold-rolled sample investigated from the transverse direction (TD) by the SEM-EBSD. At 400°C, no recrystallized grains appeared. At 450°C, several {111} oriented recrystallized grains formed along the deformed γ-fiber lamella structures. At 500°C, recrystallization completed in the γ-fiber region and {111} oriented recrystallized grains grew into the deformed α-fiber region, indicated by an arrow in Fig. 7. At 600°C, recrystallization completed, resulting in mostly {111} recrystallized grains of 20–80 μm.

Change in EBSD ND-orientation maps observed from the TD as a function of annealing temperature for the 90% cold-rolled sample.
Figure 8 shows the recrystallization behavior of the 99.8% cold-rolled sample investigated by the SEM-EBSD. At 400°C, a few recrystallized grains already appeared, with various orientations. Note that nucleation of recrystallized grains macroscopically took place at random locations and was not limited to the γ-fiber region, as in the case of the 90% cold-rolled sample. As such, the recrystallization mechanism for the 99.8% cold-rolled sample is completely different from that of the 90% cold-rolled sample. At 450°C, more recrystallized grains with mostly near {100} orientation formed. At 500°C, recrystallization completed resulting in near {100} recrystallized grains of 10–20 μm. When the heating temperature increased to 600°C, the recrystallized grains grew to 20–50 μm. Detailed investigation into the mechanism of recrystallization of 99.8% cold-rolled materials was carried out by EBSD. Figure 9 reveals the result of EBSD observation of the sample cold rolled by 99.8% followed by heating to 400°C. Some {100} oriented grains were evidently observed to be growing into neighboring grains with bulging mechanism, indicated by arrows.

Change in EBSD ND-orientation maps observed from the TD as a function of annealing temperature for the 99.8% cold-rolled sample.

Magnified EBSD ND-orientation map observed from the TD showing bulging grains for the 99.8% cold-rolled sample, followed by annealing at 400°C.
The number of recrystallized grains with various orientations was regarded as a function of grain size for the 90% and 99.8% cold-rolled samples followed by heating to 450°C. A fraction of the recrystallized area was 20%–30% independent of the cold rolling reduction. The observed area was 100 μm×300 μm. As shown in Fig. 10, many {111} oriented recrystallized grains were observed in the 90% cold-rolled sample. Furthermore, almost all the grains, whose size exceeded 15 μm, had {111} orientation. On the other hand, when cold rolled by 99.8%, recrystallized grains with various orientations of {100}, {411}, {211}, and {111} were formed, as shown in Fig. 11. Moreover, the size distribution of the recrystallized grain of the 99.8% cold-rolled sample is narrow as compared with that for the 90% cold-rolled sample. In other words, in the 90% cold-rolled sample, {111} oriented recrystallized grains were abundant, whereas in the 99.8% cold-rolled sample, no grains with a particular orientation appeared. The size of the recrystallized grains was 5–15 μm in diameter in this case.

Number of recrystallized grains with various orientations as a function of grain size for the 90% cold-rolled sample heated to 450°C.
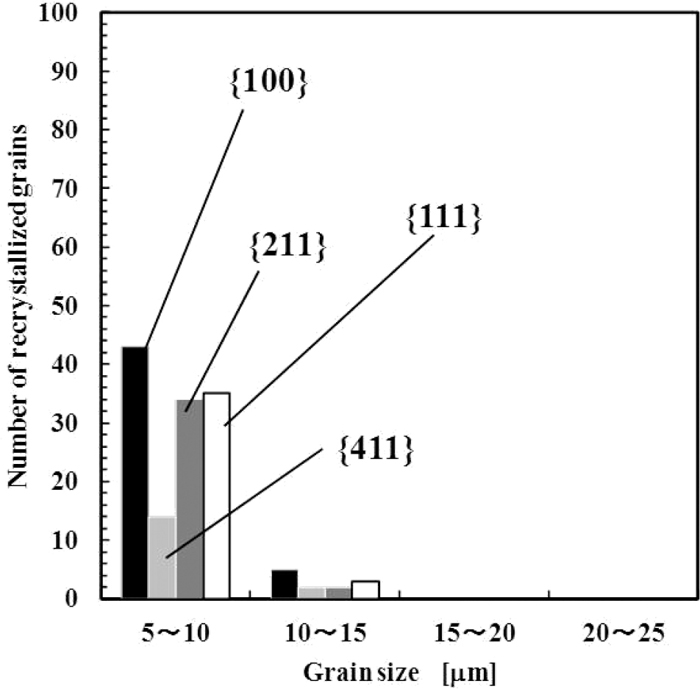
Number of recrystallized grains with various orientations as a function of grain size for the 99.8% cold-rolled sample heated to 450°C.
Figure 12 shows ODFs of the 90% cold-rolled sample in various stages, namely, (a) as cold rolled, (b) in the early stage of recrystallization heated to 430°C, (c) in the completion of recrystallization heated to 600°C, and (d) after grain growth heated to 800°C. As mentioned above, the cold-rolling texture consisted of the α-fiber and γ-fiber. In the α-fiber texture, the main component was {211}<011>. In the γ-fiber texture, the intensity of the {111}<123> component was higher than that of the other components. At 430°C, the main orientation changed a lightly from {211}<011> to {311}<011>. In the γ-fiber texture, the intensity of the {111}<112> component seemed to increase. At 600°C, the intensity of the α-fiber texture, except for {111}<011>, dramatically decreased, whereas that of the γ-fiber texture, in particular, the {111}<011> component, strengthened. At 800°C, the main component became {111}<011>, whereas the intensity of the {111}<112> component remarkably decreased.

φ2 = 45° ODF sections showing the (a) cold-rolling texture with 90% reduction, and textures followed by heating up to (b) 430°C, (c) 600°C, and (d) 800°C.
Figure 13 shows ODFs of the 99.8% cold-rolled samples in various stages in the same manner as shown in Fig. 12. The cold-rolling texture consisted of a strong α-fiber texture, and the main component spread from {100}<011> to {311}<011> with the minor components such as {554}<225> and {111}<123>. The texture of this sample remained almost the same until 600°C, where grain growth occurred following the completion of recrystallization at 500°C. When heated to 800°C, along with significant grain growth, the texture remarkably changed and the main component became {100}<012> with the minor component of {554}<225> at a remarkable expense of the α-fiber texture.

φ2 = 45° ODF sections showing the (a) cold-rolling texture with 99.8% reduction, and textures followed by heating up to (b) 430°C, (c) 600°C, and (d) 800°C.
In order to clarify the recrystallization mechanism, samples with two different cold-rolling reductions were investigated. The texture of the 90% cold-rolled sample comprised α-fiber and γ-fiber textures (Fig. 1), which are closely related to the deformed structure containing both α-fiber and γ-fiber regions (Fig. 2). The α-fiber region had a small misorientation, whereas the γ-fiber region had a large misorientation, as shown in Fig. 2. Moreover, the γ-fiber region had a much higher hardness than the α-fiber region. This suggests that the stored energy introduced by cold rolling was more concentrated in the γ-fiber region than in the α-fiber region. In addition, the stored energy with the {111} orientated region was the highest, as shown in Fig. 4. These results suggest that the γ-fiber region is expected to first recrystallize according to the high energy block theory.
As shown in Fig. 5, the hardness in the γ-fiber region of the 90% cold-rolled sample started to first decrease at a lower temperature, which suggests that the γ-fiber region recovers more quickly. Similarly, Yuasa et al. investigated the recrystallization behavior of 80% cold-rolled pure iron and reported that the formation of nuclei in the early stage of recrystallization can be explained by the process of subgrain coalescence.7)
During recrystallization of the 90% cold-rolled sample, a large number of recrystallized grains appeared along the γ-fiber region at 450°C, whereas the α-fiber region remained unrecrystallized. Thus, recrystallization in the 90% cold-rolled sample occurred selectively in the γ-fiber region.
The orientation of the recrystallized grains that appeared in the early stage of recrystallization had preferentially ND//<111> orientation (ND denotes normal direction), as shown in Fig. 10. Specifically, almost all the recrystallized grains exceeding 15 μm in diameter were oriented to ND//<111>. These results imply that {111} recrystallized grains tend to nucleate preferentially in the deformed γ-fiber region.
Consequently, it is inferred that although the 90% cold-rolled structure comprises both low energy α-fiber region and high energy γ-fiber region, recovery starts from the highly strained γ-fiber region, leading to the preferential nucleation of recrystallized grains through subgrain coalescence or subgrain growth. Since to be ND//<111>, which is equal to the orientation of the deformed γ-fiber. Furthermore, {111} nuclei are postulated to grow at an expense of the non-recrystallized α-fiber region in the later stage of recrystallization.
After increasing the heating temperature from 600°C to 800°C, among ND//<111> oriented grains, the {111}<011> component increased, whereas the {111}<112> component significantly decreased. The above mentioned texture change occurred during grain growth by the selective growth presumably due to the size effect.8)
The texture of the 99.8% cold-rolled sample consisted of a strong α-fiber texture, as shown in Fig. 1. The deformed structure had a characteristic fine (0.1–0.5 μm thick) α-fiber lamella structure with a large misorientation (Figs. 2 and 3). These results suggest that recrystallized grains would be able to nucleate from the α-fiber region in the 99.8% cold-rolled sample. Quadir et al. reported that the recrystallization from {100}<011> was possible by cold rolling with high reduction,9) because the misorientation in {100}<011> grains increased due to the high cold rolling reduction.
The stored energy of the {100} component was the highest in the 99.8% cold-rolled sample, as shown in Fig. 4. Moreover, Fig. 6 demonstrated that the Vickers hardness, presumably contributed mostly by the fine α-fiber lamella, was as high as 260 HV. These results imply that the α-fiber of the 99.8% cold-rolled sample can be highly strained. Consequently, the Vickers hardness is expected to decrease at a very low temperature, in accordance with the experimental data shown in Fig. 6 that recovery already started when heating the sample to 300°C. Thus, recovery of the α-fiber region is expected to form subgrains, leading to nucleation of the recrystallized grain. These phenomena are not limited to the α-fiber region. Therefore, it is supposed that the recrystallized grains can nucleate from not only the α-fiber region but also the region with other orientations. As shown in Fig. 8, the recrystallized grains seemed to appear at random locations in deformed structures. Since most of the deformation texture was α-fiber, the probability of recrystallized grains appearing in the α-fiber region is high. In addition, the recrystallized grains, which appeared in the early stage of recrystallization, showed various orientations such as {100}, {411}, {211} and {111}, as shown in Fig. 11. Since these orientations belong to the α-fiber texture, it is suggested that the recrystallized grains appeared in the α-fiber texture.
Figure 13 shows that the texture of the 99.8% cold-rolled sample consisted of a strong α-fiber texture, and this deformation texture remained even after recrystallization completed. This could be considered continuous recrystallization in that the texture did not change during recrystallization.
Consequently, it is suggested that the α-fiber region, which is generally thought to be difficult to recrystallize, may store high strain energy when subjected to severe cold rolling with extremely high reduction, leading to a large amount of nucleation sites in the α-fiber region. Therefore, recovery is expected to occur from a very low temperature, resulting in the formation of subgrains and nucleation of recrystallized grains. The orientations of recrystallized grains were {100}, {411}, {211}, and {111}, which have a high stored energy and belong to the α-fiber texture. Furthermore, the α-fiber texture remained until recrystallization completed. These recrystallized grains grew very slowly, as shown in Fig. 8, which suggests a strong impingement due to the abundant number of nuclei. The bulging mechanism demonstrated by Fig. 9 and the strong impingement are inferred to be the recrystallization process governing the present case, where no texture change occurs until the completion of recrystallization.
While the sample was heated from 600°C to 800°C, the texture drastically changed to {100}<012>, as shown in Figs. 13(c) and 13(d). In this stage, a significant grain growth occurred, so that the texture change took place with the selective growth mechanism, presumably governed by the size effect.8) Details of this mechanism are a topic of future work.
The recrystallization behavior and texture evolution of severely cold-rolled pure iron was investigated in detail and the following conclusions were drawn. In the 99.8% cold-rolled sample, the cold-rolling texture consisted of a strong α-fiber texture, and the deformed structure was highly strained with very fine lamella structure. In this highly strained α-fiber region, recovery started at a very low temperature (300°C), and the recrystallized grains with {100}, {411}, {211}, and {111} orientations appeared at random locations. The recrystallization texture was the same as the α-fiber cold-rolling texture. As such, recrystallization texture is dependent on unique microstructural changes, which could be classified as continuous recrystallization. During grain growth after the completion of recrystallization, the {100}<012> component remarkably developed presumably by the selective growth governed by size effect.