Abstract
In this study, in order to investigate the absorbed energy distribution on the low-temperature impact fracture process of ductile Ni-resist alloyed iron, the low-temperature impact tests of ductile Ni-resist austenitic alloyed iron (the main composition of 23.0 wt.% Ni and 4.0 wt.% Mn) were completed from room temperature to −193°C. Through the analysis of specific energy and load, the result shows that the impact crack initial energy Ei and unstable propagation energy Eup of ductile Ni-resist alloyed iron respectively present opposite trend with the decreasing of temperature, but their total energy Eadd is relatively stable. The metastable propagation strength energy Est under high load in the impact fracture process is the main decisive factor on the low-temperature impact property of ductile Ni-resist alloyed iron, and it is determined by the increasing of average energy valley load Fave and the decreasing of metastable propagation deflection dst under high load respectively at the front and back of the extreme point (−80°C).
1. Introduction
Generally, the equilibrium solidification microstructure of ductile cast iron is α-Fe and Fe3C at room temperature. Alloying element addition such as Ni and Mn can reduce the eutectoid transformation temperature and get stable austenite (γ-Fe) below room temperature.1,2) Ductile Ni-resist (DNR) alloyed iron as an austenitic matrix has no low-temperature ductile-brittle transition phenomenon and even retains good impact property under liquid nitrogen temperature.3) Due to its stable low-temperature property and excellent castability, DNR alloyed iron (S–Ni Mn 23 4) has been widely used for manufacturing low-temperature complex castings.4) However, the impact property of S–Ni Mn 23 4 DNR alloyed iron at low temperature will firstly rise and then fall down, and the extreme point is between −80°C and −100°C. A large number of fracture analysis also indicated that it is still ductile fracture morphology no matter before or after the extreme point.
The phenomenon of which can’t be clearly explained by relevant research on low-temperature fracture of DNR alloyed iron. Charpy V-notch impact tests are widely used to study low-temperature fracture properties of ductile irons.5,6) Based on the specific analysis method of dynamic load under different deflections, the absorbed energy in the initiation and propagation of impact crack can be clearly presented.7) Therefore, this study explored the absorbed energy distribution of ductile Ni-resist alloyed iron under instrumented impact load at low temperatures and attempted to find the main decisive factor of low-temperature impact property.
2. Experimental Procedure
In this study, 25 mm-thickness Y-block casting of DNR alloyed irons was produced following ISO 2892:2007.8) The carbon silicon analyzer (TRUSCO CSA-2000) was used in the smelting process. The low silicon pig iron, steel scrap, pure nickel and 75MnFe were melted by the medium-frequency furnace. The nodulizer (NiMg26) and inoculant (75SiFe) contents of 1.0 and 0.4 wt.% were respectively added into casting ladle using “Sandwich Technique”, and the spheroidizing was completed at 1550±20°C.
V-notched bar impact test were carried out on a Pendulum impact tester (MTS ZCJ1000) following ISO 148-1:2009.9) The test temperatures are respectively at room temperature, (−20°C), (−60°C), (−100°C), (−140°C) and (−193°C), and after that, (−80°C)’s test was added in order to explore the extreme point. Three tests were done from each specimen’s condition and average values were counted out. The data that the most close to average value were selected finally. A laser confocal microscope (Olympus OLS4100) was used to reconstruct the impact fracture topography and the surface roughness was measured following ISO 4287:2010.10)
3. Results and Discussions
Figure 1 shows the effect of testing temperature on impact value of DNR alloyed iron (S–Ni Mn 23 4) in this study, and the impact values present the extreme point at −80°C.In order to explain this phenomenon, T. Kobayashi’s method (compliance changing rate) is used to analyze the Load-Deflection fitting curve in this study.11) The yield load Fgy, initial load Fi, critical load Fc and unstable propagation load Fup are confirmed (the critical load Fc is the biggest valley point in Slope- Deflection curve). The Dynamic load-Deflection curve is divided into five energy regions by characteristic points as shown in Fig. 2, which are elastic deflection energy (Ee), elastic-plastic deflection energy (Ed), metastable propagation energy under high load (Emp1), metastable propagation energy under low load (Emp2) and unstable propagation energy (Eup), and follow the relationship:
|
E
t
(impact value)=
E
i
+
E
p
,
E
i
=
E
e
+
E
d
,
E
p
=
E
mp
+
E
up
(
E
mp
=
E
mp1
+
E
mp2
).
|
Figures 3(a), 3(b) are the Dynamic load-Deflection curve of DNR alloyed iron(S–Ni Mn 23 4). It presents several similar dynamic load peaks before extreme point (−80°C) in Fig. 3(a). But in Fig. 3(b), the biggest dynamic load peak rise up with the decreasing of temperature and the peak number under high load also obviously decrease. It reveals that the low-temperature impact fracture process changed at this time.
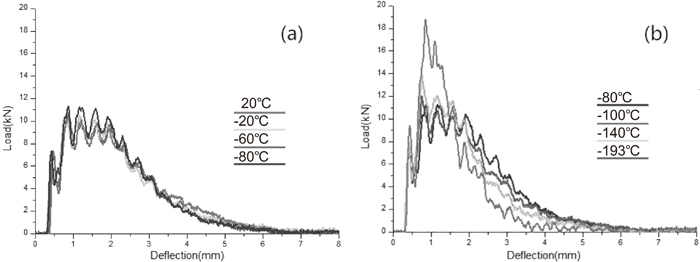
Due to the existence of spheroidal graphite as the second phase, ductile cast iron presents the non-steady type ductile fracture mechanism.12) When dynamic load rises up to the initial load Fi, impact crack begins to initiate and propagate. And the work hardening phenomenon continuously occurs in the front of crack jut until accumulated energy reaches a certain extent. Meanwhile, the release of accumulated energy leads to fast propagation of impact crack, and the new accumulation starts again.13,14) Therefore, the dynamic load will fluctuate, and it presents several dynamic load peaks in Fig. 3.
The data of characteristic points corresponding to Fig. 3 is listed in Table 1. It shows that Ei presents a stable increasing trend with the decreasing of temperature, and Eup has an opposite trend. However, both Ei and Eup are quite low, and total energy Eadd is relatively stable. Therefore, the effect of Ei and Eup on impact value (Et) is quite limited, but Emp is the main decisive factor. Additionally, when dynamic load peak presents before the critical load (Fc), the valley value of peaks can reach to higher level, therefore, Emp1 under high load plays a more important role on impact crack metastable propagation.
Table 1. Data of characteristic points corresponding to Dynamic load-Deflection curve
| T/°C | Fgy/dgy
(kN/mm) | Fi / di / Ei
(kN/mm/J) | Fc / dc / Emp
(kN/mm/J) | Fup / dup / Eup (kN/mm/J) | Eadd
(J) | Et
(J) |
|---|
| RT | 2.86/0.43 | 5.32/0.62/1.41 | 7.21/2.45/23.40 | 1.24/4.67/2.67 | 4.08 | 27.48 |
| −20 | 3.03/0.41 | 5.61/0.60/1.45 | 7.19/2.43/24.17 | 1.31/4.74/2.72 | 4.17 | 28.34 |
| −60 | 3.01/0.47 | 5.74/0.67/1.52 | 7.33/2.49/25.05 | 1.49/4.71/2.66 | 4.18 | 29.23 |
| −80 | 3.26/0.43 | 6.10/0.64/1.67 | 7.42/2.41/25.76 | 1.32/4.43/2.58 | 4.25 | 30.01 |
| −100 | 3.53/0.43 | 6.80/0.65/1.79 | 7.61/2.19/24.57 | 1.27/4.37/2.43 | 4.22 | 28.79 |
| −140 | 4.03/0.44 | 7.56/0.65/2.04 | 9.83/1.87/23.27 | 1.01/4.05/2.21 | 4.25 | 27.52 |
| −193 | 5.46/0.50 | 9.39/0.68/2.34 | 11.83/1.50/21.09 | 0.56/3.71/1.94 | 4.28 | 25.37 |
Figure 4 is the absorbed energy distribution of metastable propagation under high load in Dynamic load-Deflection curve at −80°C. It shows that the resistance of impact crack propagation is mainly derived from Est, Epeak and Emp2. Est is the average strength energy of valley load, and Epeak is the peak energy under high load. Regarding initial load Fi as the first peak and the valley loads of every peak value (P1, P2 …… Pn) as F1, F2 …… Fn-1, then the average valley load (Fave) between the initial deflection (di) and the critical deflection (dc) meets the following relationship:
|
F
ave
=(
F
i
+
F
1
+
F
2
+……+
F
n-1
)/n,
E
st
=
F
ave
d
st
(
d
st
=
d
c
-
d
i
),
E
peak
=
E
mp1
-
E
st
.
|
The absorbed energy distributions in the metastable propagation process of DNR alloyed iron (S–Ni Mn 23 4) at different temperatures are showed in Fig. 5. The Epeak has the lowest energy ratio at all temperatures, and Est and Emp2 have higher ratio relatively. With the decreasing of temperature, Epeak and Emp2 have no significant changes, but Est presents the same trend to Emp1 and Et. So Est is the key factor on impact crack metastable propagation under high load.

However, the effect factors of Est before and after the extreme point (−80°C) is different. Arrhenius formula gives the dependence of the rate constant k of a chemical reaction on the absolute temperature T (in kelvins), where A is the pre-exponential factor, Ea is the activation energy, and R is the universal gas constant: k=Ae-Ea/(RT). The decreasing of temperature will lead to lower atomic diffusion energy, so that increase the resistance of dislocation motion. Therefore, the metal strength can be improved generally.15) This is the reason why Fave has a continuous increasing trend at low temperature, which shows in Fig. 6(a). But the continuous increasing of load will lead to excessive local stress concentration, so that the matrix appears fracture tendency, which leads to the narrowing of metastable propagation deflection (dst) under high load in Fig. 6(b). In conclusion, Est in the metastable propagation of impact crack under high load is determined by the increasing of Fave and the decreasing of dst respectively before and after the extreme point (−80°C).16)

In order to verify above conclusion, 3D-fracture morphology at different temperature is rebuilt by laser scanning confocal microscope (LSCM), and use the surface roughness index Sa=∫∫a|Z(x,y)|dxdy to approximatively characterize the plastic deformation.17) Figures 7(a) and 7(b) are 3D-fracture morphology of DNR alloyed iron under LEXT at −80°C and −193°C, and the dimensions of dup are marked using the double-headed arrow. It can be clearly observed that the difference of plastic deformation zone. At −80°C, the morphology height in plastic deformation zone mainly concentrated in the range of 800 μm to 1200 μm, but it becomes in the range of 900 μm to 2200 μm at −193°C. As opposed to the shrink of the plastic deformation zone, it indirectly explains the continuous increasing of load will lead to excessive local stress concentration below −80°C.

Meanwhile, the surface roughness index of metastable propagation zone under high load Sa (dst) and the measured area form d0.68 to d1.50 (the same to −193°C) Sa (0.68 to 1.50) on the impact fracture surface are measured and showed in Fig. 8. With the decreasing of temperature, the Sa (dst) curve presents the same trend with Est in Fig. 5, and it verifies that there is great relevancy between the surface roughness index in dst zone and Est. But the Sa (0.68 to 1.50) presents a continuous increasing tread, which is because the continuous increasing of Fave lead to higher plastic deformation. Due to less change of dst above −80°C, the difference between Sa (dst) and Sa (0.68 to 1.50 is relatively stable. But below −80°C, the decreasing of dst directly lead to the decline of Sa (dst). It further explains that the decreasing of dst became the key factor at this time.
4. Conclusions
(1) The impact crack initial energy Ei and unstable propagation energy Eup of ductile Ni-resist alloyed iron respectively present the opposite trend with the decreasing of temperature, but total energy Eadd is relatively stable.
(2) The metastable propagation strength energy Est under high load in the impact fracture process is the main decisive factor on the low-temperature impact property of ductile Ni-resist alloyed iron.
(3) The Est under high load in the impact fracture process is determined by the increasing of average energy valley load Fave and the decreasing of metastable propagation deflection dst under high load respectively at the front and back of the extreme point (−80°C).
Acknowledgement
This study was supported by the National Natural Science Foundation of China (No. 51274142), the Natural Science Foundation of Liaoning Province (No. 2014028015), and the Science & Technology Project of Shenyang City (No. F15-199-1-15).
References
- 1) N. Fatahalla, A. AbuElEzz and M. Semeida: Mater. Sci. Eng. A, 504 (2009), 81.
- 2) J. Lacaze, A. Boudot and V. Gerval: Metall. Mater. Trans. A, 28 (1996), 1997.
- 3) M. M. Rashidi and M. H. Idris: Mater. Sci. Eng. A, 574 (2013), 226.
- 4) A. Tabor, P. Putyra, K. Zarebski and T. Maguda: Arch. Foundry Eng., 9 (2009), 163.
- 5) S. Takaki, T. Furuya and Y. Tokunaga: ISIJ Int., 30 (1990), 632.
- 6) T. Fukunaga, K. Kaneko, R. Kawano, K. Ueda, K. Yamada, N. Nakada, M. Kikuchi, J. S. Barnard and P. A. Midgley: ISIJ Int., 54 (2014), 148.
- 7) T. Kobayashi and S. Yamada: Metall. Mater. Trans. A, 25 (1994), 2427.
- 8) ISO 2892:2007, Austenitic cast irons-Classification, International Organization for Standardization, Switzerland.
- 9) ISO 148-1:2009, EN Metallic Materials-Charpy Pendulum Impact Test-Part1, International Organization for Standardization, Switzerland.
- 10) DIN EN ISO 4287:2010, Geometrical Product Specifications (GPS)-Surface texture: Profile method-Terms, definitions and surface texture parameters, International Organization for Standardization, Switzerland.
- 11) T. Kobayashi, I. Yamanoto and M. Ninomi: J. Test Eval., 21 (1993), 145.
- 12) Z. R. He, G. X. Lin and S. Ji: Mater. Charact., 38 (1997), 251.
- 13) Z. R. He, G. X. Lin and S. Ji: Mater. Sci. Eng. A, 234 (1994), 161.
- 14) V. M. Bermont, R. N. Castillo and J. A. Sikora: ISIJ Int., 42 (2002), 1303.
- 15) K. J. Laidler: The World of Physical Chemistry, Oxford University Press, Oxford, (1993), 1.
- 16) E. Hug, C. Keller, J. Favergeom and K. Dawi: Mater. Sci. Eng. A, 518 (2009), 65.
- 17) P. Zhu and B. S. Chen: Acta. Metall. Sin. (China), 34 (1998), 63.


