Abstract
Burden distribution plays a key role in controlling the gas flow conditions inside a blast furnace. The distribution of ore and coke influences the gas permeability distribution in the lumpy zone and also in the cohesive zone, where the gas flows mainly through the coke slits. Charging an ore dump on coke can sometimes cause the coke layer to collapse under the force of the heavier ore particles. This is known as ‘coke collapse’ or ‘coke push’, which results in a higher coke fraction near the center of the furnace than expected. In this work coke collapse phenomena are evaluated on model charging programs using small scale experiments and Discrete Element Modeling (DEM). DEM simulations were used to study the extent of collapse for different charging programs, and experiments were undertaken to verify the results of the simulations. The slope stability method was used to classify the collapse conditions into no collapse, impact failure or gravity failure, depending on the stability of the coke layer. The findings were also compared with results from an in-house mathematical model, which was modified to consider the effect of the collapse on the underlying layer. The corrected mathematical model was found to show results in general agreement with results from the DEM simulation.
1. Introduction
Burden distribution is the main factor that affects the gas flow and reduction conditions in the upper part, or “lumpy zone”, of the blast furnace. The burden distribution conditions are controlled by selecting an appropriate charging program, i.e., the material, its mass and the position at which it is charged into the furnace. The charging program is then repeated to create a layered structure of iron bearing and carbon bearing materials inside the furnace. The carbon bearing materials are primarily coke while the iron bearing materials, often collectively referred to as “ore”, are agglomerated iron ore, in the form of pellet or sinter, but also smaller quantities of lump ore is used. The ore and coke have distinct size, shape and gas permeability which influence the flow of the ascending reducing gas that travels through the bed. It is beneficial to increase the rate of auxiliary reductants (typically pulverized coal) injected in the lower parts of the furnace for economic reasons. The decrease in the coke rate has resulted in thinner coke layers. Since coke is the more permeable of the two main burden materials, this change increases the likelihood of operation irregularities like channeling and obstructed gas flow in the thin coke slits in the cohesive zone. It has therefore become increasingly important to gain a deeper understanding of the formation process of burden layers in the blast furnace.
A number of investigations have been published on the evaluation of the burden distribution in the blast furnace, based on both numerical and experimental techniques. These studies focus on different aspects of burden formation like burden trajectory calculation,1,2) layer formation3,4) and burden descent.5,6) When ore is charged on coke, the heavier ore particles may deform and shift the coke layer. This action is termed “coke push” or “coke collapse”. Coke collapse has been observed both in numerical studies1,7) and experimentally.8,9) Various schemes have been suggested to prevent the collapse, for example creating a coke plateau near the wall and controlling the particle trajectory.10,11) Some other schemes have used it to their advantage to achieve a central working furnace.12,13) It is hard to ascertain the effect of the charging a layer on the underlying layers as it is difficult to measure the underlying profile after the new layer has been charged. Some studies have used magnetometer readings14) or image processing techniques8,15) for experimental verification, but these method have their own drawbacks: magnetometer is intrusive disturbing the layer structure and image processing requires a furnace section with a transparent wall, which induces wall effects. Therefore some studies have resorted to sophisticated numerical techniques like Discrete Element Modeling (DEM) for better understanding of the phenomena involved. DEM can provide deeper insight on the charging phenomena, but the computational effort can be excessive because of the large number of particles involved, resulting in prohibitive simulation time.
Some studies have correlated the coke collapse effect to the energy of the particle flow,7,16) but these studies do not consider the shape of burden surface on which the ore is charged. This is a complication as the profile may vary strongly depending on the charging program. Some authors17,18,19) have utilized the stability theory of slopes to determine if a layer would be stable upon charging a pellet layer. This is based on stability theory used extensively in geological applications and dam constructions.20)
In the present study, a scaled experimental setup has been used to model some interesting charging programs and simulated them using an in-house mathematical model21) and DEM. The occurrence and extent of coke collapse has been studied for each of the programs. The mathematical model which did not originally consider the effect of coke collapse was next modified to consider such effects.
The article has been organized as follows: The next section briefly describes the experimental setup. In the subsequent section, “Simulation methodology”, the mathematical model and the DEM setup are described. The section also describes the coke layer stability model that was used to identify the stability of a layer and a scheme is outlined how to modify the layer to reach stability. This is followed by a section with results and corresponding discussion, where the results of the charging experiments and the DEM simulations are compared with the predictions by the mathematical model. Finally, the coke collapse phenomenon is verified experimentally and a brief stability analysis for different charging programs is outlined. The last section concludes the study and provides some guidelines for future work.
2. Experimental Setup
A scaled burden distribution model (1:10 scale), described in detail in previous studies,4,21) was used for evaluating the charging programs. The setup consisted of a holding bin for raw materials, hopper, plunger to control the flow rate, rotating chute and a cone to collect the charge. The cone has a throat diameter of 0.625 m and the base was shaped to mimic the repose angle of iron ore pellet. The particles were scaled to 1:4 of the true size to avoid inter-particle forces or dust formation. The coke particles were in the size range 5–20 mm and the pellets were about 3 mm. The chute angle could be changed in discrete steps of 1 to 11 to allow the material to be charged as rings at different radial positions: 1 represented the chute angle closest to the furnace center and chute position 11 was near the wall. The plunger opening was adjusted to create a complete ring of each “dump”. After charging a layer a profile measurement device was used for detecting the free burden surface.
3. Simulation Methodology
3.1. Mathematical Model and Stability Theory
A simplified two-dimensional axis-symmetric mathematical model described in21) was used to simulate burden layer formation and descent through the blast furnace shaft. The layers were represented by two line segments whose apex coincided with the trajectory of burden falling from the chute. The basic model does not consider the coke collapse but assumes the earlier layers to be stagnant at charging. The model was modified to calculate the stability of a coke layer and to correct the layer structure accordingly.
Coke layer stability theory and burden layer correction: The stability of a slope may be expressed as a ratio between the available shear strength (s) and the shear stress (τ) along a failure plane, referred to as a ‘factor of safety’
Theoretically the slope is unstable if the factor of safety is less than unity. However, studies have experimentally identified the limit to be closer to 0.8.17) The shape of failure plane may vary but in this study it is assumed to be circular (Fig. 1, left), which is a necessary for using the “Ordinary method of slices”20) of factor of safety calculation used in this study. The shear strength is defined in terms of normal stress (σ) on the failure plane. Cohesion between the individual particles is assumed to be absent, because the particles are large enough. Therefore, the above equation may be written as
where
ϕ is the developed friction angle of the material. Like in many limit equilibrium methods
20) of calculating the factor of safety for the slip surface, the region above the failure surface is divided into a finite number of thin vertical slices, each with a base length of Δ
ln and of unit depth.
Figure 1 shows the forces acting on such a slice,
n (right) located at a particular position on the failure surface (left).
Wn is the weight and
Fn is the external force on the slice, and
αn is the angle made by the tangent on the failure surface to the horizontal. In the ordinary method of slices it is assumed that the inter-slice forces acting in the horizontal direction cancel each other.
The shear force at the bottom of the slice (Sn) is defined as
where
τn is the shear stress for slice
n. Using
Eq. (2) the above equation may be rewritten as
|
S
n
=
σ
n
tanϕ
f
s
Δ
l
n
| (5) |
where
σn is the normal stress on slice
n, while
fs and
ϕ are assumed to remain constant for all the slices. The region enclosed by the slip plane is assumed to have the properties of the coke layer, without evaluating the composition of parts of other layers which may be included in the slip region. This assumption is motivated by the fact that coke layer is the largest fraction constituting the region. Although, this supposition gives an approximate factor which depends primarily on the layer surface structure, yet it is expectedly the most important factor determining the failure for relatively thicker layers. The approximation reduces the computational load considerably making it useful for faster evaluation of slope stability, especially useful for online applications.
The normal force (Nn) on the slip surface is given by
From the free body diagram (Fig. 1, right) the normal force may also be expressed as
|
N
n
=(
W
n
+
F
n
)
cos
α
n
| (7) |
At the critical point of equilibrium, the clockwise and anti-clockwise moments around O, the center of the slip surface, are equal, so
|
∑
n
(
W
n
+
F
n
)
Rsin
α
n
=
∑
n
S
n
R
| (8) |
where
R is the radius of curvature for the slip plane. Substituting the value of
Sn from
Eq. (5) yields
|
∑
n
(
W
n
+
F
n
)
Rsin
α
n
=
∑
n
σ
n
tanϕ
f
s
Δ
l
n
R
| (9) |
Using Eqs. (6), (7) and (9) we get
|
∑
n
(
W
n
+
F
n
)
Rsin
α
n
=
∑
n
(
W
n
+
F
n
)
cos
α
n
tanϕ
Δ
l
n
f
s
Δ
l
n
R
| (10) |
Rearranging the equation, an expression for factor of safety is obtained as
|
f
s
=
∑
n
(
W
n
+
F
n
)
cos
α
n
tanϕ
∑
n
(
W
n
+
F
n
)
sin
α
n
| (11) |
Therefore, the stability of a slope formed by granular particles when an external force is applied on the heap is a function of magnitude and position of the force acting on the slope, density of the material forming the slope and frictional resistance applied by the material.
This factor of safety is evaluated using different trial points as centers of curvature (intersections of the grid in left of Fig. 1). The failure plane is assumed to pass through the intersection of wall and the layer surface.19) Figure 2 shows the contour of calculated factor of safety values for different centers of rotation. The minimum corresponds to the critical factor of safety and defines the stability of the layer surface.

Modes of failure: During the charging process there are three possibilities. Firstly, the slope does not change significantly due to the incoming stream. Secondly, impact failure may occur when the pellet stream displaces the particles but there is no collapse of the layer. Thirdly, gravity failure occurs when the slope is unstable and the particles flow to the center of the furnace, in turn changing the slope of the layer. The two possible failure modes are indicated in the top part of Fig. 3.23) Previous studies have also referred to impact failure as gouge formation.16) Each of these failure modes depends on the shape of the coke layer surface and the radial position of the pellet stream. The factor of safety of a surface depends on these aspects, and a higher factor means a stable slope. In this study, the three possibilities of failure are assessed by estimating the factor of safety of a slope: if the value is high enough then the slope is stable, for a medium-level value impact failure is taken to occur, while a low value of the safety factor corresponds to a gravity failure. In practice, the impact failure and gravity failure may occur in combination, but this was neglected in the present study to make the model manageable.

Consideration of coke collapse in the mathematical model: Figure 4 shows the schematic diagram of the implementation of the failure modes into the mathematical model. The factor of safety is evaluated for a particular coke surface against a pellet stream entering at a particular position, and is used to determine if the coke slope needs correction. If the value is lower than a threshold value, impact failure is taken to occur and the coke apex is only moved towards the furnace center but the surface would not collapse. For highly unstable slopes, i.e., very low values of the safety factor, gravity failure is expected where part of the coke layer would break away and slide to the center.

The lower part of Fig. 3 schematically illustrates the correction scheme for a coke layer which results in impact failure and gravity failure. To correct the coke layer to accommodate the failure mechanisms the apex of the coke layer (r, y) is moved towards the center. The radial displacement, Δr, results in a vertical displacement, Δy, which is calculated from the constraint that the volume of the coke layer before and after the collapse should be equal. Thus, no change is voidage is taken to occur. In case of impact failure the apex is displaced by a small amount and the corresponding factor of safety for the reconstructed layer is calculated. The factor of safety increases as the apex is moved towards the center as shown in Section 4.2 (Fig. 10). If the factor reaches the limit of stability the displacement is stopped, else it is displaced further towards the center and the factor of safety is recalculated. For gravity failure the inner (βi) and outer slopes (βo) of the lines describing the upper surface of the coke layer are decreased because of the collapse, where the decrease depends on the displacement of the apex. The new slopes βi,new and βo,new are given by
|
β
i,new
=
k
i
Δr
β
i
| (12) |
|
β
o,new
=
k
o
Δr
β
o
| (13) |
where
ki and
ko are factors determined empirically and which depend on the dimensions of the furnace. As the slopes of the lines are known, and are less than the original slope, the layer overflows into the center and the extent of overflow would depend on how unstable the initial slope is.
3.2. Discrete Element Model
Discrete Element Modelling is an explicit numerical method used for evaluating the transient interactions between solid particles which undergo translational and rotational motion. The motion of the particles are described mathematically by Newton’s second law. The interactions on the other hand are described by a spring and dashpot model which describe the elastic and plastic nature of the particles, respectively. The governing equations and the values of different parameters are described in detail in a previous work.4)
Traditionally, DEM uses spheres to describe the particles. Iron oxide pellets are relatively smooth and spherical. However, coke particles are highly irregular so they require special consideration. Therefore coke particles were described by clumping together multiple spheres in different orientations to mimic actual particle templates. Five different particle templates4) were used and they were charged in equal proportions. The maximum diameter of the coke particles for each particle template was 12.5 mm for large coke, 7.5 mm for small coke and 18 mm for center coke. No size distribution was considered. The pellet particles were represented by spheres of 3 mm diameter.
The simulation setup is described in Fig. 5. DEM simulation is computationally expensive because of a large number of particles and a maximum time step in the order of 10−5 s. To reduce the computational burden, a 90° section of the throat was simulated which reduced the number of particles considerably. This introduced artificial wall effects so only a smaller section in the middle of the simulated region was used to report the results. It should also be stressed that because of this setup the particles have very limited space near the center of the furnace, so the results in this region should be disregarded. The particles were generated in a channel above the chute at the same rate in which they were charged in the experimental setup, from where they fall down on the chute, slide along it and form a stream which hits the burden surface and creates a ring of burden on it.
4. Results and Discussion
4.1. Comparison of Charging Programs
A set of small-scale experiments and corresponding simulations were undertaken, as listed in Table 1. The charging programs, denoted by CP1–CP5, were designed to study certain basic features of the layer-formation process and the coke push effect. In the experiments, a thin layer of pellets was first charged making the starting burden surface profile mimic that of a pellet layer covering the whole surface. This base pellet layer also mimics the upper surface of the final pellet layer in the charging program, which in practice is repeated over and over in the real process. This base layer was not considered in the calculations. Next, two coke dumps were charged, each of two different sizes, referred to as large coke (10 mm–16 mm) and small coke (5 mm–10 mm). They were followed by a center-coke charge (16 mm–20 mm). Finally, two dumps of pellets were charged at higher chute angles. The pellet layer covered the burden surface almost entirely.
Table 1. Charging programs with material type, dump mass and chute positions (P: pellets, LC: large coke, SC: small coke, CC: center coke).
| Code | | Base | Layer 1 | Layer 2 | Layer 3 | Layer 4 | Layer 5 | Layer 6 |
|---|
| CP1 | Material | P | LC | SC | CC | P | P | |
| Mass (kg) | 7.45 | 3.89 | 3.89 | 0.58 | 16.59 | 16.59 | |
| Chute pos. | 10 | 6 | 4 | 1 | 10 | 10 | |
| CP2 | Material | P | LC | SC | CC | P | P | |
| Mass (kg) | 7.45 | 3.89 | 3.89 | 0.58 | 16.59 | 16.59 | |
| Chute pos. | 10 | 8 | 6 | 1 | 10 | 10 | |
| CP3 | Material | P | LC | SC | CC | P | P | |
| Mass (kg) | 7.45 | 3.89 | 3.89 | 0.58 | 16.59 | 16.59 | |
| Chute pos. | 10 | 6 | 9 | 1 | 10 | 10 | |
| CP4 | Material | P | LC | SC | SC | CC | P | P |
| Mass (kg) | 7.45 | 3.59 | 2.33 | 1.56 | 0.58 | 16.59 | 16.59 |
| Chute pos. | 10 | 6 | 9 | 3 | 1 | 10 | 10 |
| CP5 | Material | P | SC | LC | CC | P | P | |
| Mass (kg) | 7.45 | 3.89 | 3.89 | 0.58 | 16.59 | 16.59 | |
| Chute pos. | 10 | 6 | 4 | 1 | 10 | 10 | |
In the first charging program, CP1, the small coke and the large coke were charged at chute positions 6 and 4 respectively. In CP3 the small coke dump was charged at higher position, while in CP2 both coke sizes were charged at higher positions compared to CP1. The small coke dump in CP4 was split into two parts in the ratio of 2:3, and the small fraction was dumped closer to the center. Finally, for CP5 the order of charging the coke sizes was interchanged compared to that of CP1.
For each charging program, a corresponding experiment was carried out using a small-scale model (see section 2) along with a corresponding DEM simulation using a furnace section (subsection 3.2). The mathematical model (subsection 3.1) was also utilized to predict the burden distribution. Figure 6 presents the results in a tabular format. The experimental column shows the profile measurements after every dump. Here, the region in between two consecutive profiles is assumed to be occupied by the dump of the charged material. As this strategy disregards the collapse of the lighter coke layers upon charging the heavier pellet layer, it treats the results like the mathematical model, which does not either consider coke push effects. In cases where the coke push is significant, e.g., in CP2 and CP3, the experimental results are very different from those of the DEM simulation for the state at the end of charging. Furthermore, ‘apparent profiles’ from the DEM simulations have also been depicted. These are constructed by registering the burden surface profile after the simulated charging of each dump, assuming the region between two such consecutive profiles be filled by the charged particles in question. Again, it should be stressed that limited attention should be paid to the results near the center of the DEM simulations due to the confined space in this region. This makes the DEM results unreliable for r<0.2Rthroat (cf. Fig. 3). Figure 7 presents the volumetric ore fractions for each of the charging programs, measured or simulated at different radial positions. These give an indication of the probable gas flow distribution in a blast furnace applying the charging programs in question: regions with low ore fraction (and high coke fraction) results in higher gas permeability, while a high ore fraction leads to less gas flow.

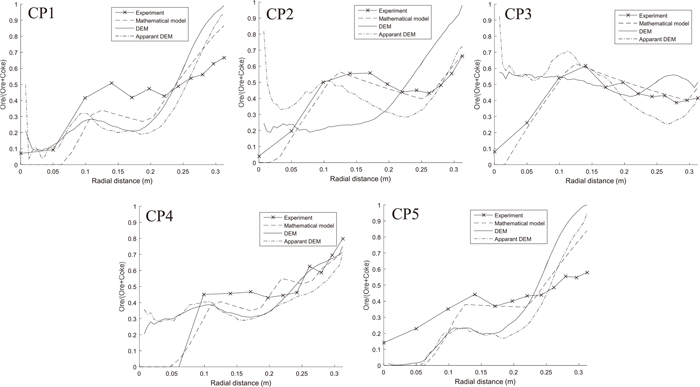
The volumetric ore fraction distribution for CP1 shows higher ore share near the furnace wall, while near the center the material is mainly coke. In the intermediate region the ratio is quite constant. The profile measurements and simulated profiles are quite similar. This is so because the pellet dumps (cf. Fig. 6) mainly form a pocket outside of the ridge formed by the coke dumps, leading to little shifting of the coke layers. The effect of the coke collapse in CP2 is clearly reflected in the profiles, seen as a considerable difference between the final distribution predicted by DEM and the other profiles: The coke layer is here moved significantly to the center of the furnace, and the share of ore near the wall is significantly higher in the DEM results. CP3 shows similar, but less pronounced, trends. For both CP2 and CP3 the small coke is dumped at higher chute angles, so the pellet dump that follows cannot be trapped in the pocket at the wall like in CP1: The pellet dump overflows the pocket, breaking away the weakest parts of the lower coke layer pushing it towards the center. In CP4 the small coke dump is split into two parts, where the second is charged at lower chute angles which increases the stability of the coke layer. Finally CP5 shows a different behavior than CP1, even though the charging positons are same, since the order of coke sizes is reversed. The large difference between the sizes of large coke and the pellet particles induces granular convection,24) commonly referred to as “brazil nut effect”. As the pellet particles push some of the larger particles to the top, this would result in a larger mixed layer. This effect is difficult to evaluate without DEM simulation.
Figure 8 presents isometric and sectional views of the burden for CP2 and CP3 at the point when about half of the first pellet layer has been charged. The coke particles are colored according to their velocity. In sub-figures (a), (c), (d), (e), (g) and (h), the pellet particles are colored olive to distinguish them from the coke particles. In sub-figures (b) and (f) the pellet particles are rendered invisible, showing the coke front which is moved by the pellet particles. It is clear from the figures that both charging programs give rise to significant coke push effects, but the extent of collapse is higher in CP3 than in CP2 as the particles which are pushed have higher velocity. Therefore, unlike CP2 the shifted particles in CP3 roll to the center of the furnace. The extent of coke collapse is different in the two cases and CP2 is classified as impact failure whereas CP3 is gravity failure.
4.2. Revision of the Layers in the Mathematical Model
The results from the mathematical model were seen to be different from findings of the DEM simulations as the former fails to consider coke collapse. This may result in unreliable prediction of the burden distribution for certain charging programs. Therefore, the slope stability model was used to predict the occurrence and extent of coke collapse (cf. subsection 3.1). The friction factor for coke is assumed to be tan(ϕ)=0.43 and a point force of F=12 N25) is assumed at the point of charging on the coke layer surface. The threshold for critical factor of safety for impact failure was taken to be 0.8 and that for the gravity failure was assumed to be 0.6.
Figure 9 shows that the calculated factor of safety for CP2 and CP3 is very low before charging the pellet layer. The factor calculated for the coke surface after the pellet has been charged has become higher as the surface has reached stability with respect to the force of pellet stream. As the coke layer was reconstructed by gradually moving the layer apex towards the center (Fig. 10) it eventually became stable with respect to the applied external force. The crosses and circles mark the factors of safety before and after the correction. It is seen that programs CP2 and CP3 require coke-layer deformation to make the layer stable, while CP1, CP4 and CP5 are (relatively) stable initially. It is also evident that distributing the coke layer into two parts (CP4, compared to CP3), and charging part of the dump near the center improves the stability by a great extent. Figure 11 presents the results from the corrected and uncorrected mathematical model cross-sections. The corrected results have some similarity to the DEM simulation. The volumetric ore fractions show a similar trend near the furnace wall but the trend is not captured well in the intermediate regions between center and the wall. In case of CP2, the peak for correction volumetric fraction near radial distance 0.1 m is sharp, unlike the DEM simulation which is flatter. This sharpness is absent in realistic owing to the formation of the mixed layer of loose coke and pellet. This sharpness would also be diluted for calculation of actual furnace dimensions. In case of CP3, as the coke collapses to the center, the repose angle of the pellet also changes as the lower surface is not stagnant anymore. Therefore the repose angle should be changed adequately to match the volumetric ore fraction of DEM. In this work, the effect of the coke collapse on the pellet repose angle is not considered. A yellow line in subplot (f) is added to indicate the pellet layer boundary with lower repose angle for pellet layer. Visual inspection can confirm that considering lower repose angle would make the profile similar to the DEM simulation cross-section (g), which would make the volumetric ore fraction of the corrected model closer to the DEM simulation.

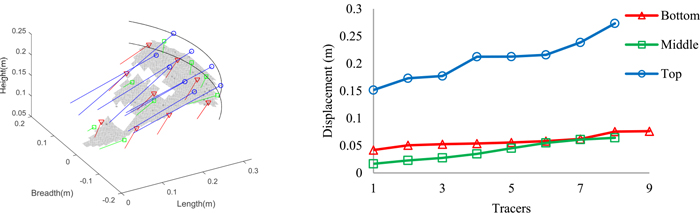
Coke collapse was very evident from the DEM simulation but it was difficult to observe experimentally as the measured burden surface profiles and visual observations gave little indication about the motion of the coke particles. Therefore one of the charging programs, CP3, which had suffered gravity failure and maximum coke collapse, was repeated with some tracers embedded into the small coke layer. White colored coke particles were utilized as tracers that were distinguished from one another by registering their weight and appearance before the experiment. After normal charging of the previous layers of the charging program, the layer of small coke was reconstructed manually on the basis of the experimental results of Section 4.1 with tracer particles embedded. The first set of tracers were placed just above the large coke layer (‘bottom’), the next set halfway into the layer (‘middle’) and the final ones on the surface (‘top’) of the layer of small coke, as indicated in the left part of Fig. 12. The top row of panels (a–c) in Fig. 13 presents snapshots from above after placing the tracers at each stage. After this reconstruction, a pellet layer was charged, cf. Fig. 13(d), which shifted part of the coke layer with the embedded tracers. The pellet and coke particles were then gradually and carefully removed using a suction device without disturbing nearby particles. As a tracer particle was encountered, a snapshot was taken (Figs. 13(e), 13(f)) and the vertical level of the particle was measured. This measurement along with the radial and azimuthal position of the tracer identified using image analysis, gave the final spatial position of the tracer before and after charging the pellet layer.


From the right panel of Fig. 12 it is evident that the tracers have moved towards the center of the furnace. As expected, the ‘top’ tracers have moved the farthest which is also confirmed from the isometric view of the tracer positions in the left panel of Fig. 14. The mean displacement of the ‘top’ tracers is about four times that in the ‘middle’ and ‘bottom’ (Fig. 14, right). These top tracers are easily swept by the heavy pellet layer unlike the other ones, which were constrained by surrounding coke particles. The results of a DEM simulation of the charging program (Fig. 15) also yield very similar findings: The particles near the free surface move the farthest towards the center of the furnace. It can be concluded that the upper portion of the layer travels farthest to the center, but the extent of this portion should depend on the stress exerted by the pellet stream and the dimension of the particles. Therefore the extent of such sliding behavior would be different in an actual furnace.
The results presented above make it possible to predict the stability of slopes formed by coke on charging pellets at higher angles using mathematical modeling. A charging program similar to those analyzed in the previous sections was chosen with a dump of large coke, a dump of small coke, a center-coke dump and two pellet dumps. The pellet dumps were charged at high angles. The chute positions for the small and the large coke were varied in the range 3–9 (cf. Table 2) and the theory of subsection 3.1 was used to analyze the stability of the coke layer. This exercise was repeated without the center coke to see the effect of center coke on the stability of the coke layer. As the small coke dump was charged more towards the center, i.e., at lower chute positions, the slope became stable, resulting in higher factor of safety values (Fig. 16). The results of three of charging programs analyzed earlier (CP1, CP2 and CP3) have also been reported in the figure. The figure presents the safety factors in contour plots for a coke layer with (left) or without (right) a center coke charge. The center coke is seen to stabilize the coke layer making it less prone to collapse. Also, except at very large positions of the small coke dump, the results are quite insensitive to the position of the large coke, while a clear decrease in stability is noted with growing position of the small coke dump. Thus, small coke charged close to the wall is likely to give rise to an unstable slope of the coke-layer surface and therefore prone to coke collapse.
Table 2. Charging program for studying the effect of the large coke and small coke positions on the stability of coke layer.
| Layer 1 | Layer 2 | Layer 3 | Layer 4 | Layer 5 |
|---|
| Material | LC | SC | CC | P | P |
| Mass, kg | 3.89 | 3.89 | 0.58, 0.00 | 16.59 | 16.59 |
| Chute position | 3–9 | 3–9 | 1 | 10 | 10 |
5. Conclusions
In this work the coke collapse phenomenon in the blast furnace has been investigated using five model charging programs. The charging programs consisted of two coke layers charged in different positions, a center coke dump and two pellet dumps. The pellet dumps were charged at higher angles which affected the coke layers differently depending on the charging position of the underlying coke layers. For each of the charging programs an experiment was performed using a scaled model and DEM simulation was carried out. DEM simulation gave a better understanding of the extent of coke collapse in each of the charging programs, as the mode and extent of collapse was different in each case. In cases where significant collapse was observed they were classified as impact failure or gravity failure. Experiments suggested that when the pellet stream hits the coke layer, some coke particles in the topmost layer obtain much higher velocity than the particles embedded inside the layer, and therefore they experience the maximum displacement. It was also observed that instead of charging the full coke dump at higher angles, charging a fraction of the dump closer to the center also reduces the chances of collapse. A mathematical model which was developed in an earlier study21) was augmented to incorporate the coke collapse using slope stability theory. After this modification, the model was demonstrated to consider the effect of coke collapse fairly. The effect of coke positions in a particular set of charging program was finally analyzed. It was observed that layers formed by charging coke at higher chute angles were unstable to the pellet stream because the pocket containing the pellets outside the coke apex was very small.
Although in this study the collapse has been quantified well for a scaled model, further work is required to understand if this theory also describes the collapse in full scale. The findings of the study are still expected to be useful in determining the stability of coke layers in different charging programs, thus giving the operator an indication whether a specific charging program is prone to exhibit collapse and, if so, also providing guidelines on possible changes to stabilizing it.
Acknowledgements
The authors would like to acknowledge Dr. Peter Austin of BlueScope Steel, Australia, for making his research results on coke collapse, described in Ref. 23), available. The Graduate School in Chemical Engineering, Tekes and participating industry in the SIMP program coordinated by FIMECC Ltd. are also acknowledged for financial support. The discrete element method simulations and analysis were conducted using the EDEM software provided by DEM Solutions Ltd., Edinburgh, Scotland.
References
- 1) H. Mio, S. Komatsuki, M. Akashi, A. Shimosaka, Y. Shirakawa, J. Hidaka, M. Kadowaki, S. Matsuzaki and K. Kunitomo: ISIJ Int., 49 (2009), 479.
- 2) Y. W. Yu, C. G. Bai, Z. R. Zhang, F. Wang, D. G. Lv and C. Pan: Ironmaking Steelmaking, 36 (2009), 505.
- 3) Y. Yu and H. Saxén: Steel Res. Int., 84 (2013), 1018.
- 4) T. Mitra and H. Saxén: Comp. Part. Mech., (2015), DOI 10.1007/s40571-015-0084-1.
- 5) H. Mio, K. Yamamoto, A. Shimosaka, Y. Shirakawa and J. Hidaka: ISIJ Int., 47 (2007), 1745.
- 6) M. Icida, M. Takao, K. Kunitomo, S. Matsuzaki, T. Deno and K. Nishihara: ISIJ Int., 36 (1996), 493.
- 7) S. Liu, Z. Zhou, K. Dong, A. Yu, J. Tsalapatis and D. Pinson: AIP Conf. Proc., 1542 (2013), 634.
- 8) J. Jiminez, J. Mochon, A. Formoso and J. S. Ayala: ISIJ Int., 40 (2000), 114.
- 9) Y. Kajiwara, T. Jimbo, T. Joko, Y. Aminaga and T. Inada: Trans. Iron Steel Inst. Jpn., 24 (1984), 799.
- 10) Y. Matsui, A. Kasai, K. Ito, T. Matsuo, S. Kitayama and N. Nagai: ISIJ Int., 43 (2003), 1159.
- 11) P. K. Gupta, A. S. Rao, V. R. Sekhar, M. Ranjan and T. K. Naha: Ironmaking Steelmaking, 37 (2010), 235.
- 12) J. J. Poveromo: Iron Steelmak., (1995), 64.
- 13) M. Nikus, J. Hinnelä and H. Saxén: Steel Res., 68 (1998), 406.
- 14) Y. Kajiwara, T. Jimbo and T. Sakai: Trans. Iron Steel Inst. Jpn., 23 (1983), 1045.
- 15) S. H. Gharat and D. V. Khakar: Procedia Eng., 102 (2015), 676.
- 16) C. K. Ho, S. M. Wu, H. P. Zhu, A. B. Yu and S. T. Tsai: Miner. Eng., 22 (2009), 986.
- 17) S. Nag, S. Basu and A. B. Yu: Ironmaking Steelmaking, 36 (2009), 509.
- 18) S. Wu, C. Fu, C. Liu, J. Xu and M. Kou: J. Iron. Steel Res. Int., 18 (2011), 8.
- 19) D. S. Tsai, C. C. Lo, J. R. Jeng and C. K. Ho: J. Chin. Inst. Eng., 11 (1988), 199.
- 20) US Army Corps of Engineers: Eng. Manual EM1110-2-1902, U.S. Army Corps of Engineers, Washington, DC, (2003).
- 21) T. Mitra and H. Saxén: Metall. Mater. Trans. B, 45 (2014), 2382.
- 22) T. Mitra and H. Saxén: Mater. Manuf. Process., 30 (2015), 474.
- 23) P. Austin and D. Vass: Chemeca 99, Chem. Eng., Inst. of Eng., Institution of Engineers, Australia, (1999), 363.
- 24) J. B. Knight, H. M. Jaeger and S. R. Nagel: Phys. Rev. Lett., 70 (1993), 3728.
- 25) A. Westerlund: Åbo Akademi University, Turku, (2010), M.Sc. thesis.


