Abstract
It is desirable to enhance the desulfurization and dephosphorization rates and their efficiencies in steelmaking. Injection of flux particles is one of the key technologies, and knowledge of the behavior of the particles when they penetrate into a metal bath is important to control the process. In this study, two-dimensional and three-dimensional simulation models were developed to study the penetration behavior when a solid body penetrates into a liquid, using the SPH method with a new pairwise potential. The three-dimensional simulation model could reproduce the experimental results in the water model satisfactorily, and was applied to a lime sphere-molten iron bath system. The penetration length and the residence time increased with the increase in initial velocity. The residence time of the sphere also increased as the wettability increased. The critical velocity for penetration, estimated by simulation, showed good agreement with that calculated using Ozawa’s equation.
1. Introduction
As the need for high quality steels are increasing in recent times, it is desirable to enhance the rates and efficiencies of desulfurization and dephosphorization of molten steel. The refining flux particles such as lime should be dispersed into and contacted with metal to attain these goals. Injection of flux particles into the metal bath is one of the key technologies, and is widely used in many steelmaking processes. Therefore, knowledge of the behavior of the particles when they penetrate into a metal bath is important to control the flux injection process. The penetration behavior of an entire gas-particle mixed jet has been investigated by several researchers;1,2,3) however, research work on the behavior of the injected particle itself are limited. Ozawa et al.4) reported the critical velocity for penetration of a solid sphere from studies on free-falling spheres and a mercury bath. Lee et al.5) measured the maximum length of penetration of a polystyrene sphere into a water bath and reported its dependency on the velocity of the sphere. Shimamoto et al.6) and Tanaka et al.7) observed the penetration of solid spheres in water model experiments. Since it is difficult to observe the penetration of a flux particle into molten iron experimentally, simulation using computational fluid dynamics will be the most promising approach. The recently developed particle method can be applied to this kind of simulation with the large surface deformations because the particle method is free from any grid tangling problems.
In this study, two-dimensional and three-dimensional simulation models were developed to study the penetration behavior of a solid body when it penetrates into a liquid, and the smoothed particle hydrodynamics (SPH) method using a new pairwise potential introduced by the authors8) was employed. The model was used for the study of the penetration of a polystyrene sphere into a water bath to check its validity, and was then used for simulation of the penetration of a lime sphere into a molten iron bath. The penetration length and the residence time were calculated and the critical penetration velocity was estimated.
The detailed explanation of the SPH method is covered in a previous paper8,9,10) and in other publications.11,12) Lucy’s kernel function W(r,h), defined in Eq. (1), was used in this study. In the equation, r is the distance between the particles, and h is the effective radius of the kernel function.
|
W(
r,h
)
=ω(
5
π
h
2
)
(
1+3
r
h
)
(
1-
r
h
)
3
| (1) |
The governing equation is the Navier–Stokes equation, where v is the velocity, ρ is the density, P is the pressure, μ is the viscosity, and F is an external force. The gravity and interfacial force are included in F. The space derivatives of a physical property can be expressed by using those of the kernel function and Eq. (2) was discretized for the numerical calculation.
|
Dv
Dt
=-
1
ρ
∇P+
μ
ρ
Δv+F
| (2) |
Using a dimensionless distance q(=r/h), the pairwise potential ϕ was used to calculate the interfacial force, as shown in Eq. (3), where d is the initial particle distance, and E is the energy coefficient for liquid–liquid particles.
|
ϕ(
q≤1
)
=E(
q-
h-3d
2h
)
(
q-1
)
2
| (3) |
The interfacial force vector Finter is expressed as Eq. (4), where an arrow on r indicates a vector. Equation (3) is substituted into the external force term in Eq. (4).2,8) θ is an equilibrium contact angle which is used as the wettability parameter in this model.
|
F
inter
=
1
2
(
cosθ+1
)
⋅∑
dϕ(
q
)
dq
r
→
| r |
| (4) |
In order to reduce the calculation time, parallel processing was performed using an Intel Xenon X5675 (3.07 GHz, 6 cores)×2 for all calculations.
3. Two Dimensional Model
3.1. Penetration of Polystyrene Sphere into Water
The penetration of a polystyrene sphere into a water bath was simulated for Lee’s experimental conditions using a two-dimensional model to check the validity of this simulation program. The additional water-model experiment was also conducted under the same conditions as the simulation just to observe the cavity shape. The simulation conditions are listed in Table 1.
Table 1. Simulation conditions.
| system | polystyrene-water | lime-molten iron |
|---|
| 2D | 3D |
|---|
| temperature (K) | 293 | 1873 |
| sphere diameter (mm) | 3.0 | 3.0 |
| bath size (mm) | 80×100 | 30×30×50 | 30×30×50 |
| initial particle disitance (mm) | 1.0 | 0.75 | 0.75 |
| number of particles (-) | 10200 | 107200 | 107200 |
| solid density (kg/m3)13) | 974 | 3500 |
| liquid density (kg/m3)13) | 998 | 7020 |
| viscosity (Pa·s)13) | 0.100 | 4.8 |
| surface tension (mN/m)13) | 72.8 | 1800 |
| contact angle (deg) | 90 | 110 |
Figure 1 shows the snapshot of the penetrating sphere, 3 mm in diameter, with an initial velocity of 19 m/s, obtained from simulation. The image on the lower right side is the one captured during an experiment by the authors under the same condition. By comparing the simulation result with this image, it can be seen that the movement of the sphere seems to be reproduced, but the shape of the cavity is quite different.

Figure 2(a) shows the effect of initial velocity on the maximum value of the penetration length of the sphere, which is defined as the vertical distance from the initial bath surface to the bottom of the sphere. It is compared with the experimental data observed by Lee et al.,5) which are shown as a shaded band because of their scatter. The calculation result agreed fairly well with the experimental result. Figure 2(b) shows the variation of maximum cavity radius with initial velocity. The calculation overestimates the actual value. Therefore, the penetration behavior cannot be reproduced using a two-dimensional model. This is because the momentum of the sphere that is transferred to water spreads the cavity in two directions in this model, whereas it spreads the cavity in three directions in the actual phenomena.
4. Three Dimensional Model
4.1. Penetration of Polystyrene Sphere into Water
A three-dimensional model was developed and the same simulations were conducted as done using the two-dimensional model. The simulation conditions were almost the same, but the size of the water bath was much smaller (30 mm × 30 mm × 50 mm) than that of Lee’s experiment;5) this is because the number of particles was dramatically increased in the three-dimensional model, and hence the size of the water bath was limited by the computation performance of the computer used. Since the penetration phenomenon finished in a very short period of time, the momentum transfer was limited within the vicinity of the moving sphere. Therefore, the effect of the reduction of the bath size on the calculation results were expected to be small. The simulation conditions are listed in Table 1.
Figure 3 shows the snapshot of the penetrating sphere, 3 mm in diameter, with an initial velocity of 19 m/s. The image on the lower right side is the same as the one shown in Fig. 1. By comparison, it can be seen that both the movement of the sphere and the shape of the cavity are reasonably similar.
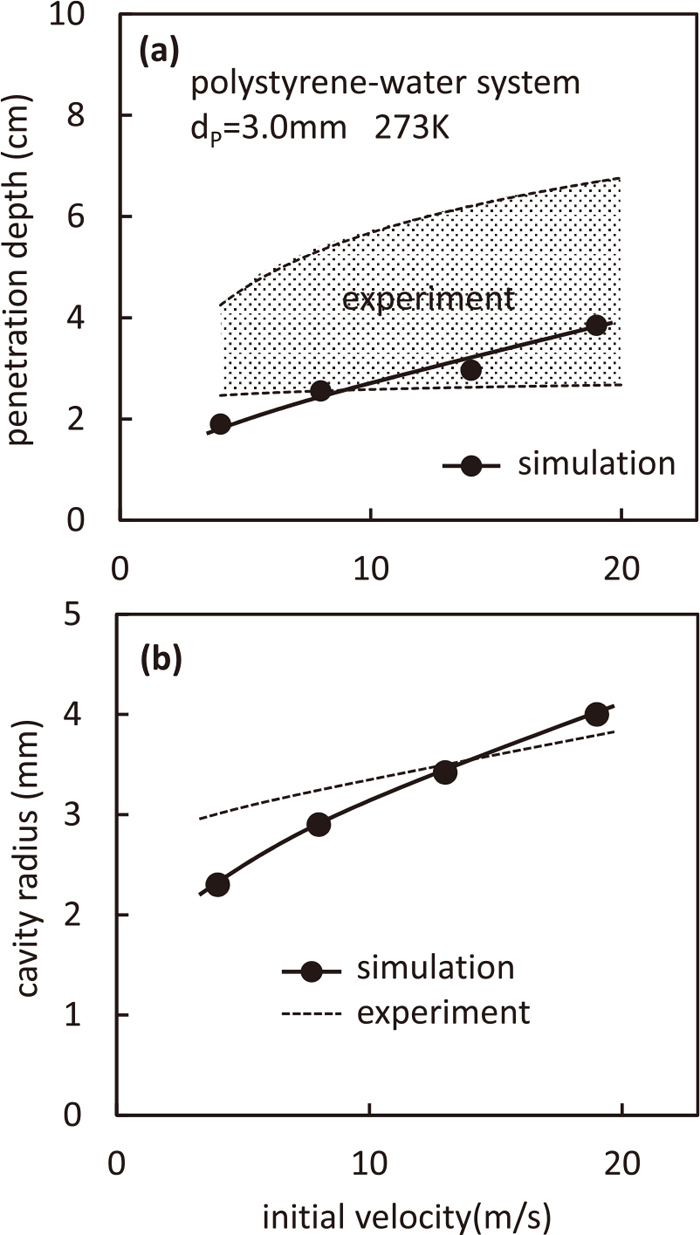
Figure 4(a) shows the effect of initial velocity on the maximum value of the penetration length of the sphere. The calculated values are within the experimental data, which shows a good agreement with the experimental results. Figure 4(b) shows the variation of maximum cavity radius with initial velocity. The calculation result agrees with the experimental result satisfactorily. Therefore, it can be confirmed that the three-dimensional simulation model developed in this study can reproduce the actual penetration phenomena.
4.2. Penetration of Lime Sphere into Molten Iron
For the purpose of this study the developed three-dimensional model was applied to a molten metal system. The lime sphere was chosen as a popular refining flux. Its diameter was set to be 3 mm which was the minimum value available in this calculation, because the sufficient number of particles were needed to describe the sphere precisely. The pure molten iron at 1873 K was chosen as a molten metal, because its physical properties were available in the literature. The simulation conditions are listed in Table 1.
Figure 5 shows the snapshot of the penetrating sphere with an initial velocity of 14 m/s. The lime sphere reached a maximum penetration length that was four times larger than its diameter after 10 ms, and then began to float up. The cavity radius was almost two times larger than that of the sphere.
Figure 6 shows the effect of the initial velocity of the sphere on the maximum penetration length. It can be seen that the maximum penetration length increases with the increase in initial velocity. The residence time of the sphere in the iron bath also increased from 50 ms at 4 m/s to 170 ms at 19 m/s. The effect of wettability of the flux was calculated by changing its contact angle.

Figure 7 shows the penetration length as a function of time for various contact angles when the initial velocity was 14 m/s. It can be seen that wettability has little effect on the penetration behavior and the maximum penetration length. However, the rate at which the sphere was floating up decreased and the residence time of the sphere in the bath increased with the increase in wettability. Tanaka et al.7) observed that a poorly wetted particle had an air bubble on its rear surface in the water model experiment; this supports the calculation results. However, the existence of air bubbles on the sphere could not be detected in the simulation. The detection of bubbles would become possible by decreasing the distance between the particles, but this will cause a significant increase in the number of particles inevitably.
4.3. Estimation of Critical Velocity
Ozawa et al.3) observed that a dropped solid sphere jumped up from the surface cavity of mercury when the initial velocity was lower than the critical value. They measured the jumping height and determined the critical velocity when the jumping height became zero. The three-dimensional simulation was applied to determine the critical velocity of the lime particle’s penetration into molten iron. The maximum distance from the bath surface, Lm, was determined as the jumping height (positive value) for the non-penetrating sphere and as the submerged depth (minus value) for the penetrating one as shown in Fig. 8.
Figure 9 shows the variation of Lm as a function of initial velocity. It decreased with the increase in initial velocity, and changed from positive to negative around 3.0 m/s, which corresponds to the critical velocity.
Ozawa et al.5) also proposed Eq. (5) for the critical Weber number Wec of the particle penetration into a liquid defined in Eq. (6), when the dimensionless number G defined in Eq. (7) is less than 0.175.
|
W
e
c
=
1
0.044
{
(
1-exp(
0.66
ρ
*
+
1
4
)
)
(
ρ
*
+
1
4
0.33
-1+cosθ
)
+2
}
| (5) |
|
W
e
c
=
r
p
ρ
l
v
c
2
σ
| (6) |
In the above equations, ρ* is the density ratio of the solid and the liquid, rp is the particle radius, ρl is the density of the liquid, vc is the critical velocity, σ is the surface tension of the liquid, and g is the acceleration due to gravity.
Since G is calculated as 0.086 by substituting the calculation conditions into Eqs. (7), (5) can be used. The critical velocity, calculated using Eqs. (5) and (6), was 2.3 m/s, which is rather close to that estimated by this simulation. The more precise calculation of critical velocities for such small spheres may require a large number of particles in the calculation. This will be taken up in a future work.
5. Conclusions
Two-dimensional and three-dimensional simulation models were developed to study the penetration behavior of a solid body when it penetrates into a liquid, using the SPH method with a new pairwise potential. The results obtained are as follows.
(1) The two-dimensional model could not reproduce the actual penetration of a polystyrene sphere into a water bath.
(2) The three-dimensional model could satisfactorily reproduce the polystyrene sphere’s penetration measured by Lee et al.
(3) The three-dimensional model was applied to a lime sphere that impinged on a molten iron at 1873 K. The penetration length and the residence time increased with the increase in initial velocity. The residence time of the sphere also increased as the wettability increased.
(4) The critical velocity for penetration, estimated by simulation, showed a good agreement with that calculated using Ozawa’s equation.
Acknowledgements
The authors wish to thank Mr. Kaneko, graduate student of Waseda University, for his kind help to take pictures in the water model experiment.
References
- 1) E. Kimura: Trans. Iron Steel Inst. Jpn., 23 (1983), 522.
- 2) K. Narita, T. Makino, H. Matsumoto and K. Ogawa: Tetsu-to-Hagané, 69 (1983), 392.
- 3) K. Abe and M. Iguchi: ISIJ Int., 43 (2003), 1342.
- 4) Y. Ozawa, K. Suzuki and K. Mori: Tetsu-to-Hagané, 69 (1983), 753.
- 5) J.-G. Lee and M. Tokuda: Trans. Iron Steel Inst. Jpn., 28 (1988), 278.
- 6) N. Shimamoto, M. Iguchi, T. Uemura and N. Yonehara: Mater. Trans., 45 (2004), 910.
- 7) M. Tanaka, S. Hashimoto, R. Tsujino and M. Iguchi: J. Jpn. Soc. Exp. Mech., 8 (2008), 201.
- 8) M. Nakano and K. Ito: ISIJ Int., 56 (2016), 1297.
- 9) K. Ito: Bull. Iron Steel Inst. Jpn., 19 (2014), 809.
- 10) J. J. Monaghan: J. Comput. Phys., 110 (1994), 339.
- 11) G. R. Liu and M. B. Liu: Smoothed Particle Hydrodynamics, A Mesh FreePparticle Methods, World Scientific Publishing, Singapore, (2003), 30.
- 12) M. Nakano and K. Ito: Proc. Asia Steel 2015, ISIJ, Tokyo, (2015), 598.
- 13) Handbook of Physico-chemical Properties at High Temperatures, ed. by 140th Committee of JSPS, Tokyo, (1988).