Regular Article
Grain Boundary Deformation Phenomena and Secondary Growth of Goss Grains in a Fe-3.5%Si Steel
2017 Volume 57 Issue 10 Pages 1874-1882
Details
2017 Volume 57 Issue 10 Pages 1874-1882
In this investigation, a long-standing grain growth question is addressed in a Fe-3.5% Si steel. This material undergoes secondary growth of Goss oriented grains, but the underlying mechanisms of this growth remain unresolved despite extensive investigations for almost a century. In this investigation, a key question concerning this subject is resolved i.e. whether the nature of primary recrystallization grain boundaries solely determines the growth of Goss grains during secondary recrystallization. To address this issue undeformed and lightly deformed samples were subjected to recrystallization annealing under identical conditions. Although the extent of the deformation is light, such that it creates only limited modifications in the grain boundary structures, the recrystallization mechanism changes from abnormal secondary growth to conventional grain growth. In the former case, recrystallization commences at higher temperatures when the MnS inhibiting particles become dissolved, and in the latter mechanism, recrystallization occurs at lower temperatures due to the differences in stored energy between grains sharing a common boundary. This occurs through strain-induced grain boundary migration.
Secondary recrystallization in grain oriented silicon steels involves a number of {110}<001> oriented grains growing into the surrounding grains in the primary recrystallized structure. This typically consists of equiaxed grains ~50 μm in diameter. At the completion of secondary recrystallization the grains become very large i.e. several millimeters in size. Grains with such orientations are known as Goss grains and a high population of grains of this orientation in a steel sheet is attractive for use as laminated cores in electric transformers, since <100> in a bcc lattices is the easiest magnetization direction for reduced core losses.1) Forming Goss grains in the steel sheet involves complex control over both materials chemistry and the thermomechanical processing sequence.2,3,4) Grain oriented silicon steels can be divided into two broad categories based on the processing routes employed: high permeability grain oriented (HGO) steels and conventional grain oriented (CGO) steels. The former and latter materials involve either one or two pass rolling reductions, respectively, during the cold deformation processing of the hot band steel. The particle chemistry of inhibitors used to restrict grain growth in HGO and CGO steels are also different. These particle inhibitors, along with the manufacturing route, generate differences in the spread of the Goss orientation at the end of the secondary recrystallization annealing, typically at ~950°C. In HGO steels, the maximum deviations from the ideal Goss orientation remain limited to 3–4°,2,5) but in CGO steels the orientation spread is somewhat larger (7–15°).2,6) As a result the HGO and CGO sheets exhibit permeability values of 1.92 T and 1.83 T, respectively, under an applied electric field of 800 Am−1.1)
In spite of extensive research for almost a century on these steels, understanding of the driving forces for the abnormal growth of Goss grains has yet to reach a consensus. Nevertheless, a number of phenomenological observations have been found, verified and accepted. For example, it is recognized that Goss growth takes place either in the subsurface or mid-thickness regions of the sheet. Moreover, there is a small temperature window above 900°C for Goss growth to commence and, further, that the growth process is sensitive to both processing history and steel chemistry. There are a large number of theories on the growth mechanisms of Goss grains: for example the size advantages of Goss grains,7,8) the high energy boundary advantage surrounding Goss grains,9,10) the role of sub-boundaries in these grains in solid-state wetting mechanisms11,12,13,14) and coincidence site lattice (CSL) boundary mechanisms.15,16,17,18) Among them, the CSL approach is the most well understood theory and probably has gone through the most extensive investigations. Briefly, this suggests that Goss grains are more likely to be surrounded by Σ9 boundaries, which are considered to have lower energy and therefore are ideal sites for early dissolution of inhibiting particles. As a result, during secondary annealing at temperatures over 900°C Goss grains having Σ9 boundaries are set free to grow first, whilst other grains are still try to grow by breaking away from the pinning effects of inhibiting particles.16,19) Homma and Hutchinson18) carried out a study on Fe-3%Si containing both MnS and AlN inhibiting particles and it was found that the Σ9 boundaries contribute to the faster growth of Goss grains over surrounding grains that do not have Σ9 boundaries. They also found a significant decrease in {778}<447> and {411}<148> orientations in the grains surrounding the growing Goss grains during annealing. Goss has a 38.94°<110> orientation relationship with these two orientations, and therefore a decrease of these particular oriented grains during the early stages of secondary growth indicates the role of Σ9 boundaries in assisting Goss grains to grow earlier than other matrix grains.
In other investigations the validity of CSL theory has been questioned. For example, Zaefferer and Chen20) observed a significant difference in the frequency of Σ9 boundaries surrounding Goss grains at the primary recrystallized stage for both CGO and HGO grades (i.e. Goss neighbored Σ9 boundaries in CGO steels are less frequently observed than in HGO steels), but both yield secondary growth of Goss grains after annealing at 900°C. Another finding from the same study was that Σ9 boundaries do not eliminate at an equal rate during annealing in these two grades. This also suggests that Σ9 CSL based boundary growth mechanism may not be applicable for CGO steels, even though for HGO, the proposed Σ9 CSL growth mechanisms is in agreement with the CSL theory. Nevertheless, Hutchinson21) attempted to explain this discrepancy by approaching the problem through texture simulations, whereby the spatial texture distributions of the primary recrystallized structures in CGO and HGO steels was taken as input data and it was found that both Σ9 and Σ5 boundaries are needed for Goss secondary growth in CGO, while only Σ9 boundaries are required for HGO. It is pertinent to note that although the presence of Σ5 boundaries is not essential for HGO steels, it is effective in strengthening the Goss texture. These observations suggest that Goss growth in both CGO and HGO relies on the presence of special lattice boundaries such as Σ9 and Σ5. However, Monte Carlo simulation studies by Chen et al.22) show neither CSL boundaries nor high energy boundaries alone would be sufficient to provide a high enough driving force to stimulate abnormal growth of Goss grains. They found that Goss growth does not take place when the measured CSL or high energy boundary distributions in the primary recrystallized grain aggregate were, separately, taken into account. Therefore, a further investigation as to whether it is grain boundaries that solely govern the growth process or whether other factors such as grain boundary interior substructures play a role is needed.
As such, these issues were addressed in this investigation by comparing the annealing behavior of both, an undeformed and slightly deformed (~8% thickness reduction), primary recrystallized Fe-3.5%Si steel sheet. The modifications in the secondary recrystallization textures due to the disruptions in grain boundary structures and grain interior structures that take place due to the very small amount of plastic strain applied through rolling are described here.
A commercially produced CGO Fe-3.5%Si alloy was received in the primary recrystallized condition containing 20±10 μm equiaxed grains. Briefly, the processing history of this steel is that the sheets were hot rolled and then cold rolled with an intermediate annealing at 950°C in a mixture of H2 and N2 i.e. by the so called “two-pass rolling, CGO” route. The sheets were than decarburized at 820–830°C for 4–5 min in a mixture of H2 and N2. The chemical composition was obtained by inductively coupled plasma – optical emission spectrometry (ICP-OES) technique and the data is presented in Table 1.
| Element | Cr | Ni | Mn | Mo | S | P | Si | Cu | Fe |
|---|---|---|---|---|---|---|---|---|---|
| %wt | 0.095 | 0.09 | 0.06 | 0.01 | 0.02 | 0.005 | 3.5 | 0.2 | 95.3 |
Two experimental routes were performed, in the first route, the as-received primary recrystallized sheets were subjected to secondary recrystallization annealing at either 800 or 900°C. In the second route the sheets were subjected to a rolling reduction of a 10% thickness reduction at room temperature followed by annealing. The aim of this cold-rolling is to disrupt the grain boundary structures, whilst introducing into the grain interiors a random distribution of slip dislocations. The annealing treatments were performed at either 800 or 900°C. All annealing experiments involve rapid heating in a preheated furnace and fast cooling in ambient air. The holding time was either 10 or 60 minutes and no atmospheric gas was used during annealing. The rolling was conducted in two different orientations; one in the original rolling direction termed here as the ‘RD-rolled’ sample and, the second, where the rolling was conducted along the original transverse direction. This sample was termed the ‘TD-rolled’ sample. The microstructures of both the as-received and deformed samples were characterized by transmission electron microscopy (TEM), in particular to observe the presence of the inhibiting precipitates and dislocations structures. TEM samples were prepared by mechanical polishing 3 mm discs to ~100 μm in thickness followed by an argon ion beam thinning at 3.5 kV using a Gatan precision ion polishing system (PIPsTM). The as-received and deformation textures were investigated by electron backscattered diffraction (EBSD) using an Oxford Instrument EBSD detector fitted to a Carl Zeiss Auriga FEG SEM (field emission gun scanning electron microscope). For EBSD sample preparation the cross-section perpendicular to the TD in the final rolling co-ordiante was mechanically polished to a 0.04 μm finish using colloidal silica. The EBSD step size varied from 1 μm to 0.05 μm depending on the feature size of interest. The acquired EBSD data was analyzed using HKL Channel 5TM post processsing software.
Figures 1(a)–1(f) show EBSD measured orientation maps and corresponding <002> pole figures of the as-received, RD-rolled (new rolling direction along the original RD) and TD-rolled (new rolling direction along the original TD) samples. The original rolling co-ordinates are shown in the orientation maps. All three samples show identical orientation distributions along the γ- and η-fibres. In the RD-rolled samples, the <111> directions of the grains are parallel to the sheet normal direction (ND), and in the TD-rolled samples, the <001> directions of the grains are parallel with the sheet RD. These two fibres are outlined by yellow circles and lines, respectively, in the <002> pole figures in Figs. 1(d)–1(f), whereby it is clear that no significant change in the overall texture occurs following a 10% rolling reduction, except minor distortions in the TD-rolled sample. In the orientation maps in Figs. 1(a)–1(c) the black lines represent high misorientation angle (>15°) boundaries and therefore these are treated as the original grain boundaries that were present following primary recrystallization (see Fig. 1(a)). To determine the spatial distribution of the texture in Figs. 1(a)–1(c), the grains within a 15° orientation spread from the γ-fibre, η-fibre and Goss orientations are colour coded. The η-fibre grains dominate in the subsurface regions, whereas the γ-fibre grains in the mid thickness region.
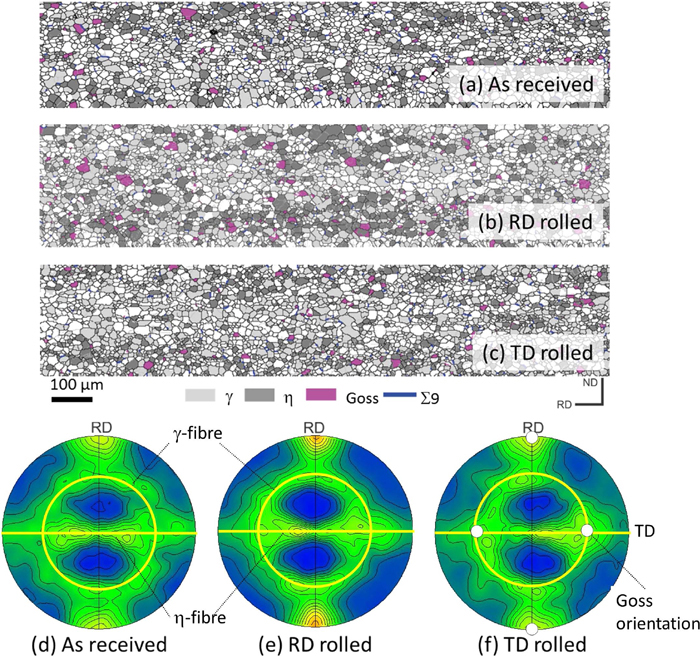
EBSD measured orientation map on the section perpendicular to the TD (TD section) of the original rolling coordinate in the (a) As-received, (b) RD-rolled and (c) TD-rolled samples and (d–f) corresponding contoured <002> pole figures showing the 1,2,3,…. intensities. (Online version in color.)
High-resolution EBSD scans were conducted to investigate the extent of structural changes that take place during the 10% rolling deformations. The EBSD map in Fig. 2(a) shows the high angle (>15°) grain boundary networks marked as black lines. There are insignificant changes in the overall grain shape i.e. the grains still remain almost equiaxed like the primary recrystallized sample presented in Fig. 1(a). In the grain interiors the gradual change in colour indicates small variations in orientation. The superimposed oval marked area shows relatively sharper colour variations than found elsewhere and, therefore, a higher resolution EBSD scan at 0.1 μm steps was conducted on this area and the data is presented in Fig. 2(b). The orientations of the entire grain areas 1, 2, 3 and 4 are plotted in a <002> pole figure in Fig. 2(c) and the orientation spread within a given grain is up to 22° (see the spread for a given point in the pole figure), and point to point (next neighbour) misorientation remains less than 0.8° (the highest value found in this scan area). There is no sign of microband formation in the deformation structures except the diffused strip like orientation variation is grain 3 in Fig. 2(c) (arrowed).
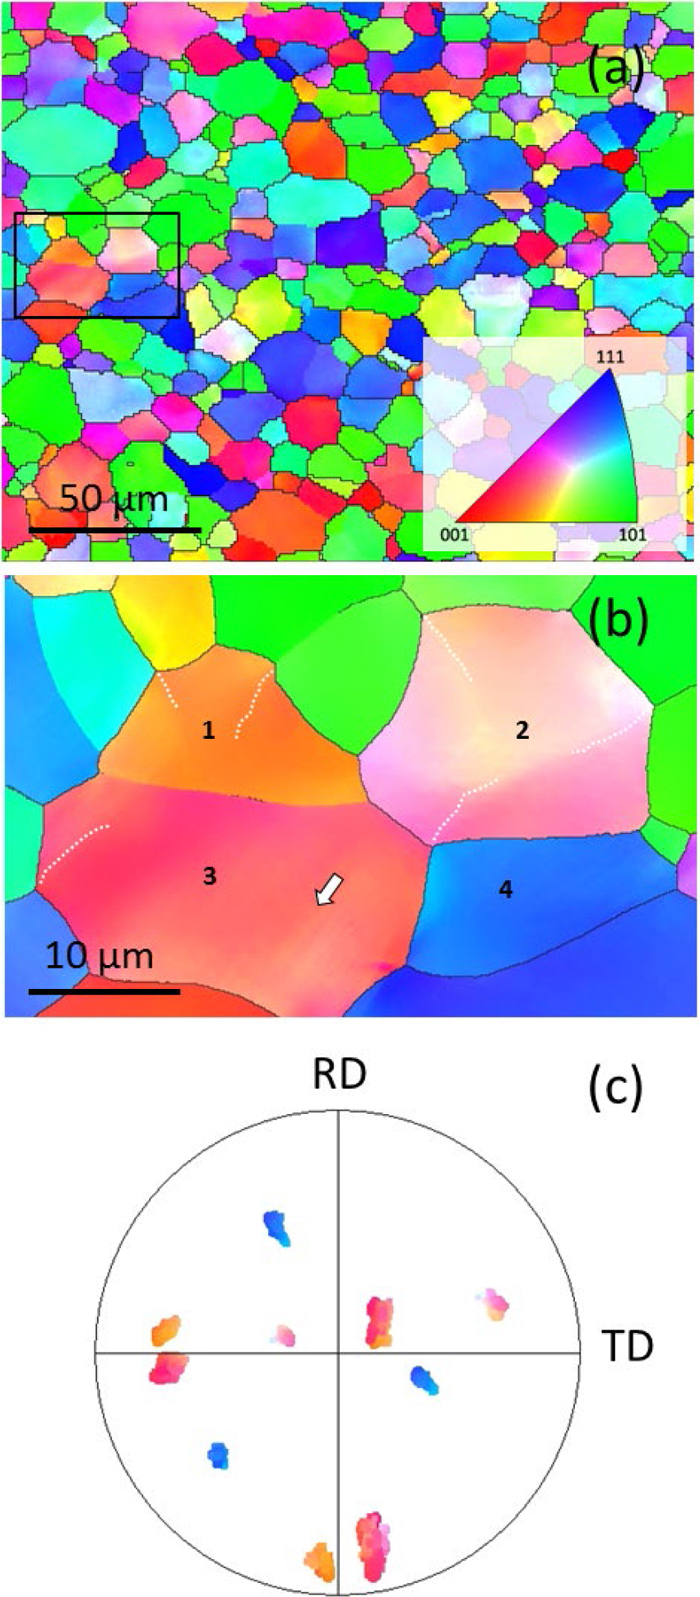
EBSD measured (a) inverse pole figure colour coded orientation map on the TD section in the RD-rolled sample showing small orientation variation within the grains and (b) a high resolution orientation map of the rectangular area in Fig. 2(a) showing subtle orientation changes in grain interior and (c) corresponding <002> pole figure of 1, 2, 3 and 4 grains in Fig. 2(b) showing gradual spread of orientations. (Online version in color.)
Figure 3(a) shows a scanning transmission electron microscopy (STEM) image of a region including a triple junction in the as-received sample. The inhibiting particles are clearly visible at the grain boundaries and interiors. The particle composition measured by EDS (energy dispersive spectroscopy) shows the presence of both Mn and S (see the EDS spectrum along the linescan in Fig. 3(b)) as principal elements. Therefore, based on the literature, these inhibiting particle are most likely to be MnS. In the grain interior, a low density of isolated dislocations are present. After deformation, a higher density of dislocations are present in the grain interior, (see Figs. 3(c) and 3(d)). The dislocations form mesh (arrowed in Fig. 3(d)) and cell dislocation structures (arrowed in Fig. 3(c)). Briefly on these structures, the mesh structures are composed of irregular tangles of dislocations and in the cell structures, there are higher dislocation densities at the cell boundaries. The cell interiors are virtually dislocation-free. The dislocation density along the cell boundary also varies. A comprehensive description of these structural species are given elsewhere by Chen and Duggan.31) Chen et al.23) also conducted a systematic EBSD and TEM correlative study on these deformation structures and it was found that the cell boundaries only accommodate fractions of a degree in variation in orientation. In the mesh dislocation structures the orientation variations are even lower,23) and can only be measured over significant distances (~20 μm) across grain. These characteristics of mesh and cell structures resemble the structures exhibited in Fig. 3. These two structures contribute to the gradual orientation variations in the EBSD maps in Fig. 2.
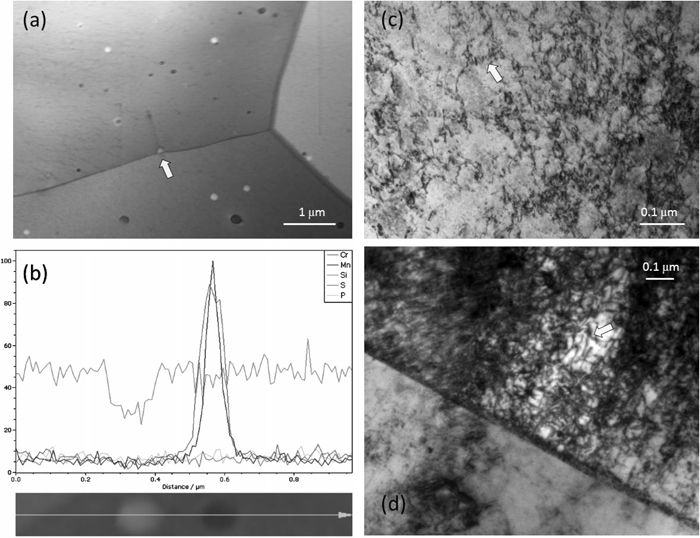
Deformation structures revealed by (a) a scanning transmission electron microscope (STEM) image of the as-received sample showing inhibiting parties at grain boundaries and grain interiors (b) corresponding EDS map of the arrow marked particle in Fig. 3(a), (c) Bright field TEM images of dislocation cell structures and (d) dislocation mesh structures.
Figure 4 shows bright field TEM images to provide further detail into the grain boundary structures in the RD and TD rolled samples. Figures 4(a)–4(d) show clear projections of inclined grain boundaries, but the boundaries remain unaffected from the interactions of deformation-induced internal dislocation structures. Also, in these figures, individual dislocations are visible protruding from the original grain boundaries. In Fig. 4(b) the grain boundary projection is slightly visible with a periodic array of dislocations (arrowed), which is a characteristic of a stable low energy configurations that still prevails after deformation. It should be noted that due to the magnetic nature of the sample it is difficult to obtain higher resolution images. The strain field created by the individual dislocations appear with black lattice contrast and are arrowed in the TEM images in Figs. 4(a), 4(c) and 4(d). From this, it is clear that with a small amount of deformation no significant change in the boundary structures is found. The MnS particles that were found in the grain boundaries in the undeformed sample remain at the grain boundaries (Fig. 4(e)). The corresponding EDS spectrum again shows that these particles contain Mn and S.
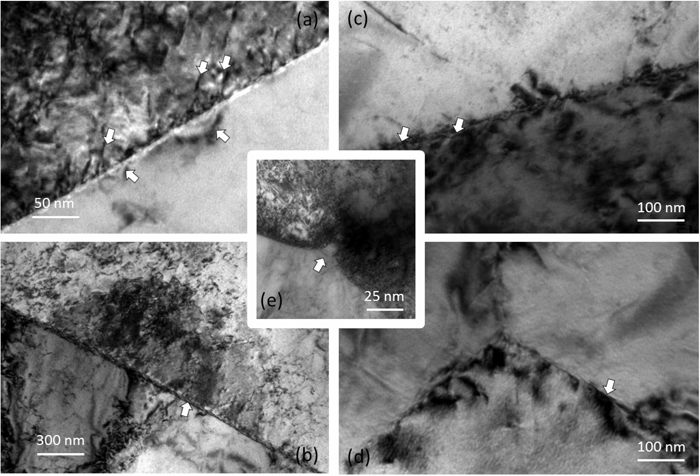
Bright field TEM images of the grain boundary deformation structures of RD- and TD-rolled samples showing braking away of dislocations from the grain boundaries, dislocation strain fields and presence of inhibiting precipitates.
To investigate the effects of the aforementioned deformation structures on the recrystallization textures the as-received and deformed samples were subjected to isothermal annealing at either 800 or 900°C temperatures for either 10 or 60 minutes. It should be noted that the strongest Goss texture, in terms of sharpness and intensity, was formed by slow heating rate annealing to 900°C. This is described elsewhere.32) In this experiment, the same material and annealing conditions were adopted and the texture characterization was performed by EBSD. In Fig. 5(a) series of representative orientation maps are shown. It becomes clear in Figs. 5(a)–5(c) that no secondary grain growth takes place in the as-received sample after 10 minutes of annealing at 800°C. Whereas, large recrystallized grains are formed in the equivalent RD- and TD-rolled samples. In these maps the Goss oriented grains, within 15° of spread, are plotted in pink, and clearly Goss is not the dominant orientation in the RD- and TD- rolled samples following the recrystallization anneal. When the samples are annealed at 900°C Goss started growing in the as-received sample (see the pink grains in Figs. 5(d) and 5(g)), whereas the grown grains in the RD- and TD- rolled samples are not primarily Goss oriented.
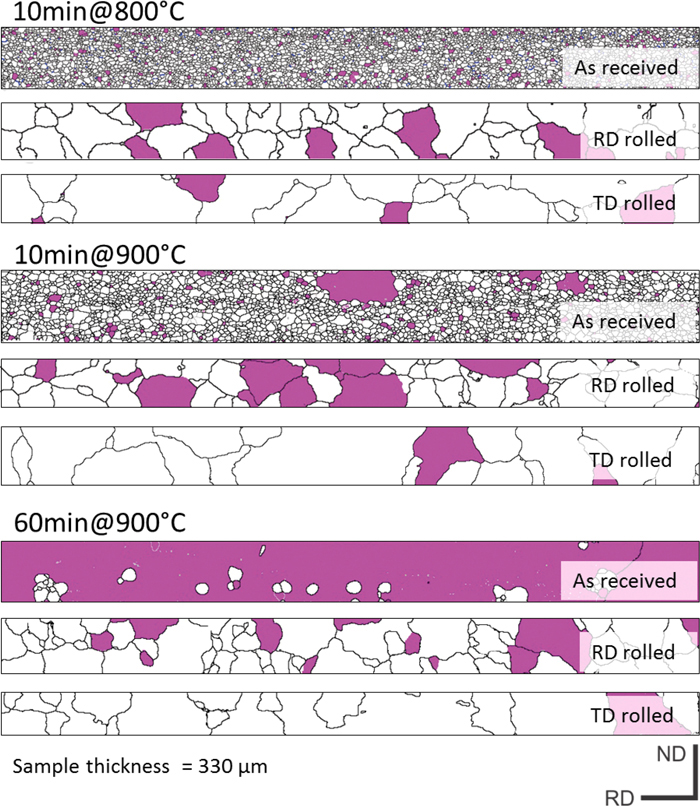
Series of EBSD measured orientation maps in the TD cross-section showing grain growth after different annealing conditions in the as-received, RD rolled and TD rolled samples. (Online version in color.)
Large area EBSD scans were conducted by merging as many as 79 separate scans to obtain statistically validated texture data. Each scan covers the entire sample thickness and is ~3000 μm in length along the sample length in RD. One data per grain is presented in the <002> pole figures in Figs. 6(a)–6(j) in order to avoid artifacts from the wide differences in the grain sizes. As predicted from the EBSD maps presented in Fig. 5, that the as-received sample produces a sharp Goss texture in the abnormally grown grains, and this is evident in Fig. 6(c). In contrast, it is clear that rolling does not alter the deformation textures (compare figures in 1(d)–1(f)), but there is a large difference in annealing texture.
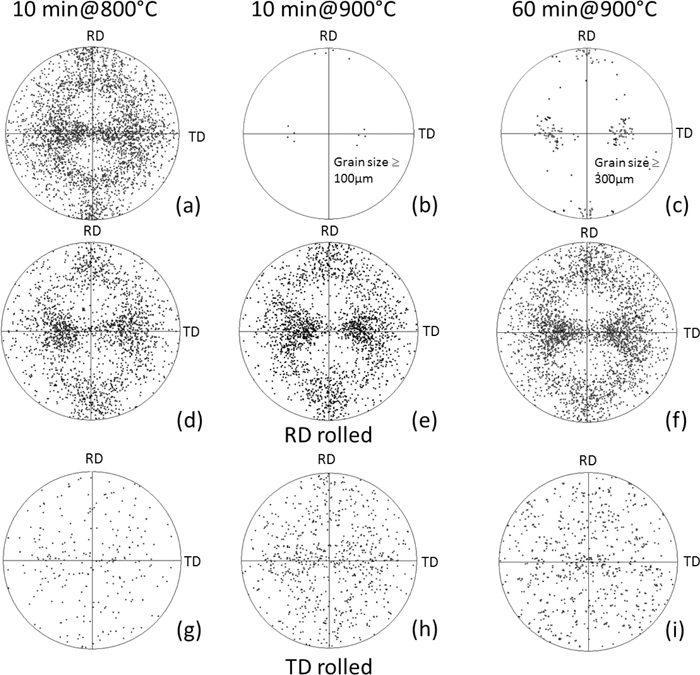
EBSD measured <002> pole figures showing the annealing textures corresponding the maps in Fig. 5, one orientation per grains is plotted in these pole figures.
It is evident in the <200> pole figures in Fig. 1 that small rolling reductions (10%) do not change the texture. This finding is consistent with other experimental and simulation data in the literature that shows negligible texture developments during the early stages of rolling deformation. The original grain boundaries in these Figs. 1(a)–1(c), represented by the black lines, remain unaltered (compare deformed and undeformed orientation maps), and this phenomenon indicates a negligible change in the overall grain boundary morphology. However, small angle features of a fraction of a degree in magnitude form in the grain interiors with the applied 10% deformation.23) From Fig. 1 it is also obvious that the spatial distribution of textures is not homogeneous along the sample thickness. Instead, the η-fibre and γ-fibre grains dominate in the subsurface and mid-thickness regions, respectively. It is pertinent to note that the Goss orientation sits in the middle of the η-fibre spread (marked in Fig. 1(f)). In the literature it has been shown that Σ9 boundaries24,25) are dominant around Goss grains when their neighbouring grains exhibit the {111}<112>, {411}<148> and {778}<447> orientations. Therefore, Σ9 boundaries are plotted in blue with a 5° orientation spread according to the Brandon criterion.26) No spatial preference for those boundaries was found. Overall, the grains are, in effect, equiaxed with only a slight elongation along the original rolling direction. This is a typical characteristic of the recrystallized rolled products. The change in grain aspect ratio with deformation is negligible (compare Figs. 1(a) with 1(b) and 1(c)).
The sharper colour variation traces in Fig. 2(b) (white dotted outlines) are connected with the grain boundary triple junctions and, therefore, are considered to have originated from strain incompatibilities amongst those grains sharing a given triple junction point. Overall, these original grain boundaries remain intact without having any obvious interactions with the grain interior features. The orientation variation (presented by the gradual colour variations) is as high as 22° across the grain width (see in grains 1, 2, 3 and 4 in Fig. 2(c)). However, the orientation difference between two neighbouring points is < 0.4°. It has been demonstrated by correlative microscopy of TEM and EBSD that such gradual orientation changes (e.g. in Fig. 2(b)) are normally accommodated by mesh and/or cellular structures of dislocations.23) The diffused stripe like structures (marked by the white arrow in grain 3) are evidence of the presence of microbands at their very initial stage of formation. Briefly on microbands, they exist as a parallel wall of dislocations and appear as gray scale strips in the SEM cross-sectional images. However, microbands at this low level of deformation are unlikely to evolve, since it has been demonstrated that microbands start forming only after rolling reductions of much more than 10% and then become common when deformation reaches rolling reductions of 20–50%.23,27) Also, the misorientation across these lines are less than 0.8° and therefore these features are not considered to be microbands, because typical microbands accommodate misorientations of at least few degrees28,29) which in some exceptional cases can be as high as ~18°.30)
It is obvious from the STEM and TEM images, in Figs. 3 and 4, that the MnS particles provide the pinning effect to the boundaries, and therefore, the growth takes place after their dissolution at 900–1000°C temperatures. With the small amount of deformations applied in this investigation, the dislocations at the original grain boundaries are still intact. Grain boundary dislocations will start to dissociate at higher deformations (>30% rolling reductions), and therefore, at lower strains it is almost impossible to identify individual dislocations. The TEM images in Fig. 4, at grain boundary regions, show some individual dislocations to start dissociating from the original grain boundaries, and this is the maximum effect that was noticed from the applied strain. The MnS particles still remains at the boundary and provide the expected pinning forces (see in Fig. 4). In conclusion, a small amount of deformation prior to annealing does not make significant differences in the grain boundary architecture, and deformation only generates cell and mesh dislocation structures that are composed of random distributions of statistically stored dislocations.
The findings in Fig. 5 indicate that recrystallization in the 10% rolled sample is instigated from deformation structures rather than from dissolution of the inhibiting particles that were present at the grain boundaries (see TEM images in Figs. 3(a) and 4(e)) that require higher temperature annealing for dissolution. Figure 5 also show that after annealing the grains in the TD-rolled sample are larger than the RD-rolled sample (compare the corresponding EBSD maps in Fig. 5). This indicates a faster growth kinetic in the TD-rolled sample and more frequent recrystallization in the RD-rolled sample. Also, the secondary recrystallized grains in the as-received samples are much larger than in the deformed samples (compare maps presented in Fig. 5). Another phenomenological difference between the deformed and undeformed samples is that the undeformed sample exhibits many island grains inside the secondary grown grains, but these are absent in the deformed sample. Pertinent to this, island grains are believed to form due to orientation pinning between certain orientations due to the reduced boundary mobility between them. As such, the island grains in this material do not have a specific orientation relationship with the surrounding Goss grains as demonstrated by Citrawati et al. in a complementary manuscript.32)
Figure 5 shows distinctively different recrystallization textures in the undeformed, RD-deformed and TD-deformed sample. The undeformed sample produces Goss texture from the particle dissolution, whereas, the textures in the deformed samples are influenced by the deformation structures. It has been previously shown that recrystallization in slightly deformed samples, like the present case, occurs by migration of existing grain boundaries, since in-grain recrystallization is not possible due to the lack of high angle boundaries that typically start forming in deformed regions when rolling exceeds 50% reductions.33) In the literature, two such common high angle features are characterized as shear and/or deformation bands.33,34,35,36) In such features, two fundamental characteristics that are required for instigating recrystallization were found to be present, such as a high angle mobile boundary and a difference in stored energy. Taking the latter factor into account, if certain orientations possess a lower stored energy in the deformation and recovery stages then these orientations dominate among the recrystallized grains. This texture formation mechanism is known as orientated recrystallization (OG) theory.37) In contrast, if recrystallization occurs with random selection of orientation then the texture becomes random.
In the deformed samples, recrystallization commenced at a random selection of grain boundaries, as a result, no sharp recrystallization texture forms. For instance, in the RD-rolled sample recrystallization takes place with all the orientations that are present in the deformation texture. This indicates that there is a random selection of grains from the γ- and η- fibre and growth occurs by moving existing grain boundaries by strain induced grain boundary migration (SIBM). It should be noted that an essential requirement of the SIBM mechanism is a difference in stored energy across the moving boundary. However, after small levels of deformation the grain interior structures become inhomogeneous, and the deformation mode varies between local regions within a given grain. This means that the stored energy, which is largely representative of dislocation structures, is non-uniform in a slightly deformed grain although the grain orientation is almost uniform. It is pertinent to note that, after 50% deformation the deformation structure in a given grain becomes uniform and a systematic orientation dependent stored energy become established. Therefore, although SIBM in highly deformed sample takes place between grains due to the difference in stored energy, no such systematic orientation dependent growth by SIBM takes place in slightly deformed samples. Instead, the local variations in the stored energy, due to non-homogeneous structural distributions, leads to migration of a local segment by SIBM mechanisms. To date, no data on orientation dependent stored energy is available in the literature for lightly strained materials, in the 5–15% reduction range. It is relevant to note that orientation dependent stored energy data are available for heavily deformed samples.33)
In the TD-rolled sample, the grains other than the γ- and η- fibres orientations grow faster i.e. this is a scenario where the minor orientations grow and consume major orientations. Likewise, it is also unclear how the stored energy criteria are fulfilled i.e. how the grains other than γ- and η- possess a lower stored energy due to the change in rolling direction from RD to TD. Based on the TEM images, the cell and mesh structures determine the magnitude of the stored energy. Overall, the mesh structures contribute to a greater stored energy levels than the dislocation cells as has been demonstrated by Chen et al.23) in low carbon and micro-alloyed steels. It is pertinent to note that there is no difference in dislocation density between the cell and mesh structures, and therefore, the variations in stored energy arise from the arrangements of dislocations. The orientation dependency of cell and mesh formations are also unknown other than the fact that they form in grains, whereby many slip systems become active, and therefore non-planar slip is exhibited. In contrast, when deformation localizes on a small number of slip systems the dislocations experience limited glide, and therefore they participate in forming geometrically necessary structural features such as microbands, deformation bands and shear bands. These features are, thus, orientation dependent on the grain with respect to the applied stress coordinates of deformation, and contribute significantly to a higher stored energy in the grains.23) Since γ- and η-grains get consumed by the other grains it is possible that these high stored energy features form in the γ- and η- grains in the TD rolled sample (or at least at their very initial stage of formation). During recrystallization, an overall reduction of stored energy occurs by these grains consuming the cell and mesh structures forming grains which do not exhibit γ- and η-fibres. Further research is required to investigate such structural details, and it is beyond the scope of the current study.
A comparative deformation and recrystallization study on Fe-3.5% Si steel shows that the nature of the original grain boundaries, following primary recystallization, solely determines the abnormal growth of Goss grains during the secondary recrystallization at 900°C. When an undeformed sample, containing MnS inhibiting particles at grain boundaries, was subjected to a recrystallization anneal large Goss grains readily form, whereas when a lightly deformed sample was subjected to the same annealing conditions the texture developed is completely different, although the deformation itself was insufficient to generate any significant changes in the grain boundary structures. The recrystallization mechanism in the undeformed sample relies on the inhibiting particles and, as a result, recrystallization commences at higher temperatures (900°C). On the other hand, light deformation changes the recrystallization mechanism to be driven by the grain interior dislocation structures and, as a result, recrystallziation commences at lower temperatures. Although the deformation texture and microstructure are indentical with the change in rolling co-ordinates this yields pronounced differences in the recrystallization textures.
The authors are pleased to acknowledge the supports from Ausaid in the form of student scholarship through its 2013–2016 AAS Program and Research Center for Metallurgy and Material of Indonesian Institute of Sciences.