Regular Article
Development of Hot Metal Dephosphorization with Lime Powder Top Blowing: Part 1. Low Blowing Rate
2017 Volume 57 Issue 10 Pages 1751-1755
Details
2017 Volume 57 Issue 10 Pages 1751-1755
Phosphorus in steel is detrimental element for mechanical properties and dephosphorization treatment of hot iron is necessary to produce high-grade steel products. However, it is difficult to perform dephosphorization treatment to attain lower phosphorus content using CaO–SiO2–FeO flux without fluorite of which use is limited owing to stringent environmental regulations. In the present work, addition of ladle slag and lime powder top blowing method were applied in 2 t test converter to obtain the higher slag basicity. Obtained results are as follows:
(1) By simultaneously adopting lime powder top blowing and ladle slag addition, phosphorus content of hot iron decreased to 0.01 mass% under the condition of (CaO)/(SiO2)=2.
(2) By comparison of the results of the heats with and without ladle slag, the ratio of dephosphorization at hot spot by lime top blowing was estimated to be 35%.
(3) (FeO) content of CaO–FeO melt at hot spot was estimated 37% on a basis of oxygen flow rate except to be consumed for decarburization and lime feeding rate. CaO–FeO phase diagram shows that the melt is liquid at hot spot but solid in hot iron. It is suggested that low ratio of dephosphorization at hot spot is attributed to this result.
Phosphorus in steel adversely affects mechanical properties of steel and dephosphorization pretreatment at the stage of hot iron is inevitable to produce high-grade steel products. Many researches have been performed and reported on dephosphorization treatment using CaO–SiO2–FeO flux1,2,3,4,5) and fluorite was found to play an important role as an excellent slagging promotion agent. However, recent environmental regulations give some limitation to its use. It leads to difficulty in attaining a high dephosphorization ratio resulting from low basicity of slag.
Alumina, Al2O3, as a substitute of fluorite was proposed by Ban-ya et al.6) and the result was reported that the CaO–Al2O3–FetO flux has sufficient dephosphorization capability. One of the present authors confirmed the same results by carrying out hot iron dephosphorization experiments using the CaO–SiO2–FeO–Al2O3 flux at 2 kg crucible-type and 2 t converter-type tests and attained a high dephosphorization ratio under the condition that (CaO)/(SiO2) is 1.6–2.0 and (A2O3) is 5–10 mass%.7,8) However, increasing demands for high-grade steel with low phosphorus and stricter environmental circumstances require additional tools for both realizing more efficient dephosphorization and preventing increase of slag volume.
Therefore, the authors focused on powder top blowing method in which oxygen gas containing lime powder is blown on a hot iron surface during decarburization at BOF.9,10) Dephosphorization is promoted and the phosphorus content is decreased below 0.02 mass% at the initial stage because the powder at hot spot of high temperature is promoted to melt down and it results in facilitating dephosphorization reaction. In the method, the powder is supplied throughout the period of BOF blowing; therefore, the slag basicity is comparatively low at the initial stage. It is thought to be possible to increase slag basicity and decrease phosphorus content to the lower value by both blowing all the powder during hot iron pretreatment and using ladle slag as an alumina source. However, the powder blowing method has not been applied to hot iron pretreatment and the effect has not been clarified. Therefore, in the present study, top and bottom test converter experiments at a 2 t scale were carried out, and the obtained results were discussed to confirm the performance of powder top blowing method at hot iron pretreatment.
After the addition of the molten iron of 2 t followed by charging iron ore and ladle slag into the test converter, oxygen gas and lime powder of less than 0.15 mm of grain-size were blown on the melt surface through the top lance and rinsing time was set afterwards. Composition of hot iron was [C]=4.0–4.3 mass%, [Si]=0.08–0.3 mass%, [Mn]=0.3 mass% and [P]=0.10 mass%. Composition of ladle slag was (CaO)/(SiO2)=5.0, (T.Fe)=8 mass% and (Al2O3)=19 mass%. Amount of iron ore was 10 k/t. Amount of ladle slag was 17.3 k/t if used. Amount of lime powder was 8–13.5 k/t and determined so as for charged agents of basicity to be 2.0 in case of initial [Si]=0.3 mass%. Amount of lime powder was 10 k/t and determined so as for charged agents of basicity to be 4.7 in case of initial [Si]=0.08 mass%. Top oxygen blowing flow rate, QT, and bottom blowing flow rate, QB, were set to be 1.4 Nm3/(min·t) and 0.5 Nm3/(min·t), respectively. The timing chart of top blowing is shown in Fig. 1. Temperature was raised to the aimed value of 1613 K (1340°C) at the end of blowing. Temperature of hot iron was measured using sub-lance loaded with thermocouple probe during the experiments. The experimental conditions are shown in Table 1.

Time chart of top blowing of oxygen gas and lime powder.
| Heat | Ladle slag (k/t) | CaO powder (k/t) | initial [Si] (mass%) | Charged basicity (−) |
|---|---|---|---|---|
| A | – | 13.5 | 0.3 | 2.0 |
| B | 17.3 | 8.0 | 0.3 | 2.0 |
| C | – | 10.0 | 0.08 | 4.7 |
Time variation in temperature of hot iron is shown in Fig. 2. The temperature of each heat reached approximately 1613 K at the final stage of blowing. Time variation in [C] of hot iron is shown in Fig. 3. Reaction between iron ore and hot iron could form carbon monoxide or dioxide, however, reaction rate could be expected to be negligible because the iron ore cooled down the slag metal interface.

Time variation in temperature of hot iron.
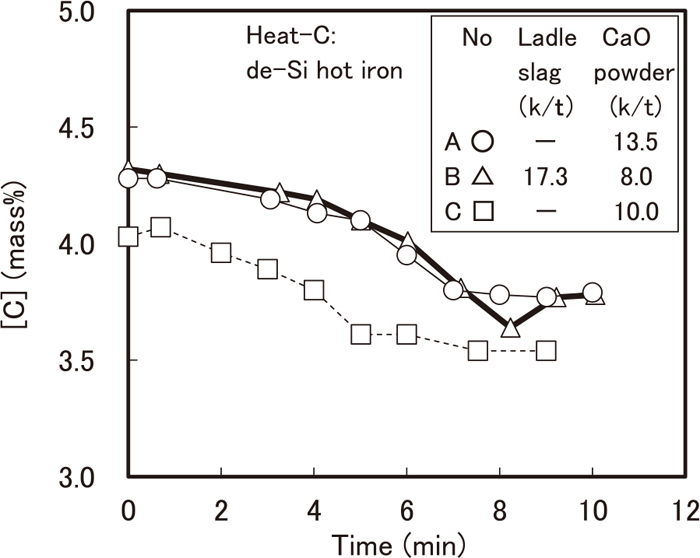
Time variation in carbon content of hot iron.
Decarburization rate at the initial stage of blowing was relatively low, but became higher after 4 min for Heat-A and Heat-B and 2 min for Heat-C, respectively. Time variation in [Si] of hot iron is shown in Fig. 4. Desiliconization time was around 4 min for Heat-A and Heat-B and 2 min for Heat-C, respectively. Both time corresponded to the time that decarburization rate changed. Time variation in [P] of hot iron is shown in Fig. 5. Phosphorus content decreased to 0.03, 0.01 and 0.04 mass% in Heat-A, Heat-B and Heat-C, respectively.

Time variation in silicon content of hot iron.

Time variation in phosphorus content of hot iron.
Time variation in slag basicity, (CaO)/(SiO2), is shown in Fig. 6. The slag basicity in Heat-A and Heat-B rose during blowing and reached around 2.0, which is equal to the basicity of charged agents. No slag data were available in Heat-C because slag forming did not occurred and slag sample could not be taken. The relation between the charged and observed (CaO)/(SiO2) is shown in Fig. 7. It is suggested that the ladle slag dissolved at the initial stage of blowing and scattering loss of lime powder supplied from the top lance were negligible small because both values are in good agreement.

Time variation in slag basicity, (CaO)/(SiO2).

Relation between charged and observed basicity of slag.
Time variation in (T.Fe) is shown in Fig. 8. (T.Fe) in Heat-A reached 15 mass% at 3 min and afterward decreased. (T.Fe) in Heat-B reached 27 mass% at 3 min and afterward decreased. Decrease rate of (T.Fe) in Heat-B was higher than that in Heat-A.

Time variation in (T.Fe).
The apparent equilibrium achievement degree in Heat-A and B was discussed based on the phosphorus distribution equation, Eq. (1), proposed by Suito et al.11) as shown in Fig. 9.
| (1) |

Relation between calculated and observed LP.
The observed (P)/[P] value was much lower than equilibrium (P)/[P] in Heat-A without ladle slag, whereas both values showed good agreement in Heat-B with ladle slag.
It is suggested that the lower melting point of slag resulting from high (T.Fe), in Heat-B, led to high fluidity and mass transfer rate of slag and the apparent equilibrium relation was maintained.
4.2. Comparison of Dephosphorization RateIn the present experiment, dephosphorization reaction sites are the hot spot and interface between top slag and hot iron. The total dephosphorization rate of both reaction sites can be expressed by Eq. (2). In the equation, t denotes time (min), K represents the rate constant of dephosphorization reaction (1/min), [P] represents phosphorus content in hot iron (mass%), and e denotes equilibrium and T and P represents hot spot and top slag, respectively.
| (2) |
Considering that equilibrium [P] is negligible small in each site, Eq. (2) can be replaced by Eq. (3).
| (3) |
The ratio of hot spot to the overall reaction rate, RT (%), can be expressed by Eq. (4).
| (4) |
In Heat-C, where lime powder was blown to desiliconized hot iron, the ratio of reaction rate in the hot spot, RT, was assumed to be 100% because the charged slag basicity as high as 4.7 caused solidification of top slag and dephosphorization in top slag was thought to be negligibly small. It is thought that dephosphorization reaction in Heat-C was controlled by FeO–CaO melt formed at hot spot. The apparent rate constant, KT, in Heat-C could be obtained as 0.163 (1/min) from the single logarithmic plot of [P] in Fig. 10. In Heat-B, where lime powder was blown to non-desiliconized hot iron, the combination of reaction rates, KT and KP, was assumed to be given because the charged slag basicity as low as 2.0 caused low melting point of top slag and dephosphorization in top slag could not be negligible. RT was calculated using Eq. (4) on a basis of (KT+KP) obtained from the plot in Heat-B in Fig. 10. The obtained results are approximately 35% as plotted in Fig. 11. No contribution of KT in the initial stage in Heat-B resulted from no powder blowing during that period.

Time variation in phosphorus content of hot iron.

Time variation in ratio of KT to KT+KP.
As mentioned above, it is suggested that the influence of hot spot on dephosphorization rate is not so strong. It is necessary to discuss the cause of small contribution of hot spot where top-blown particles contact with hot iron as well as reaction between top slag and hot iron. In the present section, the content of FeO–CaO melt at hot spot in the final stage of blowing is calculated on a basis of the following assumptions that (1) top blowing oxygen except for the portion consumed for decarburization forms FeO and (2) top blowing lime powder forms FeO–CaO melt. As a result, FeO content of the melt is calculated around 37% and plotted in Fig. 12 based on CaO–FeO binary phase diagram,12) considering the temperature of hot spot ranging from 2273 to 2573 K (from 2000 to 2300°C)13) and of hot iron around 1613 K(1340°C). The melt is thought to be liquid at hot spot, however, the temperature difference between hot spot and liquidus is small and the melt could easily solidify a little away from hot spot. It is suggested that the small difference of temperature could result in low contribution of hot spot on dephosphorization in the present experimental conditions. It also suggests that the contribution of hot spot could be enlarged under the condition of bigger difference of temperature between hot spot and liquidus. Therefore, it is predicted that the effect of lime top blowing method on dephosphorization could be improved by increasing the ratio of oxygen flow rate against lime powder feeding rate, controlling top and bottom blowing, and maintaining high (FeO) at hot spot.

Calculated content of (FeO) at hot spot.
Experiments on the lime powder top blowing method for the dephosphorization of hot iron were conducted using a 2 t test top and bottom blown converter. Results obtained are as follows:
(1) By simultaneously adopting lime powder top blowing and ladle slag addition, phosphorus content of hot iron decreased to 0.01 mass% under the condition of (CaO)/(SiO2)=2.
(2) Rate constant, K, of dephosphorization reaction in the final stage of top blowing was lower in the heat of de-siliconized hot iron where the ladle slag was not added and the only reaction at hot spot occurred. By comparison of the result of the heat with ladle slag, the ratio of dephosphorization at hot spot by lime top blowing was estimated to be 35%.
(3) (FeO) content of CaO–FeO melt at hot spot was estimated 37% on a basis of oxygen flow rate except to be consumed for decarburization and lime feeding rate. CaO–FeO phase diagram shows that the melt is liquid at hot spot but solid in hot iron. It is suggested that low ratio of dephosphorization at hot spot is attributed to this fact.
(4) It is predicted that the effect of lime top blowing method on dephosphorization could be improved by increasing the ratio of oxygen flow rate against lime powder feeding rate, controlling top and bottom blowing, and maintaining high (FeO) at hot spot.