Abstract
We found the correlation between low temperature toughness of the weld seam and the echo level from a scattered-type penetrator consisting of micro oxides in high frequency welding pipes. Conventionally, the low temperature toughness is evaluated by Charpy impact test. The factors that affect the quality of the weld seam were investigated by using an ultrasonic C-scan with a focused probe and samples sliced from the weld seam. As a result, it was found a scattered-type penetrator consisting of micro oxides is a key factor affecting low temperature toughness. Absorbed energy obtained by Charpy impact test can be evaluated by the ultrasonic echo amplitude with the optimized focused beam size (about 1 mm2) to detect the scattered-type penetrators.
1. Introduction
Recently, production of high frequency electric resistance welding (HFW) pipes has progressed rapidly, and application of HFW pipes to line pipe is becoming increasingly common. In addition to the welding technology itself, quality assurance of the weld seam of the HFW pipe is very important for application to line pipe as a substitute for UOE pipes or seamless pipes.1,2,3,4)
The mechanical test and flattening test are applied to quality assurance of mechanical properties. The Charpy impact test is used to evaluate low temperature toughness, but that test is a sampling inspection and requires destructive testing.
It has been pointed out that there is a correlation between the area of a penetrator in the ductile fracture area in the cross section of the Charpy impact test piece and the transition temperature.5,6,7) A penetrator is an oxide generated during HFW. Ordinary penetrators are elliptical in shape and about 0.2 mm to 5 mm in size. It is possible to detect penetrators of mm order size by the conventional ultrasonic test. However, as a result of progress in HFW steel pipe manufacturing techniques, penetrators of mm order size are now rare. The present problem in manufacturing HFW steel pipe is control of very micro scale penetrators.
In order to investigate the form of micro scale penetrators that influence the results of the Charpy test, analysis and observation of the micro scale penetrators in the fracture surface has been carried out using the scanning electron microscope6,7) and the distribution or density of micro scale penetrators. In a report by Tagawa et al., it was inferred that the density (or distribution) of iron-based micro penetrators influence absorbed energy.7) However, there is not the direct evidence supporting this conjecture, and it is difficult to investigate the density of the micro scale penetrators that influence absorbed energy by conventional analytical methods using the scanning electron microscope.
In this paper, the distributions of micro penetrators that affect low temperature toughness are clarified, and an evaluation technique for the low temperature toughness of the weld seam by ultrasonic testing is described.
2. Research on Form of Oxides that Affect Low Temprature Toughness
2.1. Investigation Method
First, the authors investigated the relationship between micro penetrators and low temperature toughness using an ultrasonic C-scan test with a focused probe and samples sliced from the weld seam in order to clarify the size and form of penetrators that affect low temperature toughness. Figure 1 shows the investigation method. In this investigation, the relationship between low temperature toughness and the distribution of micro penetrators was examined. The low temperature toughness was investigated by the Charpy impact test, and the distribution of micro penetrators was investigated by the ultrasonic C-scan test.

The ultrasonic C-scan test is a two-dimensional echo-intensity map. Figure 1 shows the positional relationship of the ultrasonic C-scan test and the inspected part. Table 1 shows the condition of the ultrasonic C-scan test. The ultrasonic C-scan test employs high frequency point focus probes to detect micro defects. The point focus probes were two types that have the different ultrasonic beam widths. Before the ultrasonic testing, the detection sensitivity of C-scan test was calibrated by the echo from the bottom of steel plate that has same thickness as focus position. Specifically, the echo amplitudes of both conditions described in Table 1 was adjusted to obtain the almost same detection sensitivity based on the amplitude of bottom echo. The nominal frequency of both point focus probes was 50 MHz. The operational frequency in the case of Item1 was 50 MHz, and, the other case was 40 MHz. As the test material, X65 sample pipes with an outside diameter of 323.1 mm and wall thickness of 11.1 mm were used in this study. The sample pipes (Sample A and Sample B) were manufactured under varied welding conditions. In order to examine the relationship between low temperature toughness and the distribution of micro penetrators, the two coupons were cut from same pipe. One coupon is a test piece for investigating the distribution of micro penetrators. The other is a test piece for investigating the low temperature toughness.
Table 1. Condition of ultrasonic C-scan test.
| Item | Condition of ultrasonic C-scan |
|---|
| 1 | Probe type: Point focus probe |
| Operation frequency: 50 MHz |
| O.D. of vibrator: 3 mm |
| Focus distance: 10 mm |
| Beam size: about 100 μm |
| d: 2 mm |
| 2 | Probe type: Point focus probe |
| Operation frequency: 40 MHz |
| O.D. of vibrator: 6 mm |
| Focus distance: 40 mm |
| Beam size: about 250 μm |
| d: 4 mm |
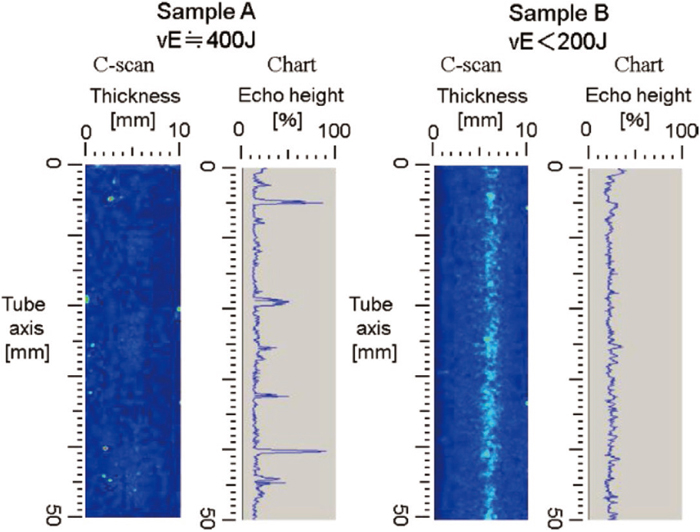
Figure 2 shows the results of the Charpy impact test of the test pieces cut from the sample pipes. The results of the Charpy impact test showed that sample A had average absorbed energy of more than 400 J, indicating good mechanical properties equivalent to those of the base material. The average absorbed energy of sample B was around 200 J or less. Figure 3 shows the echo level maps obtained in an ultrasonic C-scan test using a point focus probe with an ultrasonic beam having a diameter of 100 μm. The low temperature toughness of sample A was good. Nevertheless, sample A displayed many point-like ultrasonic indications. Based on the ultrasonic echo level, those ultrasonic indications were estimated approximately 100 μm in diameter. On the other hand, penetrators of this type were not observed in sample B, which showed lower absorbed energy than sample A. This indicates that penetrators of this size do not influence absorbed energy, and suggests the possibility that other factors influence absorbed energy. Figure 4 shows the echo level maps obtained in an ultrasonic C-scan test using a point focus probe with an ultrasonic beam diameter of 250 μm. In this case, Sample B was observed to have a continuous wispy pattern in the center of thickness, and sample A did not display the pattern. Therefore, it is assumed that the cause of ultrasonic indications like this wispy pattern is also a factor that affects absorbed energy.

The observation of the cross-sectional surface of sample B by scanning electron microscope revealed the existence of sparsely distributed micro Si-Mn oxides (micro penetrators), each with a size ranging from 3 μm to 19 μm, as shown in Fig. 5. These sparsely distributed micro Si-Mn oxides are termed “Scattered-type penetrator.” There is the scattered-type penetrator in circumferential narrow part because grooved surface is pressed under the strong pressure. Therefore, the scattered type penetrator has the shape as planar in circumferential direction.
3. Discussion
We have a finding that the low temperature toughness is affected by the scattered type penetrator as described in the chapter 2. The reflection characteristics of distributed defects on the plane is not discussed in the past. So, we think about the reflection characteristics in that case.
The ultrasonic reflection from the scattered-type penetrator was modeled as shown in Fig. 6 because the scattered type penetrator was in circumferential narrow area as described above. In the ultrasonic reflection model, as shown in Fig. 6, it is assumed that the distribution of micro-reflectors is uniform and ultrasound is reflected from the area of the ultrasonic beam. Generally, it was known that the reflected sound pressure from a circular planar defect is expressed by the following Eq. (1).8)
|
P
R
=
P
i
⋅
d
2
π
4λF
| (1) |
PR: Reflected sound pressure from circular planar defect
Pi: Incident sound pressure on circular planar defect
d: Diameter of circular planar defect
λ: Wavelength
F: Focus distance
If the diameter of circular planar defect is equal to the ultrasonic beam width in focus position, the reflected sound pressure from it is expressed by the following Eq. (2).
|
P
R
=
P
i
⋅
d
w
2
π
4λF
| (2) |
dw: Diameter of ultrasonic beam
Assuming the micro-reflectors are uniformly distributed, it thought that the amplitude of reflection is proportional to the area of the ultrasonic beam which is occupied by the total area of the micro-reflectors in the ultrasonic beam area. Therefore, when the reflected defect is the scattered-type penetrator as shown Fig. 6, the reflected sound pressure is expressed by the following Eq. (3).
|
P
R
=
P
i
⋅
d
w
2
π
4λF
⋅α
| (3) |
α: Area ratio of ultrasonic beam occupied by micro-reflectors
The coefficient α is the area ratio of the ultrasonic beam occupied by the micro-reflectors in Eq. (3), the coefficient α is described as shown in Eq. (4). And, Eq. (5) is derived from Eqs. (3) and (4).
|
α=
N⋅
(
d
r
2
)
2
π
(
d
w
2
)
2
π
=N⋅
(
d
r
d
w
)
2
| (4) |
N: Number of micro-reflectors in ultrasonic beam width
dr: Diameter of micro-reflectors
|
P
R
=
P
i
⋅
N
d
r
2
π
4λF
| (5) |
Equation (5) means that the reflected sound pressure is the sum of individual reflection from micro-reflectors. Based on Eq. (5), it can be understood that the amplitude of ultrasonic reflection increases in proportion to N and the square of dr. Additionally, the amplitude of ultrasonic reflection is inversely proportional to the focus distance. There is the relation as Eq. (6) between N and dr. That is, when the ultrasonic beam width is expanded, the number of micro-reflectors increases and the amplitude of ultrasonic reflection is enhanced. When number of micro-reflectors per unit area increases, the amplitude of ultrasonic reflection is enhanced similarly.
ρ: Number of micro-reflectors per unit area
In the case of experimental condition in chapter 2, the amplitude of the reflected sound pressure is influenced by the ultrasonic beam width and the focus distance because the each amplitude of both ultrasonic beams is calibrated to have a same sensitivity. The ultrasonic beam width is 100 μm in Item 1. The other case’s ultrasonic beam width is 250 μm. So, the effect of expansion of ultrasonic beam width is estimated as about +16 dB from the area rate for the both ultrasonic beam width. Also, the effect of focus distance is about −12 dB. These estimations are shown in Table 2. The amplitude in the case of Item 2 is 4 dB higher than Item 1. Therefore, it is considered that C-scan using the ultrasonic beam width of Item 2 obtained the clear image more than the other case.
Table 2. Estimation of effect of ultrasonic beam width and focus distance.
| Item | Effect of beam area | Effect of focus distance | Total |
|---|
| 1 | 0 dB | 0 dB | 0 dB |
| 2 | +16 dB | −12 dB | +4 dB |
In the case of detecting the single existing defect, generally, it is well known that the narrow ultrasonic beam is applied in inspection to detect the smaller defect. On the other hand, in the case of detecting the defects that are scattered on the plane, a clear distribution image is obtained by appropriately adjusting beam size and focus distance because the reflection wave from every defects scattered on the plane are gathered and ultrasonic sound pressure is enhanced.
4. Study of Method for Evaluating Low Temperature Toughness by Ultrasonic Test
Next, the relationship between the density of the scattered-type penetrator and the absorbed energy obtained by the Charpy impact test was investigated.
Charpy impact test pieces were cut from the portion inspected in the ultrasonic C-scan test, as shown in Fig. 7. Additionally, joints were welded to the test pieces so as not to affect the metal structure of the HFW weld seam in order to estimate absorbed energy by the Charpy impact test. A notch (2 mm) was made in the test pieces in the HFW welds, as shown in Fig. 7. The temperature of the Charpy impact test was −40°C. The ultrasonic C-scan test was performed using a point focus probe with a beam diameter of 440 μm and frequency of 20 MHz. The immersion method was used for acoustic coupling of the C-scan.

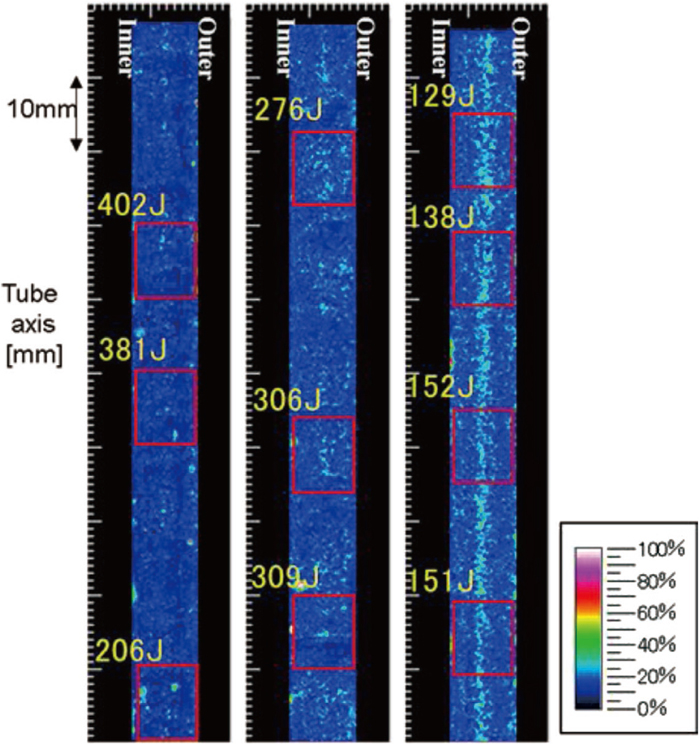
Figure 8 shows the results of the comparison of the ultrasonic echo height and absorbed energy. In this figure, the areas enclosed by the frames are the areas of the Charpy impact test. When the ultrasonic echo height and absorbed energy were compared, a relationship was found, in that absorbed energy decreased when the ultrasonic echo height in the area of the Charpy impact test increased.
However, close observation showed that absorbed energy does not have a relationship with the greatest value of the ultrasonic echo height in the area of the Charpy impact test, but rather, displays a relationship with the total value of the ultrasonic echo height in the area of the Charpy impact test. Therefore, we compared the absorbed energy and the feature value of the C-scan map of the area in Charpy impact test. The concrete method for calculating the feature value from the C-scan map is outlined below.
(A) Calculation of average value in the given area.
(B) Calculation of peak value for wall thickness direction using the value obtained by (A).
(C) Calculation of average value for the pipe axis in the range of the Charpy impact test using the value obtained by (B).
In this time, four conditions were calculated based on the above procedure. Specifically, the case of the average area is 8 mm×8 mm (Case 1) , the case of the average area is 2 mm×2 mm (Case 2), the case of the average area is 1 mm×1 mm (Case 3), the case of the average area is not (Case 4), as shown Fig. 9. Each case is calculated based on the below equations. Case 1 was calculated based on Eq. (5), Case 2 was calculated based on Eq. (6), Case 3 was calculated based on Eq. (7), Case 4 was calculated based on Eq. (8).
|
EH=
∫
0
8
∫
0
8
R(x,y)dxdy
| (5) |
|
EH=
∫
0
8
[
max
y=0
8
(
∫
0
2
∫
0
2
R(x,y)dxdy
)
]
dx
| (6) |
|
EH=
∫
0
8
[
max
y=0
8
(
∫
0
1
∫
0
1
R(x,y)dxdy
)
]
dx
| (7) |
|
EH=
∫
0
8
[
max
y=0
8
(
R(x,y)
)
]
dx
| (8) |
R(x,y): Amplitude of C-scan map.
EH: Feature value
Here, calculation of the average value in the given area is equivalent to an inspection using an ultrasonic beam having the same area. In other words, if the given area is 2 mm, the calculation is equivalent to an inspection using an ultrasonic beam width of 2 mm.
As a result of the comparison between the absorbed energy and feature value, it was found that absorbed energy can be estimated by using the feature value of the C-scan map under the conditions of the calculation of the appropriate feature value.
Figure 10 shows the results of a comparison of the absorbed energy and the feature value of the C-scan map for four different averaging ranges. Under different conditions of the averaging range for the calculation of the feature value, the variations in the plotted data and the gradients of the linear approximate expression obtained by the least square method were different.

When the averaging range is 8 mm, the variations of the plotted data are small and the gradient of the linear approximate expression is large. Under the other conditions, the gradient of the linear approximate expression is larger than that in case of the 8 mm averaging range. It preferable that the gradient of the linear approximate expression is small, because, if the gradient is large, a small change in the feature value will affect the estimation accuracy of toughness. By reducing the size of the averaging area, it is easy to estimate absorbed energy from the feature value of the ultrasonic echo height of the C-scan map. However, if the size of the averaging area is too small, the variation of the plotted data will be large. When the size of the averaging range is 1 mm, the gradient of the linear approximate expression is the smallest and the variation of the plotted data is also small.
5. Conclusion
The correlation between the low temperature toughness of the weld seam of high frequency welding (HFW) pipes and ultrasonic reflection from the scattered-type penetrator was founded.
At the beginning of the study, the factors that affect the quality of the weld seam were investigated by using an ultrasonic C-scan method with a focused probe and samples sliced from the weld seam. The results revealed that the scattered-type penetrator was a key factor affecting the quality of the weld seam. Although the size of the individual oxides was a few micro meter and thus was negligibly small, a high density of oxides affects the low temperature toughness of the weld seam. The absorbed energy of the Charpy impact test can be evaluated by the ultrasonic echo amplitude with the optimized focused beam size. The optimum beam size was evaluated as being approximately 1 mm2.
References
- 1) H. Nakata, C. Kami and N. Matsuo: JFE Giho, 17 (2007), 37.
- 2) T. Koide, H. Kondo and S. Itadani: JFE Giho, 9 (2005), 25.
- 3) H. Yokoyama, T. Okabe, S. Toyota, H. Kimura, M. Suzuki and M. Egi: CAMP-ISIJ, 23 (2010), 252, CD-ROM.
- 4) Y. Matsui, Y. Iizuka, M. Suzuki, E. Urahata, T. Inoue, S. Kumazawa and M. Oka: Proc. 11th Int. Pipeline Conf., Canadian Energy Pipeline Association (CEPA), Calgary, Alberta, (2012), IPC2012-90213.
- 5) H. Haga, K. Aoki and M. Iino: Tetsu-to-Hagané, 64 (1978), No. 11, 449.
- 6) H. Haga, K. Aoki and T. Sato: Weld. J., 60 (1981), 104.
- 7) T. Tagawa, S. Yamamoto and T. Miyata: Tetsu-to-Hagané, 80 (1994), No. 4, 70.
- 8) Japanese Society for Non-Destructive Inspection: Ultrasonic Testing Level 3, The Japanese Society for Non-Destructive Inspection, Tokyo, (1989), 57.
- 9) K. Kimura: J. JSNDI, 27 (1978), 667.