Regular Article
Effect of Microstructural Features on Mechanical and Magnetic Properties of Austempered High-silicon Ductile Irons
2017 Volume 57 Issue 11 Pages 2049-2057
Details
2017 Volume 57 Issue 11 Pages 2049-2057
In this study, mechanical and magnetic properties of high silicon ductile irons (GJS 500-14- and GJS 600-10) with fully ferritic initial microstructures were investigated after being austempered at 270–390°C for 60 min. Results showed that hardness and strength as well as ductility are mainly controlled by morphologies and volume fractions of the phases in the austempered microstructures. More silicon in the chemical composition results in a significant decrement in ductility and toughness. For this reason, when high toughness is concerned, GJS 600-10 grade ductile iron containing more silicon should not be a preferred grade for austempering. In the view point of magnetic properties, saturation magnetization strongly depends on the austempering temperature, whereas remenance and coercivity are somewhat related to mean ferritic cell size and the solute atoms in the chemical composition.
Austempered ductile irons (ADIs) have remarkable properties such as high strength with good toughness, high wear resistance and fatigue strength owing to their ausferritic microstructures as compared to conventional ductile irons. Because of unique combinations of these properties, ADIs are preferred as an engineering material in many structural applications in the automotive and defense industries and in earth-moving machinery.1,2,3)
Ductile irons containing silicon in the range of 2.8–4.5 wt% can be categorized as high-silicon grades. Silicon, as a ferrite-forming element, encourages the formation of a fully ferritic microstructure in high silicon ductile irons, and decreases total shrinkage during solidification as well.4) On the other hand, silicon makes a solid solution by replacing iron in the lattice, contributes to lattice distortion and finally makes dislocation motion more difficult.
The mechanical properties of ADIs depend on microstructural features such as ferrite morphology, retained austenite volume fraction and the carbon content of the retained austenite. For example, lower ausferritic microstructure and higher carbon content in the retained austenite enhances fracture toughness, while optimum fracture toughness is obtained when retained austenite was around 25%.5) High fatigue strength, on the other hand, is attributed to low carbon content and high volume fraction of retained austenite due to possible transformation of low carbon retained austenite into martensite during straining.6)
The magnetic properties of materials strongly depend on their microstructure, chemical composition, and heat-treatment conditions.7) Especially, microstructural features such as dislocation density, grain size, and the presence of solute atoms and precipitates affect the motion of magnetic domain walls, which, in turn, affects the characteristic magnetic parameters such as coercivity, remanence, hysteresis loss, and saturation magnetization7,8) Renzetti et al. revealed that a decrease in coercivity was resulted from the grain size increment in ferritic–martensitic steel.9) Similarly, a theoretical work performed by Sablik et al. showed that there was a linear relationship between coercivity and the inverse of the grain size.10)
Investigations concerning austempered high-silicon ductile irons with fully ferritic microstructures are very limited.4) Also, there have been few studies on the magnetic properties of ADIs.11) In the present work, we therefore investigated the mechanical and magnetic properties of austempered high-silicon ductile irons by varying their silicon content, and these properties were correlated each other on a microstructural basis.
The chemical compositions and quantitative metallographic analyses of GJS 500-14- and GJS 600-10-grade high-silicon ductile irons used in the present work were given in Table 1. Samples 15 mm in diameter and 5 mm thick were cut from as-cast cylindrical bars. Optical micrographs of the as-cast samples, etched with 4 vol% nital, are presented in Figs. 1(a) and 1(b). The micrographs reveal that both the GJS 500-14- and GJS 600-10-grade ductile irons had fully ferritic microstructures with high-nodularity graphite distributed throughout the matrix.
| Sample | Chemical Composition (wt%) | Nodularity (%) | Nodule Count (mm−2) | Graphite Volume (%) | |||||
|---|---|---|---|---|---|---|---|---|---|
| C | Si | Mn | P | S | Mg | ||||
| GJS 500-14 | 3.3 | 3.7 | 0.3 | 0.029 | 0.008 | 0.04 | 94 | 215 | 8.6 |
| GJS 600-10 | 3.1 | 4.3 | 0.2 | 0.029 | 0.007 | 0.05 | 94 | 220 | 9.8 |

Optical micrographs of as-cast (a) GJS 500-14 and (b) GJS 600-10 samples.
A modified Fe–C phase diagram of the GJS 500-14- and GJS 600-10- grade ductile irons were plotted by using the chemical compositions of the samples through the thermodynamic database program FactSage. The calculation parameters were set as atmospheric air at a pressure of 1 atm.
2.3. Heat-treatmentThe samples were austenitized in an electrical furnace at 975°C for 120 min as immersed in cast iron chips to prevent decarburization. Following austenitizing, they were rapidly transferred to a salt bath containing Petrofer® AS135 commercial annealing salt in a stainless-steel container. Austempering was performed by holding the samples in the salt bath at predetermined temperatures of 270, 330, and 390°C for 60 min, followed by air cooling to room temperature. The temperature was monitored during the austenitizing and austempering steps by a Ni–NiCr thermocouple to ensure that the desired temperatures were maintained. Samples were designated as ADI-270, ADI-330, and ADI-390 according to their austempering temperatures.
2.4. Structural CharacterizationAn optical microscope (Leica DM 750M) was used to visualize the microstructures of the austempered samples, which were etched with 4 vol% nital. The quantitative and qualitative phase analyses of the samples were carried out by an X-ray diffractometer (XRD, GBC MMA-027) using Mo–Kα radiation. The accelerating voltage and applied current were 35 kV and 28.5 mA, respectively. The samples were scanned over 2θ angles of 25–45° in steps of 0.05° and at a scanning speed of 0.5° min−1. The acquired XRD patterns were then analyzed with XRD analysis software (X’pert HighScore Plus) to identify the peak positions. The direct comparison method12) was used to estimate the volume fractions of ferrite (Xα) and austenite (Xγ) utilizing the integrated intensities of the (2 0 0) and (2 2 0) planes of body-centered cubic (bcc) ferrite and the (2 2 0) and (3 1 1) planes of face-centered cubic (fcc) austenite. The carbon content of the austenite (Cγ, wt%) was determined through Eq. (1).
| (1) |
The lattice parameter of austenite (aγ, nm) in Eq. (1) was calculated by using the (2 2 0) and (3 1 1) planes of the austenite peaks. The mean ferritic cell size (d) as a measure of the mean free path of dislocation motion13) was estimated from the width of the (2 1 1) diffraction peaks of ferrite12) by using the Scherrer formula shown in Eq. (2).
| (2) |
Where d is the particle size, λ is the wavelength of radiation, β is the full width at half maximum intensity, and θ is the Bragg angle.
2.5. Hardness and Tensile TestsHardness measurements were carried out on a Brinell Hardness tester (Zwick/Roell ZHU 2.5) using a 187.5 kg load and a 2.5-mm-diameter tungsten ball as the indenter (HB30). The holding time at maximum load was 30 s. The tests were performed by making at least five indentations on each sample and averaging the results.
Duplicate tensile tests of the samples were performed by a servo-hydraulic test machine (MTS Landmark model 370.10) according to the ASTM E8/E8M standard and the average results are reported. All tests were made at a constant engineering strain rate of 0.005 min−1 at room temperature. The strain-hardening exponent (n) and strength coefficient (K) of the samples were determined by Holloman’s equation, shown in Eq. (3).
| (3) |
Where σ and ϵ are the true stress and true strain, respectively.
2.6. Vibrating Sample Magnetometer (VSM) MeasurementsThe samples were first cut to approximately 50 mg using a low-speed alumina disk. Magnetic measurements were carried out in a vibrating sample magnetometer (VSM) at room temperature up to the saturation magnetization; the time constant was 30 ms. The equipment was calibrated using a standard NIST nickel sample with a sensitivity of 10−5 emu. Magnetization measurements give the relation between the measured magnetization (M, emu/g) and applied magnetic field (H, Oe). The saturation magnetization (Ms), remanence (Mr), and coercivity (Hc) values of the samples were obtained from the M–H curves. The volume fraction of RA was determined from saturation magnetization values by Eq. (4).14)
| (4) |
Where
The modified Fe–C phase diagrams of the GJS 500-14- and GJS 600-10- grade ductile irons are shown in Figs. 2(a) and 2(b), respectively. The most obvious difference between them is the extent of the austenite region. It is clear that there is a relatively larger austenite region in GJS-500-14 (Fig. 2(a)) than in GJS-600-10 (Fig. 2(b)) where the silicon content was higher. Accordingly, carbon content of the GJS 500-14 sample can be expected to be slightly higher than GJS 600-10 sample after austenitizing.

Modified Fe–C phase diagrams for (a) GJS 500-14- and (b) GJS 600-10-grade ductile irons.
Optical micrographs of the austempered GJS 500-14 and GJS 600-10 samples are shown in Figs. 3(a)–3(f). At 270°C, the predominant microstructure was lower ausferrite, characterized by ferrite needles and RA. As the austempering temperature increased from 270 to 390°C, the ferrite needles thickened, exhibiting a feathery morphology, which is the characteristic appearance of ferrite in upper ausferritic structures. In terms of the second-stage reaction of austempering, no carbide precipitation was noticed in the microstructures, possibly due to the presence of higher amounts of silicon15) and relatively short austempering times.

Optical micrographs of austempered GJS 500-14- (a, c, e) and GJS 600-10- (b, d, f) grade ductile iron: (a, b) ADI-270, (c, d) ADI-330, and (e, f) ADI-390.
The XRD patterns of the austempered GJS 500-14 and GJS 600-10 samples are shown in Figs. 4(a) and 4(b), respectively. Ferrite and austenite peaks are clearly identified, but no carbide peaks were detected which is in agreement to the microstructural observations. As the austempering temperature increased from 270 to 390°C, the relative intensities of the ferrite peaks decreased, whereas those of the austenite peaks increased for both the GJS 500-14 and GJS 600-10 samples.

XRD patterns of austempered (a) GJS 500-14 and (b) GJS 600-10 samples.
Figures 5(a) and 5(b) show the effect of austempering temperature on the carbon content in austenite (Cγ) and the total austenite carbon content (XγCγ). They both increase as the austempering temperature increases because of faster rate of carbon diffusion at a higher austempering temperature.16) In the view point of ductile iron grade, GJS 500-14 samples have slightly higher austenite carbon content than GJS 600-10 samples. This is in agreement to FactSage predictions shown in Fig. 2 and can be attributed to more amount of silicon in GJS 600-10 sample.

Variation of carbon content in austenite (Cγ) and total austenite carbon content (XγCγ) with respect to austempering temperature for (a) GJS 500-14- and (b) GJS 600-10-grade ductile irons.
The effect of austempering temperature on the mean ferritic cell size (d) is presented in Figs. 6(a) and 6(b). The value of d increases accompanied by a corresponding coarsening of ferrite as the austempering temperature increases because of the lower nucleation rate and higher growth rate of ferrite at a higher austempering temperature.13)

Variation of mean ferritic cell size with respect to austempering temperature for (a) GJS 500-14- and (b) GJS 600-10-grade ductile irons.
The volume fraction of RA estimated by both XRD and VSM measurements (saturation magnetization values used to estimate volume fraction of the RA are given in Section 3.4) is shown in Figs. 7(a) and 7(b). Both techniques show similar trends in that the volume fraction of RA increases with increasing austempering temperature. The volume fraction of RA estimated by VSM measurement was higher than that estimated by XRD measurement at the same austempering temperature. This is mainly attributed to material-related features such as texture and grain size, as well as to the inherent limitations of the XRD technique.17) The present results are in good agreement with those reported by Jacques et al., who found that the saturation magnetization exhibited larger estimations of the RA content than XRD for TRIP steels.18)

Variation of retained austenite volume fraction with respect to austempering temperature for (a) GJS 500-14- and (b) GJS 600-10-grade ductile irons.
The mechanical properties of the as-cast and austempered GJS 500-14 and GJS 600-10 samples, which were determined by hardness and tensile tests, are presented in Table 2. It can be seen that the hardness and strength values are inversely proportional to ductility in general. Hardness, yield strength, and tensile strength all significantly decrease, whereas elongation at fracture increases with increasing austempering temperature for both ductile irons. Lower ausferritic structures produced by austempering at 270°C contained ferrite needles and RA, as shown in Figs. 3(a) and 3(b), which are responsible for the higher hardness and strength values due to the high dislocation density in ferrite.19) The ductility of such a microstructure is generally low because there is less RA (Fig. 7). In the ADI-330 samples, which were austempered at the mid-temperature in the present study, the ductility increased almost 100%, while the hardness and strength values were lower than those obtained at 270°C. As the austempering temperature increased to 390°C, the ferrite exhibited a feathery morphology, and the volume fraction of the RA correspondingly increased, as shown in Figs. 3(e)–3(f) and in Fig. 7. The mechanical properties exhibited by such a microstructure would include lower hardness and lower strength with increased ductility.20,21) The most diminished property at this temperature is the yield strength, with only a limited increase in ductility. This clearly indicates that increasing the austempering temperature to the upper ausferritic range for further improvement in ductility is not effective for high-silicon ductile irons.
| Mechanical Property | Ductile Iron Grade | As-cast samples | Austempered Samples | ||
|---|---|---|---|---|---|
| ADI-270 | ADI-330 | ADI-390 | |||
| Hardness (HB30) | GJS 500-14 | 225 | 477 | 406 | 365 |
| GJS 600-10 | 235 | 490 | 409 | 370 | |
| Yield Strength (MPa) | GJS 500-14 | 466 | 1165 | 1130 | 625 |
| GJS 600-10 | 522 | 1285 | 1110 | 665 | |
| Tensile Strength (MPa) | GJS 500-14 | 633 | 1635 | 1368 | 1096 |
| GJS 600-10 | 623 | 1662 | 1373 | 1161 | |
| Elongation at Fracture (%) | GJS 500-14 | 14.1 | 5.0 | 10.2 | 11.7 |
| GJS 600-10 | 16.0 | 3.7 | 6.3 | 8.3 | |
| Toughness* (10−3 J/mm3) | GJS 500-14 | 89 | 82 | 140 | 128 |
| GJS 600-10 | 100 | 62 | 87 | 96 | |
When toughness was taken as the product of tensile strength by elongation at fracture, it was seen that the maximum toughness values were exhibited by the ADI-330 sample of the GJS 500-14-grade ductile iron among all the samples investigated. In terms of chemical composition, on the other hand, it should be pointed out that increasing the silicon content from 3.7 wt% to 4.3 wt% resulted in a slight increase in the hardness and strength values but at the expense of a more obvious decrease in ductility. Even though both ductile irons are high-silicon grades, the presence of more silicon in the chemical composition results in a lower toughness owing to significantly decreasing ductility.
Figure 8 shows the variation of yield strength of the austempered ductile irons with respect to the inverse of the square root of the mean ferritic cell size. The figure clearly demonstrates that the yield strength increased with decreasing mean ferritic cell size as a general trend. As the mean ferritic cell size, also defined as the mean free path of dislocations, decreases, there would be more barriers to dislocation motion and thus hardness and strength would increase.13) On the other hand, when the samples are compared to each other at a given austempering temperature, it is seen that GJS-600-10 samples have a higher yield strength than that of GJS-500-14 samples for the austempering temperatures of 270°C and 390°C corresponding to lower and upper ausferritic microstructures, respectively. This is attributed to the solid solution hardening mechanism due to more silicon present in the chemical composition of GJS-600-10 samples. However, at the mid-austempering temperature (330°C), which combines the characteristic features of lower and upper ausferritic microstructures, yield strength was not correlated with higher silicon content and decreasing ferritic cell size. A somewhat similar linear relationship between tensile strength and hardness with R2 of 0.918 can be obtained by fitting a curve over data pairs through the origin, as shown in Fig. 9. The ratio of tensile strength to hardness on that plot varies in between 3.0–3.43, which increases with decreasing austempering temperature and has an average value of 3.31.
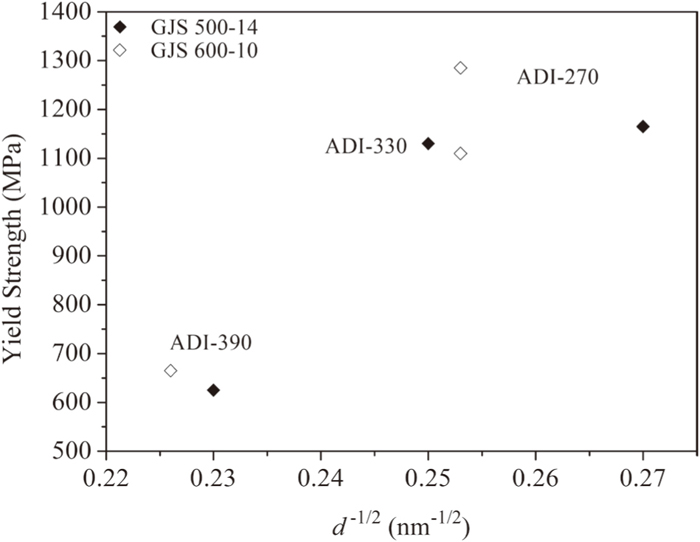
Variation of yield strength as a function of the inverse of the square root of the mean ferritic cell size (d) for all austempered samples.

Variation of tensile strength as a function of Brinell hardness.
Figures 10(a) and 10(b) show variations of the strain-hardening exponent (n) with respect to austempering temperature. The variations of elongation at fracture are also included in these figures for comparison. It should be first mentioned that the strain-hardening exponent of both grades of ductile iron is maximum at the lower austempering temperature (270°C). It then decreases to the minimum value at the mid-austempering temperature (330°C) and then increases again at the austempering temperature of 390°C.

Variation of strain-hardening exponent (n) and elongation at fracture with respect to austempering temperature for (a) GJS 500-14- and (b) GJS 600-10-grade ductile irons.
As shown in the present study, the volume fraction of ferrite is high at 270°C, whereas the volume fraction of RA is low. Because of the high dislocation density within the ferrite,19) interactions between dislocations and carbon atoms are prevalent depending on the high volume fraction of ferrite at the low austempering temperature. Therefore, the strain-hardening exponent values obtained at the low austempering temperature would be high as a result of these interactions. On the other hand, it is shown that the minimum value of the strain-hardening exponent corresponds to an elongation at fracture of approximately 10% for the GJS 500-14 samples and approximately 6% for the GJS 600-10 samples. This observation is consistent with that reported by Yang and Putatunda, who concluded that further increases in the strain-hardening exponent after exhibiting the minimum value was due to the transformation of RA into martensite.22) However, the approximately 6% elongation at fracture found for GJS 600-10 is lower than these values, suggesting that a different mechanism might be responsible for increasing the strain-hardening exponent at higher austempering temperatures for samples containing more silicon.23) It should also be mentioned that the ductile iron grades used in this study have higher amounts of silicon (3.7 wt% and 4.3 wt% for GJS 500-14 and 600-10, respectively) than that used in Ref. 22 (2.48 wt%), resulting in correspondingly higher strain-hardening values. This can be explained by the fact that more silicon reduces the stacking fault energy and contributes to strain hardening.24)
3.4. Magnetic PropertiesFigures 11(a) and 11(b) display the magnetization (M–H) curves of the as-cast (100% ferritic) and austempered samples. The saturation magnetization values of the GJS 500-14 samples were always higher than those of the GJS 600-10 samples. This is true for both the as-cast and austempered samples. Because alloying elements in the chemical composition are capable of decreasing the magnetic moment and consequently the saturation magnetization of iron,17) the difference between the saturation magnetization values of both ductile iron grades is attributed to the difference in their chemical composition.25) In a similar manner, Nakano and Kawano reported that as the silicon content increased in a ferrite-matrix ductile iron, the magnetic saturation value decreased.20) On the other hand, saturation magnetization reached a maximum value in the samples containing the highest amount of ferrite (i.e., those austempered at 270°C) and followed a decreasing trend with increasing temperature, as shown in Fig. 12. This can be explained by variations in the ferromagnetic (ferrite) and paramagnetic (austenite) phase volume fractions and confirms that the saturation magnetization increases as the ferromagnetic ferrite volume fraction increases.17)

Magnetization (M–H) curves of as-cast (100% ferritic) and (a) GJS 500-14 and (b) GJS 600-10 austempered samples.

Variation of saturation magnetizations with respect to austempering temperature.
Figures 13(a) and 13(b) show the variations of remanence (Mr) and mean ferritic cell size (d) with respect to austempering temperature. It is obvious that the remanence decreases whereas the mean ferritic cell size increases with increasing austempering temperature for the GJS 500-14 samples (Fig. 13(a)). This trend was also reported in studies on the magnetic behavior of supermartensitic stainless steels containing ferromagnetic and paramagnetic phases in different fractions.17) However, the opposite behavior exists for the GJS 600-10 samples, where both the remanence and the mean ferritic cell size increase with increasing austempering temperature (Fig. 13(b)). Figures 14(a) and 14(b) show the variation of coercivity (Hc) with austempering temperature. The variations of mean ferritic cell size and hardness are also included for comparison. Similar to the variation of remanence (in Fig. 13(a)), the coercivity of the GJS 500-14 samples exhibit an inverse relationship with mean ferritic cell size. These results show that remanence and coercivity are sensitive to microstructural features such as grain size and dislocation density. Because of the growth of the grains, the pinning effect of dislocations on magnetic domain wall movement decreases and thus the coercivity and the remanence decrease.9) On the other hand, it is clear that coercivity and hardness exhibited similar trends, decreasing with increasing austempering temperature for the GJS 500-14 samples. This is consistent with the results of Jiles et al., who found that the coercivity generally increased with increasing hardness in a plain carbon steel.26) In the GJS 600-10 samples, on the other hand, both the coercivity and the mean ferritic cell size increased as the austempering temperature increased (Fig. 14(b)), which is similar to the variation of remanence (Fig. 13(b)).

Variations of remanence (Mr) and the mean ferritic cell size (d) with respect to austempering temperature for (a) GJS 500-14- and (b) GJS 600-10-grade ductile irons.

Variation of coercivity, hardness, and mean ferritic cell size with austempering temperature for (a) GJS 500-14- and (b) GJS 600-10-grade ductile irons.
As shown in Figs. 13 and 14, for a given type of ductile irons, both coercivity and remanence exhibited the similar trend with respect to mean ferritic cell size. In contrast to their inverse relationship with mean ferritic cell size in GJS-500-14 samples, they both increase with increasing mean ferritic cell size in GJS-600-10 samples. Since increased coercivity and remanence are consequences of pinning the magnetic domain walls,27) this behavior is attributed to that more solute atoms (silicon) in the chemical composition of the GJS 600-10 sample can act pinning sites against domain wall motion,9) and play a more dominant role than the mean ferritic cell size in determining coercivity and remanence. This is especially effective at higher austempering temperature, where the density of dislocations in ferrite is expected to be lower and thus their pinning effect might be minimized.
Austempered high-silicon ductile irons varying in silicon content were investigated through microstructural, mechanical, and magnetic characterization tests, and the following conclusions were drawn:
(1) Both grades of high-silicon ductile iron with fully ferritic initial microstructures were successfully austempered to satisfy the minimum mechanical properties specified in BS EN 1564. The mechanical properties of the samples austempered at 270, 330, and 390°C met the requirements of grades 1400-1, 1200-3, and 900-8, respectively, in the standard.
(2) The presence of silicon in the GJS 600-10-grade ductile iron resulted in slightly higher hardness and strength as compared to the GJS 500-14-grade ductile iron but only at the expense of an obvious drop in ductility, which significantly decreases toughness. For this reason, GJS 600-10 should not be a preferred grade in the view point achieving optimum mechanical properties giving high toughness.
(3) Austempered high-silicon ductile iron with 3.7 wt% of silicon (GJS 500-14) exhibited more than two times higher strength than the as-cast iron while maintaining at least 10% ductility when austempered at 330°C. These results correspond to the optimum combination of strength and ductility in terms of the highest toughness obtained in the present study.
(4) The volume fraction of the RA estimated by VSM and XRD techniques exhibited similar trends with respect to austempering temperature. However, the VSM measurements produced higher values than those estimated by XRD measurements.
(5) The saturation magnetization decreased with increasing austempering temperature owing to the decreasing volume fraction of ferrite. Also, more silicon in the chemical composition of GJS 600-10 slightly reduced the saturation magnetization.
(6) Both coercivity and remanence had an inverse relationship with the mean ferritic cell size for GJS 500-14. However, they exhibited a linear relationship for the GJS 600-10-grade ductile irons.
Authors greatly acknowledge Dr. Baki ALTUNCEVAHIR from ITU Physics Engineering Department for his valuable support during magnetization measurements.