Regular Article
Effect of Iron Ore Concentrate on Sintering Properties
2017 Volume 57 Issue 11 Pages 1937-1946
Details
2017 Volume 57 Issue 11 Pages 1937-1946
According to sinter pot experiments, with increases in coarser commercial concentrates (mean size 0.1–0.3 mm) in iron ore blends, the productivity of sinter decreased 5–7% for each 10 mass% concentrate increased. With increases in finer commercial concentrates (mean size 0.02 mm) of 10–30 mass%, the productivity did not alter significantly. With an increase in 10–20 mass% micro-particle concentrate (mean size 0.01 mm) pulverized from the coarser commercial concentrate, the productivity increased 3–11%. The portion of −20 µm in iron ore concentrate favoured the granulation and the productivity in conventional sintering, but the portion of +45 µm had the reverse effects.
With increases in finer commercial concentrates (10–40 mass%) combined with low grade ore (10–20 mass%) in iron ore blends, the productivity also did not obviously change.
Compared with conventional sintering process, using the intensive mixer in an intensive mixing process or a separate granulation process could improve the productivity of sinter around 2 or 3% respectively.
Compared with conventional sinter feed, small-sized iron ore concentrate contains a lower alumina. Recently it is more popular to be applied in commercial sinter plants to decrease the alumina content in sinter or combined with a high alumina low grade ore to reduce the production cost of sintering.
However the productivity of sinter decreased with a decrease in the size of iron ore.1) Many studies2,3,4) demonstrated that an increase of concentrate in iron ore blend reduced the productivity in conventional sintering.
In this study, a number of commercial iron ore concentrates were tested in a sinter pot to find their sintering characteristics in conventional sintering. The intensive mixer was used in an intensive mixing process5) and a separate granulation process to study the improvement of sintering with the iron ore blend containing the concentrate.
A sintering apparatus consisting essentially of a 330 mm dia. × 700 mm height sinter pot was used to simulate industrial sintering. Table 1 gives information about the raw materials.
| Raw Materials | Chemical Composition (mass%) | Size Distribution (mass%) | ||||||||||||
|---|---|---|---|---|---|---|---|---|---|---|---|---|---|---|
| TFe | SiO2 | Al2O3 | FeO | MgO | Ig.loss | +0.5 mm | +0.25 mm | +0.105 mm | +0.045 mm | +0.020 mm | +0.010 mm | −0.010 mm | Mean size (mm) | |
| Con A | 65.9 | 4.6 | 0.2 | 8.9 | – | 0.1 | 9.7 | 30.5 | 40.5 | 15.8 | 1.4 | 0.6 | 1.5 | 0.306 |
| Con B | 67.1 | 2.5 | 0.4 | 0.2 | – | 0.9 | 0.1 | 1.2 | 17.9 | 44.9 | 25.5 | 5.8 | 4.6 | 0.079 |
| Con C | 66.8 | 1.5 | 0.4 | 1.2 | – | 2.7 | 0 | 0 | 0.1 | 15.7 | 32.0 | 25.1 | 27.1 | 0.024 |
| Con D | 67.1 | 2.7 | 0.7 | 0.2 | – | 0.7 | 0 | 0 | 0.1 | 16.2 | 35.8 | 30.2 | 17.7 | 0.025 |
| Con AA | 65.9 | 4.6 | 0.2 | 8.9 | – | 0.1 | 0 | 0 | 0.2 | 6.5 | 13.8 | 30.4 | 49.1 | 0.012 |
| TFe | SiO2 | Al2O3 | CaO | MgO | Ig.loss | +8 mm | +5 mm | +3 mm | +1 mm | +0.5 mm | +0.25 mm | −0.25 mm | ||
| Ore E | 56.7 | 5.0 | 2.8 | – | – | 10.4 | 9.5 | 16.4 | 15.7 | 29.9 | 13.1 | 7.9 | 7.6 | 3.3 |
| Ore F | 56.9 | 5.8 | 3.4 | – | – | 8.6 | 11.6 | 9.6 | 9.2 | 24.0 | 14.2 | 11.5 | 20.0 | 2.9 |
| Ore G | 57.7 | 4.9 | 1.5 | – | – | 10.4 | 17.4 | 13.9 | 12.8 | 30.1 | 12.9 | 6.6 | 6.3 | 4.0 |
| Ore H | 61.4 | 3.7 | 2.2 | – | – | 5.6 | 1.6 | 12.9 | 13.1 | 22.1 | 9.6 | 10.3 | 30.4 | 2.1 |
| Ore I | 64.9 | 2.7 | 1.3 | – | – | 2.2 | 11.5 | 9.4 | 9.8 | 27.4 | 16.1 | 10.8 | 15.0 | 2.9 |
| Ore J | 62.9 | 6.5 | 1.1 | – | – | 2.0 | 7.0 | 10.4 | 10.6 | 18.8 | 7.4 | 7.8 | 38.0 | 2.3 |
| Lump fine | 62.3 | 3.3 | 1.5 | – | – | 4.8 | 45.3 | 21.4 | 7.3 | 8.1 | 3.2 | 3.2 | 11.6 | 6.7 |
| Limestone | – | 0.3 | 0.1 | 54.4 | 1.1 | 43.5 | 0.3 | 6.9 | 17.1 | 33.8 | 12.2 | 8.5 | 21.2 | 1.9 |
| Dolomite | – | 0.5 | 0.2 | 33.9 | 18.2 | 46.4 | 0 | 2.7 | 17.2 | 36.0 | 16.1 | 13.0 | 15.0 | 1.8 |
| Serpentine | – | 38.7 | 1.1 | 2.0 | 37.2 | 10.7 | 0 | 0.2 | 1.4 | 61.6 | 18.5 | 9.4 | 8.9 | 1.5 |
| Burnt lime | – | 0.6 | 0.2 | 92.8 | 2.9 | 2.8 | 0 | 0 | 0.6 | 11.7 | 10.7 | 32.3 | 44.7 | 0.5 |
| Coke | 0.5 | 6.7 | 3.4 | 0.3 | 0.1 | 87.6 | 0 | 2.9 | 8.2 | 30.3 | 15.8 | 14.1 | 28.7 | 1.3 |
Con A to D: commercial concentrate; Con AA: pulverized from Con A; Ore E & F: low grade ore;
Ore G & H: Australian ore; Ore I & J: Brazilian ore
The sintering raw materials, including iron ores, fluxes, coke and return fines, were mixed and granulated. The moisture in the mix was controlled at a suitable level and made the mix look slightly wet. Various mixing and granulation conditions were applied to simulate the conventional process, the intensive mixing process,5) and the separate granulation process by using an intensive mixer (with a lower tip speed of mixing blades of 4 m/s) as a granulation equipment6) (as shown in Table 2). Samples were taken of the pseudo-particles generated by the drum and green pellets by the granulation of the intensive mixer to analyze the size distribution. Each 500 g sample was screened by a Gilson tapping 8in sieve shaker for 60 sec. with 10, 8, 6.3, 5, 3, 2, 1, 0.5, and 0.25 mm screens.
| Granulation procedures |
|---|
| Conventional process: (1) Raw materials (adding water) in a conventional mixer (1 min) for mixing. (2) The mix in a drum (4 min) for granulation. |
| Intensive mixing process: (1) Raw materials except return fine (adding water) in the intensive mixer (tip speed 8 m/s; 1 min) for mixing; and then charging return fine (adding water) in the intensive mixer (4 m/s; 10 sec.) for mixing. (2) The mix in a drum (3 min) for granulation. |
| Separate granulation process: (1) Raw materials except separated materials (adding water) in a conventional mixer (1 min) for mixing. (2) Separated materials (adding water) in the intensive mixer (tip speed 8 m/s; 1 min) for mixing; and then in the intensive mixer (4 m/s; 1 min) for granulation. (3) Two mixes in a drum (4 min) for granulation. |
(1) Conventional mixer: tip speed of mixing blades 1.9 m/s.
(2) Intensive mixer (Eirich R09T): controllable tip speed of mixing blades 3.7–14.2 m/s.
(3) Drum: 720 mm (long) × 440 mm (dia.); rotation speed 18 rpm.
Tables 3 and 4 list the sintering conditions of the experiments. In these experiments, the iron ore blends of base tests were similar to the blends used in commercial sinter plants. Generally, the iron ore concentrates were increased to replace Brazilian ores (or both Brazilian and Australian ores); and low grade ores were increased to replace Australian ores. The sinters were controlled at the same levels of basicity (1.9), SiO2 (5.1 mass%), and MgO (1.6 mass%), but Al2O3 in sinters varied with the iron ore.
| Test No. | Con A | Con B | Con C | Con D | Ore E | Ore F | Ore G | Ore H | Ore I | Ore J | Con AA | L. fine |
|---|---|---|---|---|---|---|---|---|---|---|---|---|
| (mass%) | (mass%) | (mass%) | (mass%) | (mass%) | (mass%) | (mass%) | (mass%) | (mass%) | (mass%) | (mass%) | (mass%) | |
| Group 1 | ||||||||||||
| Case 1 | 0 | 0 | 0 | 0 | 0 | 0 | 38 | 11 | 12 | 21 | 0 | 18 |
| Case 2 | 10 | 0 | 0 | 0 | 0 | 0 | 38 | 11 | 7 | 16 | 0 | 18 |
| Case 3 | 5 | 0 | 0 | 0 | 7.5 | 0 | 41 | 18.5 | 10 | 7 | 0 | 11 |
| Case 4 | 5 | 10 | 0 | 0 | 7.5 | 0 | 41 | 18.5 | 0 | 7 | 0 | 11 |
| Case 5 | 0 | 10 | 0 | 0 | 9 | 10 | 41 | 7 | 5 | 7 | 0 | 11 |
| Case 6 | 0 | 15 | 0 | 0 | 9 | 10 | 41 | 7 | 5 | 2 | 0 | 11 |
| Case 7 | 0 | 22 | 0 | 0 | 9 | 10 | 41 | 7 | 0 | 0 | 0 | 11 |
| Case 8 | 0 | 0 | 10 | 0 | 10 | 0 | 37.3 | 15.9 | 9.3 | 6.5 | 0 | 11 |
| Case 9 | 0 | 0 | 20 | 0 | 10 | 0 | 31.8 | 13.6 | 8 | 5.6 | 0 | 11 |
| Case 10 | 0 | 0 | 30 | 0 | 10 | 0 | 26.5 | 11.3 | 6.6 | 4.6 | 0 | 11 |
| Case 11 | 5 | 0 | 0 | 0 | 10 | 0 | 40 | 7 | 10 | 10 | 0 | 18 |
| Case 12 | 5 | 0 | 0 | 10 | 10 | 0 | 40 | 7 | 5 | 5 | 0 | 18 |
| Case 13 | 5 | 0 | 0 | 0 | 15 | 0 | 10 | 0 | 25 | 25 | 0 | 20 |
| Case 14 | 5 | 0 | 0 | 30 | 15 | 0 | 10 | 0 | 10 | 10 | 0 | 20 |
| Group 2 | ||||||||||||
| Case 15 | 10 | 0 | 0 | 0 | 10 | 0 | 35 | 6 | 11.1 | 7.9 | 0 | 20 |
| Case 16 | 10 | 0 | 0 | 0 | 20 | 0 | 26.5 | 4.5 | 11.1 | 7.9 | 0 | 20 |
| Case 17 | 0 | 0 | 20 | 0 | 10 | 0 | 40 | 17 | 0 | 2 | 0 | 11 |
| Case 18 | 0 | 0 | 20 | 0 | 20 | 0 | 35 | 12 | 0 | 2 | 0 | 11 |
| Case 19 | 0 | 0 | 20 | 0 | 30 | 0 | 30 | 7 | 0 | 2 | 0 | 11 |
| Case 20 | 5 | 0 | 0 | 0 | 7.5 | 0 | 41 | 18.5 | 10 | 7 | 0 | 11 |
| Case 21 | 5 | 0 | 0 | 0 | 7.5 | 10 | 41 | 8.5 | 10 | 7 | 0 | 11 |
| Case 22 | 5 | 10 | 0 | 0 | 7.5 | 0 | 41 | 18.5 | 0 | 7 | 0 | 11 |
| Case 23 | 5 | 10 | 0 | 0 | 7.5 | 10 | 41 | 8.5 | 0 | 7 | 0 | 11 |
| Group 3 | ||||||||||||
| Case 24 | 5 | 0 | 0 | 0 | 10 | 0 | 35 | 6 | 14 | 10 | 0 | 20 |
| Case 25 | 15 | 0 | 0 | 0 | 20 | 0 | 26.5 | 4.5 | 8.2 | 5.8 | 0 | 20 |
| Case 26 | 20 | 0 | 0 | 0 | 20 | 0 | 26.5 | 4.5 | 5.3 | 3.7 | 0 | 20 |
| Case 27 | 5 | 0 | 0 | 0 | 7.5 | 0 | 41 | 18.5 | 10 | 7 | 0 | 11 |
| Case 28 | 10 | 0 | 0 | 0 | 7.5 | 10 | 41 | 8.5 | 5 | 7 | 0 | 11 |
| Case 29 | 5 | 10 | 0 | 0 | 7.5 | 10 | 41 | 8.5 | 0 | 7 | 0 | 11 |
| Group 4 | ||||||||||||
| Case 30 | 5 | 0 | 0 | 0 | 10 | 0 | 40 | 17 | 10 | 7 | 0 | 11 |
| Case 31 | 5 | 0 | 10 | 0 | 20 | 0 | 35 | 12 | 0 | 7 | 0 | 11 |
| Case 32 | 5 | 0 | 0 | 0 | 10 | 0 | 40 | 17 | 10 | 7 | 0 | 11 |
| Case 33 | 0 | 0 | 20 | 0 | 20 | 0 | 35 | 12 | 0 | 2 | 0 | 11 |
| Case 34 | 5 | 0 | 0 | 0 | 10 | 0 | 40 | 17 | 10 | 7 | 0 | 11 |
| Case 35 | 0 | 0 | 10 | 0 | 10 | 0 | 37.3 | 15.9 | 9.3 | 6.5 | 0 | 11 |
| Case 36 | 0 | 0 | 30 | 0 | 30 | 0 | 15.7 | 6.7 | 3.9 | 2.7 | 0 | 11 |
| Group 5 | ||||||||||||
| Case 37 | 5 | 0 | 0 | 0 | 10 | 0 | 40 | 7 | 10 | 10 | 0 | 18 |
| Case 38 | 5 | 0 | 0 | 10 | 10 | 0 | 40 | 7 | 5 | 5 | 0 | 18 |
| Case 39 | 5 | 0 | 0 | 20 | 20 | 0 | 35 | 2 | 0 | 0 | 0 | 18 |
| Case 40 | 5 | 0 | 0 | 30 | 30 | 0 | 15 | 2 | 0 | 0 | 0 | 18 |
| Case 41 | 0 | 0 | 0 | 40 | 30 | 0 | 10 | 2 | 0 | 0 | 0 | 18 |
| Group 6 | ||||||||||||
| Case 42 | 5 | 0 | 0 | 0 | 10 | 0 | 40 | 17 | 10 | 7 | 0 | 11 |
| Case 43 | 5 | 0 | 0 | 0 | 10 | 0 | 40 | 17 | 0 | 7 | 10 | 11 |
| Case 44 | 0 | 0 | 0 | 0 | 10 | 0 | 40 | 17 | 0 | 2 | 20 | 11 |
| Case 45 | 0 | 0 | 0 | 0 | 10 | 0 | 40 | 17 | 0 | 2 | 20 | 11 |
| Case 46 | 0 | 0 | 0 | 0 | 20 | 0 | 35 | 12 | 0 | 2 | 20 | 11 |
| Group 7 | Group 8 | ||||||||
|---|---|---|---|---|---|---|---|---|---|
| Case 47 | Case 48 | Case 49 | Case 50 | Case 51 | Case 52 | Case 53 | Case 54 | Case 55 | |
| Process | Conv. | Inten. mixing | Conv. | Inten. mixing | Conv. | Conv. | Sep. | Conv. | Sep. |
| Iron ore and burnt lime composition: | |||||||||
| Con A (mass%) | 0 | 0 | 10 | 10 | 5 | 15 | 0 | 15 | 0 |
| Ore E (mass%) | 0 | 0 | 0 | 0 | 10 | 20 | 20 | 20 | 20 |
| Ore G (mass%) | 38 | 38 | 38 | 38 | 35 | 30 | 30 | 30 | 30 |
| Ore H (mass%) | 11 | 11 | 11 | 11 | 5 | 0 | 0 | 0 | 0 |
| Ore I (mass%) | 12 | 12 | 7 | 7 | 15 | 10 | 10 | 10 | 10 |
| Ore J (mass%) | 21 | 21 | 16 | 16 | 10 | 5 | 5 | 5 | 5 |
| Lump fine (mass%) | 18 | 18 | 18 | 18 | 20 | 20 | 20 | 20 | 20 |
| Burnt lime (mass%) | 2.19 | 2.19 | 2.19 | 2.19 | 1.97 | 1.97 | 0.53 | 1.97 | 0.53 |
| Separated materials: | |||||||||
| Con A (mass%) | – | – | – | – | – | – | 15 | – | 15 |
| Burnt lime (mass%) | – | – | – | – | – | – | 1.44 | – | 1.44 |
| Bed height (mm) | 700 | 700 | 700 | 700 | 700 | 700 | 700 | 600 | 600 |
The granulated mix was 700 (or 600) mm in height to make sinter cake in the pot. The mix was ignited at 1200°C for 1.5 min. under 10 kPa suction pressure. After ignition, the suction pressure increased to 14 kPa and the exhaust gas temperature was monitored continuously. The sintering time was 10% greater than the time taken from the ignition to the exhaust gas reaching its highest temperature. The produced sinter cake was then dropped once from a height of 2 m. After cooling in air, it was dropped another 3 times to simulate the shatter conditions in a commercial sinter plant. Subsequently, the sinter was screened with 50, 40, 25, 15, 10 and 5 mm screens and particles over 50 mm were broken down. The sinter above 5 mm was the product of the pot test and that under 5 mm was the return fine. The output of the return fine was controlled to within 90–110% of input by adjusting the coke consumption. The product was taken to calculate the productivity and coke rate of the sinter pot.
The sinters produced by the pot tests were tested for their metallurgical properties, including tumbler strength (TI), low temperature reduction degradation index (RDI) and reducibility (RI).
The sinter pot tests in Table 3, Group 1 were applied for this study. Figure 1 shows that with an increase in coarser concentrate Con A (mean size 0.3 mm) from 0 to 10 mass% replacing Brazilian ores in iron ore blend, the productivity of sinter decreased around 7% (from 30.2 to 28.0 t/24 h·m2).

Effect of increasing iron ore concentrate on sintering properties.
With an increase in coarser concentrate Con B (mean size 0.1 mm) from 0 to 22 mass%, the productivity decreased approximately 5% on average for each 10 mass% concentrate increased.
With increases in finer concentrate Con C or Con D (mean size 0.02 mm) from 10 to 30 mass% or 0 to 30 mass% respectively (replacing Brazilian/Australian ores), the productivity did not alter significantly.
With increases in these concentrates, the trend of tumble strength (TI) of sinter rose; the RDI and RI did not change significantly. In most of cases, the coke rate increased. The suitable moisture content of raw mix did not obviously vary in every concentrate, except that Con D required raising the moisture with an increase in concentrate.
With increases in coarser concentrates, −2 mm content of pseudo-particles, the bulk densities of raw mix before sintering and the sinter cake after sintering on the sintering bed increased. With increases in finer concentrates, −2 mm content of pseudo-particles and the bulk density of sinter cake decreased, but the bulk density of raw mix increased.
3.2. Effect of Increasing Low Grade Ore on Sintering PropertiesIn the experiments of Group 2 (in Table 3), with an increase in low grade Ore E from 10 to 30 mass% replacing Australian ores, the productivity reduced approximately 1% on average for each 10 mass% Ore E increased (as shown in Fig. 2). With an increase in Ore F from 0 to 10 mass%, the productivity lowered approximately 3%.

Effect of increasing low grade ore on sintering properties.
An increase in Ore E or Ore F did not obviously alter the other sintering properties, including TI, RDI, RI, coke rate and the suitable moisture in raw mix.
With increases in low grade ores, −2 mm content of pseudo-particles increased. The bulk densities of raw mix and sinter cake did not change significantly.
3.3. Effect of Increasing Concentrate Combined with Low Grade Ore on Sintering PropertiesIn the experiments Group 3 (in Table 3), as shown in Fig. 3, with increases in coarser Con A 10–15 mass% combined with low grade Ore E 10 mass%, the productivity of sinter decreased around 7–8% (from 29.5 to 27.5–27.1 t/24 h·m2); the TI increased 2%; coke rate and the suitable moisture did not obviously vary. −2 mm content of pseudo-particles, the bulk densities of raw mix and sinter cake increased.

Effect of increasing the coarser concentrate combined with low grade ore on sintering properties.
With an increase in coarser Con A 5 mass% or Con B 10 mass% combined with low grade Ore F 10 mass%, the productivity decreased around 7–8%; the TI increased 1%; and coke rate increased slightly (0.3–0.8 kg/t. sinter). The suitable moisture did not change significantly. −2 mm content of pseudo-particles increased, but the bulk densities of raw mix and sinter cake did not obviously vary.
From the experiments Group 4, Fig. 4 shows that with increases in finer Con C 10–30 mass% combined with low grade Ore E 10–20 mass% (with Con A reduced 0–5 mass%), the productivity of sinter did not obviously alter (ranged within ±2%). The other properties (ex. TI, coke rate and the suitable moisture) also did not change significantly.

Effect of increasing the finer concentrate Con C combined with low grade ore on sintering properties.
In the experiments Group 5, as shown in Fig. 5, with increases in finer Con D 10–40 mass% combined with low grade Ore E 10–20 mass% (with Con A reduced 0–5 mass%), the productivity and the TI did not alter significantly, but the coke rate increased (0.3–2.4 kg/t. sinter), and the suitable moisture rose (0.2–0.4 mass%).

Effect of increasing the finer concentrate Con D combined with low grade ore on sintering properties.
From Figs. 4 and 5, it can also be seen that with increases in finer concentrates combined with low grade ore, −2 mm content of pseudo-particles and the bulk density of sinter cake decreased, but the bulk density of raw mix increased.
Increases in concentrates combined with low grade ores did not obviously affect the RDI and RI.
3.4. Effect of Increasing Micro-particles of Concentrate on Sintering PropertiesIn experiments Group 6 (in Table 3), commercial Con A was pulverized to make the micro-particles Con AA (mean size 0.01 mm) used for this study. Figure 6 shows that compared with the base test, with Con AA 10 mass% added in the iron ore blend to replace Brazilian ore, the productivity increased approximately 3%. The TI, coke rate, the suitable moisture, RDI and RI did not alter significantly.

Effect of increasing the micro-particles of concentrate on sintering properties.
With an increase in Con AA 20 mass% to replace Con A 5 mass% and Brazilian ores 15 mass%, the productivity rose greatly to around 11% (from 27.3 to 30.3 t/24 h·m2), but the TI reduced 1.5%. In this situation, reducing burnt lime consumption (from 18 to 8 kg/t. sinter) could decrease the productivity and improve the TI, with both of them reaching the same levels of base test. The other properties (coke rate, RDI and RI) were also kept at similar levels of base test.
In Fig. 6, it also presented that at the same level of burnt lime consumption, with an increase in Con AA, −2 mm content of pseudo-particles and the bulk density of sinter cake lowered, but the bulk density of raw mix increased.
3.5. Effect of Using the Intensive Mixer on Sintering PropertiesFrom the experiments Group 7 (Table 4), Fig. 7 shows that compared with conventional granulation process, using the intensive mixing process (as shown in Table 2) could improve the productivity of sinter approximately 2% in cases of the iron ore blends containing the coarser Con A 0–10 mass%. The other sintering properties (TI, RDI, RI, coke rate and the suitable moisture) did not obviously change. −2 mm content of pseudo-particles decreased, but the bulk densities of raw mix and sinter cake kept at the same level.
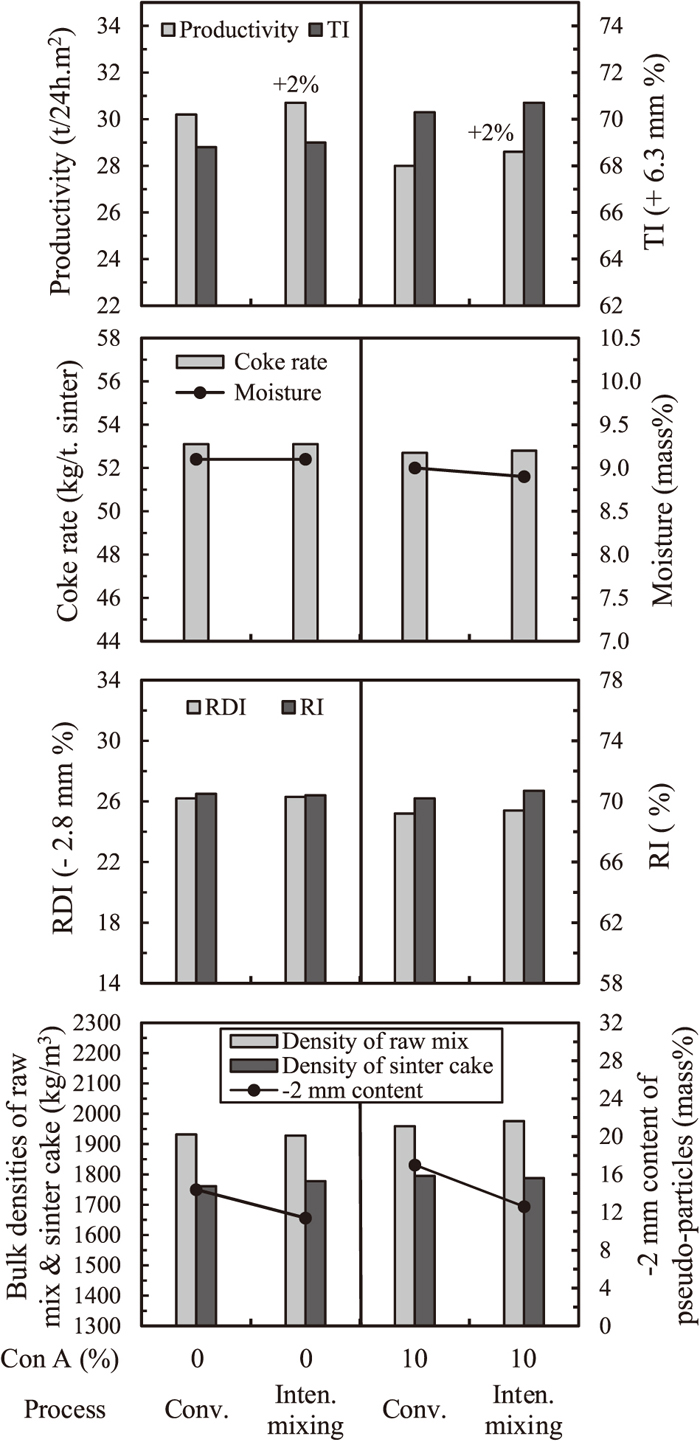
Effect of using the intensive mixing process on sintering properties.
In experiments Group 8, the coarser Con A 15 mass% and part of burnt lime were separated from raw material blend to proceed the mixing and the granulation by the intensive mixer (as shown in Table 2) making green pellets, with mean size 3.4 mm and the moisture 8.9% (as shown in Fig. 8).

Green pellets granulated by the intensive mixer (with a lower tip speed of mixing blades 4 m/s) in the separate granulation process.
The green pellets were added into raw material blend for sintering experiments. Under the total burnt lime controlled at the same level, compared with the conventional process, as shown in Fig. 9, the separate granulation process was able to increase the productivity of sinter approximately 3% and TI around 0–1%, at the bed height 700 mm and 600 mm. −2 mm content of pseudo-particles and the bulk density of raw mix reduced, but the bulk density of sinter cake did not obviously vary.

Effect of using the separate granulation process on sintering properties.
It can also be seen in Fig. 9 that in the conventional process compared with the base test, an increase in Con A 10 mass% combined with low grade Ore E 10 mass% reduced the productivity approximately 9% (from 29.3 to 26.6 t/24 h·m2) at the bed height of 700 mm. Nevertheless using the separate granulation process associated with lowering the bed height (from 700 to 600 mm) could compensate for the reduction of productivity. The other sintering properties (TI, RDI, RI and coke rate) were also kept at similar levels of the base test.
(1) Previous work2,3,4) demonstrated that an increase of concentrate in iron ore blend decreased the productivity of sinter. In this study a similar result was presented in the experiments with increases in the coarser commercial concentrates (mean size 0.1–0.3 mm). However it was also found that increases in finer commercial concentrates (mean size 0.02 mm) 10–40 mass% did not alter the productivity significantly. An increase in 10–20 mass% micro-particle concentrate (mean size 0.01 mm) pulverized from the coarser commercial concentrate could even improve the productivity (3–11%).
Therefore, pulverizing the coarser concentrate to micro-particles is able to resolve the disadvantage of using the coarser concentrate in productivity. Applying this method may even increase the productivity of sinter or reduce the burnt lime consumption in conventional sintering (as shown in Fig. 6).
(2) The author’s previous work1) demonstrated that most sintering properties (including productivity and coke rate) of blending ores were approximately equal to the weighted means of the individual ores.
In this study, the concentrates ranged from 0–40 mass% and low grade ores 0–30 mass% in iron ore blend. The effects of increase in individual concentrate and low grade ore on productivity and coke rate (as shown in Table 5 derived from Figs. 1 and 2) may be used to estimate the productivity and the coke rate of the blends increasing the concentrates combined with low grade ores (Figs. 3, 4, 5 and 9) respectively. Figure 10 shows the experimental productivities are approximately equal to the estimated productivity by using the formula of weighted means. Figure 11 presents the similar result of coke rate.
| Increased ore | +10% Con A | +10% Con B | +10% Con C | +10% Con D | +10% Ore E | +10% Ore F |
|---|---|---|---|---|---|---|
| Replaced ore | Brazil | Brazil | Brazil & Australia | Brazil | Australia | Australia |
| Effect on productivity (t/24 h.m2) | −2.2 | −1.5 | +0.1 | −0.1 | −0.2 | −0.8 |
| Effect on coke rate (kg/t. sinter) | −0.4 | +0.3 | +0.5 | +0.6 | +0.1 | +0.5 |

Comparisons between the estimated and the experimental productivities of sinter.

Comparisons between the estimated and the experimental coke rate of sinter.
(3) In iron ore sintering, the raw materials are granulated by a drum to form the pseudo-particles. Generally the lower −2 mm content in pseudo-particles, the better granulation effect; it was favourable to the permeability and productivity in sintering.7)
In this study, with increases in the coarser concentrates (Con A and Con B) in iron ore blend, −2 mm content of pseudo-particles increased, but it decreased with increases in finer concentrates (Con C and D) (as shown in Fig. 1). The experiments with increases in concentrates combined with low grade ores also show similar trends in Figs. 3, 4, 5. With an increase in micro-particles Con AA, −2 mm content of pseudo-particles also lowered at the same level of burnt lime consumption (as shown in Fig. 6).
From above, the finer particles in concentrate are favourable to the granulation of raw mix. The regression analysis (as shown in Table 6) presents that the portion of −20 μm in iron ore concentrate favours to reduce the −2 mm content of pseudo-particles and to increase the productivity of sinter, but the portion of +45 μm has the reverse effect.
| Base | Cases | Change of concentrate in iron ore blends | Size of concentrate in blends changed | Effect on −2 mm content of pseudo-paticles (mass%) | Effect on productivity of sinter (%) | |
|---|---|---|---|---|---|---|
| +45 μm (mass%) | −20 μm (mass%) | |||||
| Case 1 | Case 2 | Con A +10% | 9.65 | 0.21 | 2.6 | −7.3 |
| Case 3 | Case 4 | Con B +10% | 6.41 | 1.04 | 1.4 | −4.2 |
| Case 5 | Case 7 | Con B +12% | 7.69 | 1.25 | 3.1 | −8.2 |
| Case 8 | Case 9 | Con C +10% | 1.58 | 5.22 | −3.0 | −1.1 |
| Case 9 | Case 10 | Con C +10% | 1.58 | 5.22 | −1.4 | +1.4 |
| Case 11 | Case 12 | Con D +10% | 1.63 | 4.79 | −3.7 | 0 |
| Case 13 | Case 14 | Con D +30% | 4.89 | 14.37 | −5.0 | −1.2 |
| Case 42 | Case 43 | Con AA +10% | 0.67 | 7.95 | −1.2 | +3.3 |
| Case 43 | Case 44 | Con AA +10% & Con A −5% | −4.16 | 7.85 | −6.2 | +7.4 |
Analisis results:
Effect on −2 mm content of pseudo-paticles (mass%) = 0.35 * [+45 μm content (mass%)] −0.47 * [−20 μm content (mass%)] R2 = 0.87
Effect on productivity of sinter (%) = −0.91 * [+45 μm content (mass%)] +0.32 * [−20 μm content (mass%)] R2 = 0.93
(4) The previous study8) presented that the lower bulk densities of raw mix before sintering and the sinter cake after sintering on the sintering bed favoured the permeability and the productivity in sintering. In this study, with an increase in the coarser Con A, both the bulk densities of raw mix and sinter cake increased (as shown in Figs. 1 and 3), which should be a disadvantage to the productivity.
With increases in finer concentrates (Con C and Con D), the trend on the bulk density of raw mix increased, but that of sinter cake reduced (as shown in Figs. 1, 4 and 5). This implies that compared with the coarser concentrate (Con A), increases in finer Con C and Con D were able to generate the stronger pseudo-particles, which caused less shrinkage of bed in sintering, formed a lower density of sinter cake, and favoured the permeability in sintering and the productivity. Pan et al.9) also found as the content of finer-particles (−0.043 mm) of concentrate increased, both the compressive and the drop strength of the green ball increased.
(5) According to the previous study,1) the coke rate of sinter increased with a decrease in the size of iron ore. In this study it was found that with increases in concentrates, the coke rate also increased in all concentrates, except Con A (as shown in Table 5).
Panigrapy et al.10) presented that the thermal effect of magnetite in raw material could decrease the coke rate in sintering. In addition, a lower Al2O3 content in sinter also reduced coke rate.11) Therefore compare with the other concentrates, since Con A contains magnetite around 30% and a lower Al2O3 (as shown in Table 1), it required a lower coke rate in sintering. With an increase in Con A, the coke rate decreased in this study.
(6) In iron ore sintering processes, the raw material’s particles are required to absorb moisture for granulation. Compared with conventional process, adding an intensive mixer before the drum could enhance the moisture in raw materials to be more homogeneous.12) Thus it improved the granulation, increased the productivity (1.5%) and reduced the coke rate (1.2 kg/t. sinter) in commercial sintering.7)
In the author’s previous work,13) using the intensive mixing process for various raw materials resulted in slightly different effects on sintering properties. With the raw materials of a smaller size, it improved the productivity (1.0%) and the coke rate (0.9 kg/t. sinter).
In this study, to simulate the intensive mixing process of Dragon Steel corp. in Taiwan,5) the raw materials without return fine were mixed in the intensive mixer, which was somewhat different from previous studies.7,13) In this intensive mixing process, −2 mm content in pseudo-particles reduced (as shown in Fig. 7), but the bulk densities of raw mix before sintering and sinter cake after sintering in the sintering bed did not change obviously. Combining these factors, the productivity of sinter was improved (around 2%). This improvement effect is similar to previous studies.7,13)
(7) In the separate granulation process, the intensive mixer may be followed by various granulation equipments. According to studies in commercial sintering, T. Ookubo et al.14) demonstrated that using a drum for granulation increased productivity 2.1% and TI 1.0%, and reduced coke rate 0.9 kg/t. sinter. J. B. Kim et al.15) found that using a disc pelletizer raised productivity 3.4%.
In this study, the intensive mixer operated with a lower tip speed (4 m/s) of mixing blades was applied for granulation in the separate granulation process. Both −2 mm content in pseudo-particles and the bulk density of raw mix decreased, but the bulk density of sinter cake did not alter significantly (as show in Fig. 9). Combining these factors, the productivity increased around 3%. This improvement effect is also similar to the previous works.14,15)
(1) In conventional sintering, with increases in coarser commercial concentrates (mean size 0.1–0.3 mm), the productivity of sinter decreased 5–7% for each 10 mass% concentrate increased. With increases in finer commercial concentrates (mean size 0.02 mm) of 10–30 mass%, the productivity did not alter significantly. With an increase in 10–20 mass% micro-particle concentrate (mean size 0.01 mm) pulverized from coarser commercial concentrate, the productivity increased 3–11%.
(2) From regression analysis, the portion of −20 μm in iron ore concentrate favoured the granulation and the productivity in conventional sintering, but the portion of + 45 μm had the reverse effects.
(3) With increases in low grade ores, the productivity decreased around 1–3% for each 10 mass% low grade ore increased.
(4) With increases in coarser concentrates (5–15 mass%) combined with low grade ores (10 mass%), the productivity decreased (7–8%). Whereas with increases in finer concentrates (10–40 mass%) combined with low grade ore (10–20 mass%), the productivity did not obviously change.
(5) Compared with conventional process, using the intensive mixer in an intensive mixing process or a separated granulation process could improve the productivity of sinter around 2 or 3% respectively.