Regular Article
Effect of Particle Penetration Depth on Solid/liquid Mass Transfer Rate by Particle Blowing Technique
2017 Volume 57 Issue 11 Pages 1902-1910
Details
2017 Volume 57 Issue 11 Pages 1902-1910
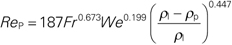
In this study, cold model experiments on particle blowing were carried out to clarify the effect of particle penetration depth on solid/liquid mass transfer rate. A comparison of penetration depth obtained by experiment and CFD calculation using commercially available software was also carried out. The penetration depth was measured by a visual observation whereas the solid/liquid mass transfer rate was obtained from the ion-exchanged reaction between Na+ on pearlite particles and H+ in HCl aqueous solution. Both of the penetration depth and solid/liquid mass transfer rate increased with the increase in particle feed rate and top blowing gas flow rate, and the decrease in lance height and particle diameter. The following non-dimensional equation of particle penetration depth was obtained by several non-dimensional numbers:
 |
Pulverized flux blowing to molten steel surface accelerates impurity removal rate and its technique has been always developed in the field of steelmaking. For example, the LD-AC process1) was applied to dephosphorization of molten iron with high phosphorus level by blowing CaO-based powder through a top lance in the converter. A procedure for refining ultra-low sulfur steel by blowing desulfurizing agent on the molten steel in the vacuum vessel of RH degasser has been put to practical use.2,3) Nitrogen removal with decarburization was increased under reduced4) or ordinary5) pressure by blowing oxidizing flux. Copper and tin removal6) rate in molten scrap was enhanced by using oxidizing powder by a combination of plasma heating. Sulfur and oxygen contents affected nitrogen removal during CaO powder blowing under reduced pressure.7) On the other hand, the copper smelting and converting process by blowing air, raw material and flux through top lances named as the Mitsubishi process8,9) has been put into operation since 1974.
The contact time between solid powder and steel melt in the RH degasser is relatively long because the powder blown in the vacuum vessel transfers and suspends in the ladle and finally floats on the steel surface.10) However, for the powder blowing in the furnace, the contact time when the powder penetrates the interface between gas and steel melt and floats completely on the surface is short compared with the RH blowing. From the view point of the reaction time between powder and steel melt, it is necessary to penetrate powder more deeply in the steel melt and assure the longer contact time. However, there was little research on the relationship between the solid/liquid reaction rate and the penetration depth of the particle into steel melt, although the critical condition and depth of powder penetration were investigated by using hot and cold model experiments.11,12,13,14,15,16,17,18,19,20) The trajectory of the solid particle9) and inclusion agglomeration21) of RH degasser were calculated by a coupled analysis using Navier-Stokes equation and solid particle (inclusion) equation of motion with respect to computation fluid dynamics (CFD) on solid particle behavior in liquid. However, it was difficult to find the research on the penetration behavior of particles or powders by using CFD.
In this study, cold model experiments were carried out to clarify the effect of the particle penetration depth on the solid/liquid mass transfer rate in parallel with the comparison of the penetration depth between the experiment and calculation by CFD.
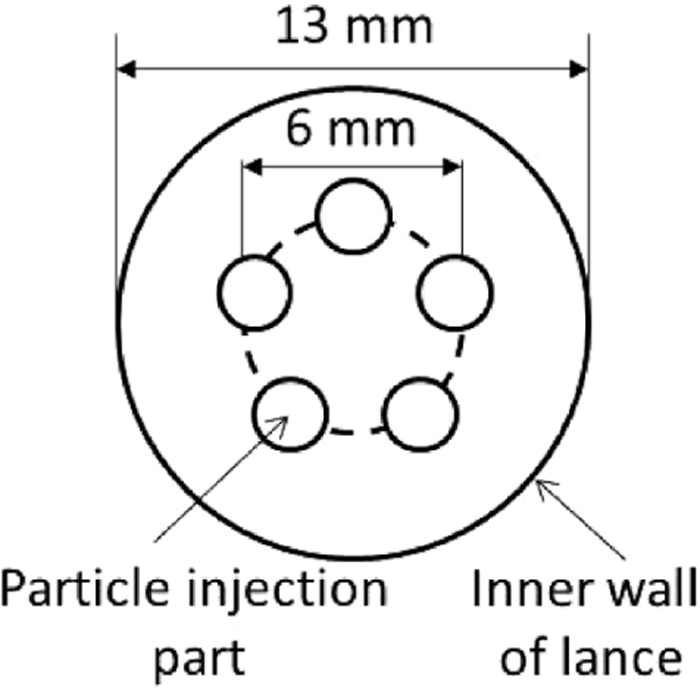
The schematic diagram of the experimental apparatus for measuring particle penetration depth is shown in Fig. 1. Ion-exchanged water or 3.0 M KCl aqueous solution was put into an acrylic vessel of 400 mm in inner diameter and 400 mm in height so as to have a 100 mm in static bath depth. Liquid and solid densities as well as liquid viscosity used for the experiment are shown in Table 1. Pearlite or polystyrene in a particle feeder (Island Industry Co., Ltd.) was blown in the liquid through a top lance with inner diameter of 13 mm. Air compressed by a compressor (Anest Iwata Corp., SLP-37EB) and controlled by a mass flow controller (MFC) (Yamatake Corp., CMQ-V) was used as a carrier gas for solid particles. In order to compare with the particle blowing, the particle injection experiment was also carried out by immersing the lance into the liquid. A video camera (Sony Corp., HDR-CX700V) was used to measure particle penetration depth. The mean value of 10 measurements was taken as the penetration depth. The experimental conditions of the particle blowing and injection are shown in Tables 2 and 3, respectively. Top blowing gas flow rate, lance height, pearlite and polystyrene feed rates were varied for the particle blowing method, whereas top blowing gas flow rate, injection depth and pearlite feed rate were changed for the particle injection. No polystyrene was used for the injection experiment. Both of top blowing gas flow rate and pearlite feed rate for the particle blowing method were larger than those for the injecting one.
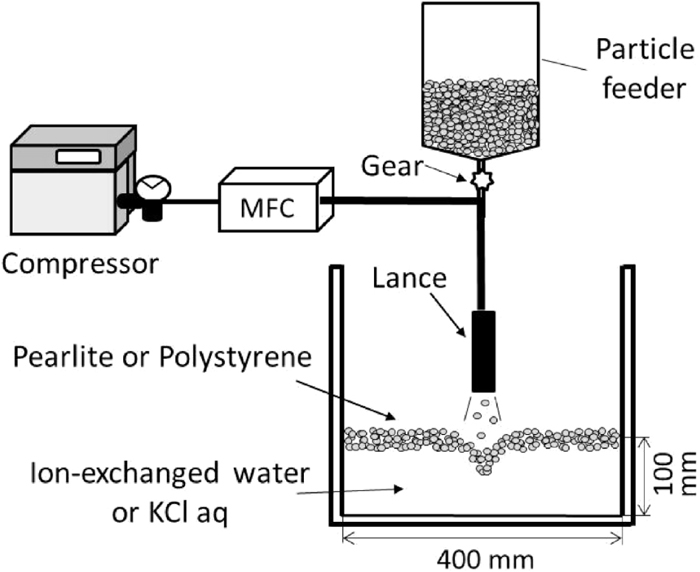
Schematic diagram of the experimental apparatus for measuring penetration depth.
| Liquid or solid | Density (kg/m3) | Viscosity (Pa·s) |
|---|---|---|
| lon-exchanged water | 1.00×10³ | 1.00×10⁻³ |
| 3.0 M KCl aq | 1.11×10³ | 1.02×10⁻³ |
| Pearlite | 1.00×10² | – |
| Polystyrene | 1.04×10³ | – |
| Item | |
|---|---|
| Top blowing rate, QTB L/min (STP) | 100, 150, 200 |
| Bottom blowing rate, QB L/min (STP)** | 5 |
| Lance height, LH mm | 50, 100, 150 |
| Pearlite feed rate, Fpl g/min | 28.8, 57.6, 86.4, 115.2 |
| Pearlite diameter, dp mm | 1.3*, 2.0 |
| Polystyrene feed rate Fps g/min* | 61.2, 120.6, 178.8, 239.6 |
| Polystyrene diameter, dp mm* | 1.1 |
| Liquid | KCl aq*, HCl aq** |
*; only penetration depth, **; only solid/liquid mass transter
| Item | |
|---|---|
| Gas injection rate, QTi L/min (STP) | 50, 80 |
| Bottom blowing rate, QB L/min (STP)** | 5 |
| Injection depth, ID mm | 10, 25 |
| Pearlite feed rate, Fpl g/min | 3.1, 6.1, 9.5, 12.9 |
| Liquid | lon-exchanged water*, HCl aq** |
*; only penetration depth, **; only solid/liquid mass transfer
Figure 2 shows the schematic diagram of the experimental apparatus for measuring solid/liquid mass transfer rate. Air was injected into liquid through a nozzle of 3 mm in diameter at the bottom center of the same vessel as shown in Fig. 1. Before the experiment, pearlite of dp= 2.0 mm in diameter was immersed into 2.0×10⁻³ M NaOH aqueous solution for 12 h, washed by ion-exchanged water until the electric conductivity was kept constant and dried at room temperature for 12 h. After putting 0.25 L of prepared pearlite particles and 12.6 L of 2.35×10⁻⁴ M HCl aqueous solution into the vessel, particles through the top lance were blown in the liquid with the carrier gas. As H+ in HCl aqueous solution reacts with Na+ on the pearlite surface under the rate-determining step of solid/liquid mass transfer,22,23) mass transfer rate can be calculated from the temporal change in H+. The concentration of H+ was measured by an electrical conductivity meter (Automatic system research, mk-250EC) shown as EC in Fig. 2. The injection experiment was also made for the comparison. The experimental conditions of the particle blowing and injecting methods are also shown in Tables 2 and 3, respectively. The operating factors such as top blowing gas flow rate, lance height and pearlite feed rate were changed similar to the penetration depth measurement described in the previous section. To compare with the above methods, the gas blowing without particles was carried out by floating particles on HCl aqueous solution before the experiment. The floated pearlite was changed between 0.15 L (15 g) and 0.87 L (87 g), and top blowing gas flow rate and lance height was fixed to 200 L/min (STP) and 50 mm, respectively.
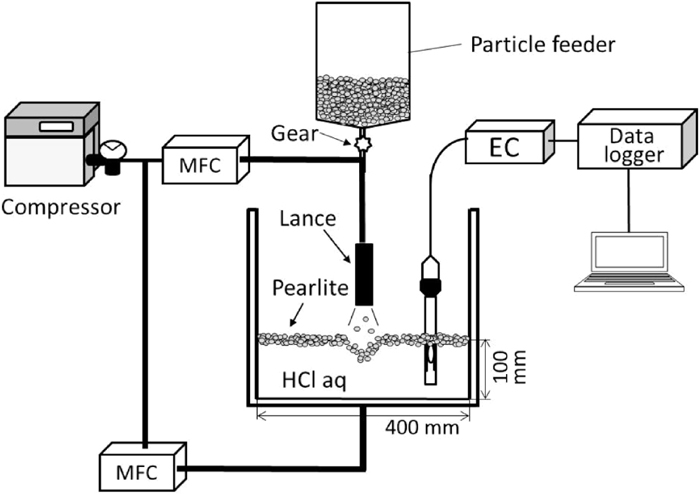
Schematic diagram of the experimental apparatus used for measuring solid/liquid mass transfer rate.
For the application to the CFD calculation, the pearlite velocity at the exit of the top lance was measured by a high speed camera (HAS-550, DITECT Corporation). Sampling speed was set to 500 frames/s. Top blowing gas flow rate was varied to 100, 150 and 200 L/min (STP) and pearlite feed rate was fixed to 28.8 g/min. The pearlite velocity ratio to carried air one is shown in Fig. 3. The pearlite velocity was kept to about 30% of the carried air velocity, although the carried air velocity was changed in this study. Generally, the particle velocity ratio to the carried gas depends on various conditions24) such as particle density, diameter and the particle running distance until the exit. In this study, the 30% of the carried gas velocity was set for the particle velocity in the CFD calculation described in Section 2.4 due to the equal particle running distance between the experiment and calculation.
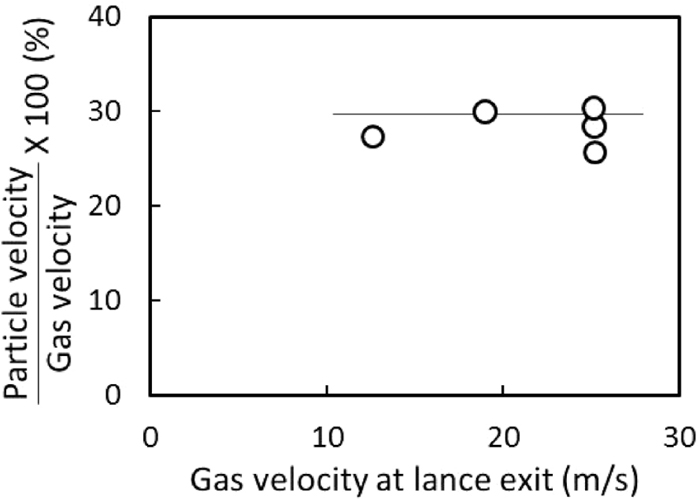
Effect of gas velocity at lance exit on the ratio of particle velocity to carrier gas velocity.
Discrete element method (DEM)25) which can treat collision and repulsion between particles was applied to analyze the particles behavior. The equation of particle motion in the fluid is expressed by
| (1) |
The elastic force and viscous damping in the Fcontact term was considered without particles rotation and friction.
For the fluid field of particles moving, three-dimensional unsteady incompressible flow in a vessel was calculated with VOF (Volume of Fluid) method. The realizable k-ω model26) was used for the turbulence model. The equations of continuity and motion which control the fluid flow are expressed by Eqs. (2) and (3), respectively.
| (2) |
| (3) |
| (4) |
Here, ρ, ρl, and ρg are the mean, liquid and gas densities (kg/m3), respectively, u is the velocity vector (m/s), p is the pressure (Pa), μturb is the turbulent viscosity (Pa·s), g is the gravity acceleration vector (m2/s), and αl and αg are the volume fraction of liquid (water) and gas (air), respectively.
ANSYS Fluent 17.0 (ANSYS, Inc.) was used for the calculation of coupling the DEM model for the particles with the VOF method for the fluid behavior. The particles obtained the external forces in Eq. (1) such as the drag and buoyancy from the fluid, whereas the fluid exchanged the momentum through the particle drag force. Continuum Surface Force method (CSF)27) which dealt with surface tension was applied to calculate the gas/liquid interface of the VOF method, although the interfacial tension between the particle and fluid was not considered.
Pearlite of dp=2.0 mm in diameter or polystyrene with the carrier gas of air in Table 1 was blown to 3 M KCl aqueous solution. The geometric configuration was the same as the experiment as shown in Fig. 1. Total mesh number was 306300 and the minimum mesh width 0.6 mm. All of the meshes were composed of hexahedral configuration. The time step for the calculation of the particles movement was 10−5 s, whereas that of the fluid was 10−3 s. 100 times iterations of particles calculation by Eq. (1) were carried out by using a fixed fluid field calculated by Eqs. (2) and (3). Wall function was used at the vessel bottom and wall boundary, and the fluid flowed out at the constant pressure at the vessel top boundary. As shown in Fig. 4, particles were blown vertically through the lance exit and the particle feed rate was controlled by the time interval of injection. There was no velocity distribution at the lance exit.
Schematic diagram of particle blowing position at lance exit.
(a) Gas/liquid interface and particle penetration depth
An example of the pearlite penetration behavior compared between the CFD calculation and experiment is shown in Fig. 5. Top blowing gas rate, QTB, was 100 L/min (STP), top lance height, LH, 50 mm and pearlite feeding rate, FPl, 28.8, 86.4 and 115.2 g/min. The dotted line of the right hand side indicated the interface between gas and liquid confirmed by the visual observation, although it was a little bit difficult to judge the border in this photograph. As for the left hand side image, the small circles were the blown particles. The calculated particle penetration depth into liquid agreed well with the experiment.
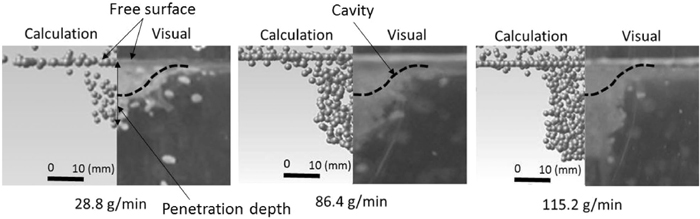
Comparison of pearlite penetration between CFD calculation and experiment (QTB=100 L/min (STP), LH=50 mm).
Ozawa et al.12) presented the critical particle penetration velocity into liquid as follows:
| (5) |
(b) Effect of operating factors on particle penetration depth
The experimental relationship between the polystyrene penetration depth and feed rate is shown in Fig. 6 where (a); top blowing gas flow rate, QTB L/min (STP), is varied under the constant lance height, LH , and (b); LH is changed and QTB is fixed. The penetration depth increased with the increases in the polystyrene feed rate and the top blowing gas flow rate and the decrease in the lance height except LH of 100 and 150 mm for polystyrene feed rate of 61.2 g/min. Thus, the penetration depth is roughly enhanced by the hard blowing.
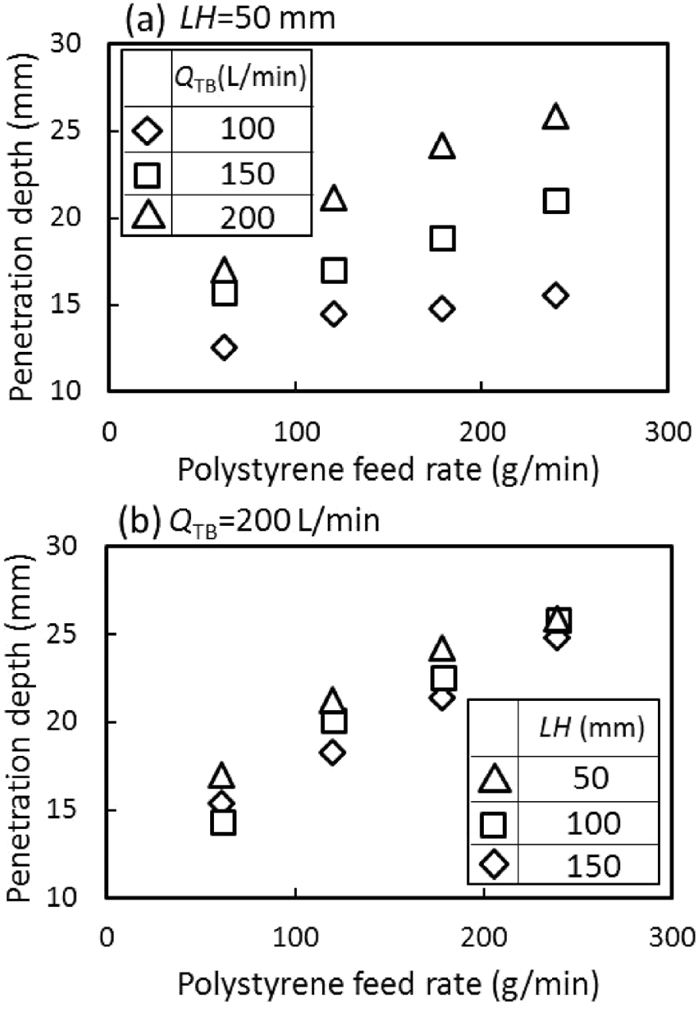
Relationship between polystyrene penetration depth and feed rate for particle blowing.
The experimental relationship between the pearlite penetration depth and feed rate is shown in Fig. 7 where (a); QTB and dP are varied and LH is fixed, and (b); LH and dP are changed under the constant QTB. As well as the polystyrene particles in Fig. 5, the pearlite penetration depth increased with the increase in the feed rate and the top blowing gas flow rate, and the decrease in the lance height. As for the particle diameter, the smaller particle has the larger penetration depth.
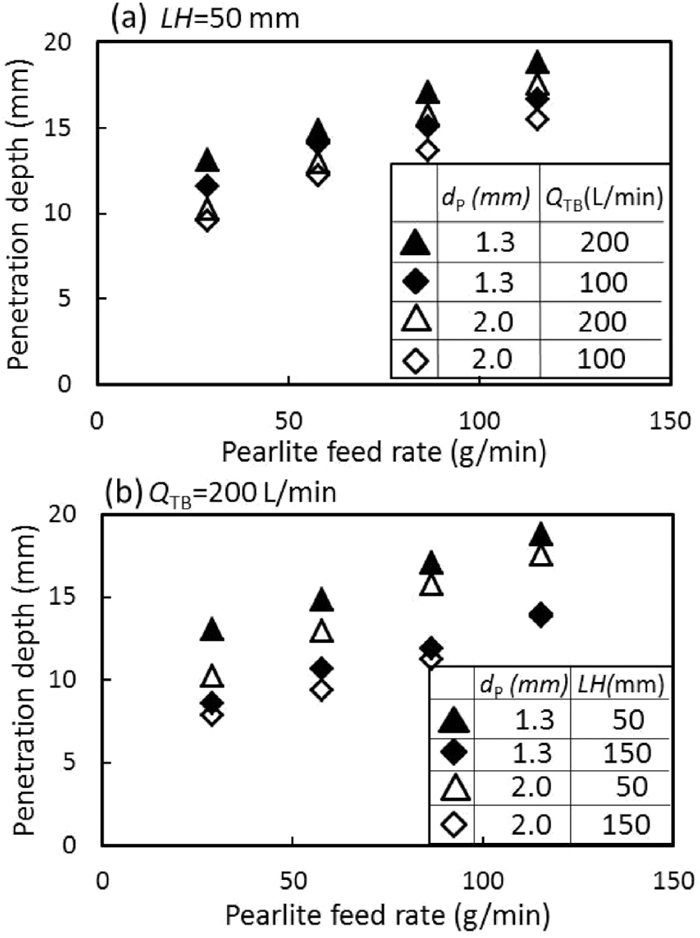
Relationship between pearlite penetration depth and feed rate for particle blowing.
We tried to express the experimental particle penetration depth in terms of the following non-dimensional numbers.
| (6) |
| (7) |
| (8) |
| (9) |
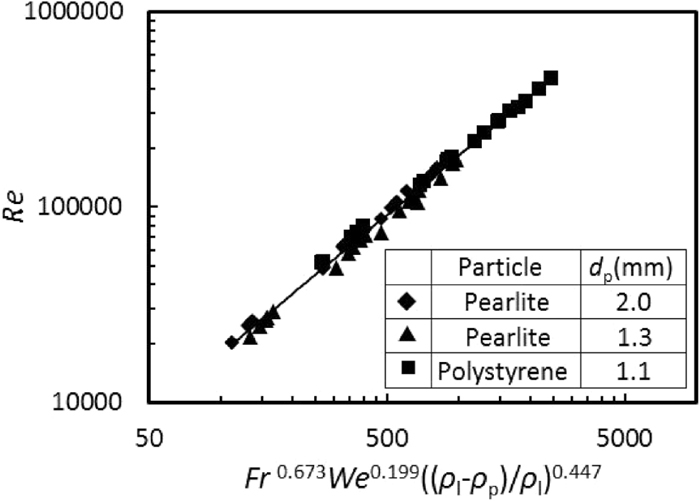
Correlation among non-dimensional numbers.
The experimental penetration depth was compared with the calculated value obtained from the CFD as shown in Fig. 5. The results are shown in Fig. 9. The experimental values agreed with the CFD calculation in spite of no γsl term for the CFD calculation. It seems to be due to the low power (= 0.199) of Weber number in Eq. (9) and the correlation may be changed for the wide range of γsl.
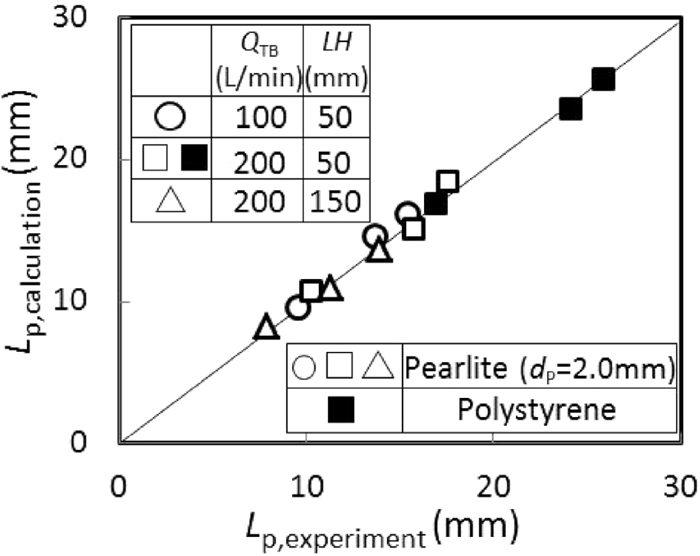
Comparison between CFD calculated and experimental penetration depth.
On the other hand, Kimura11) proposed an empirical equation of particle penetration depth including cavity depth as follows:
| (10) |
| (11) |
| (12) |
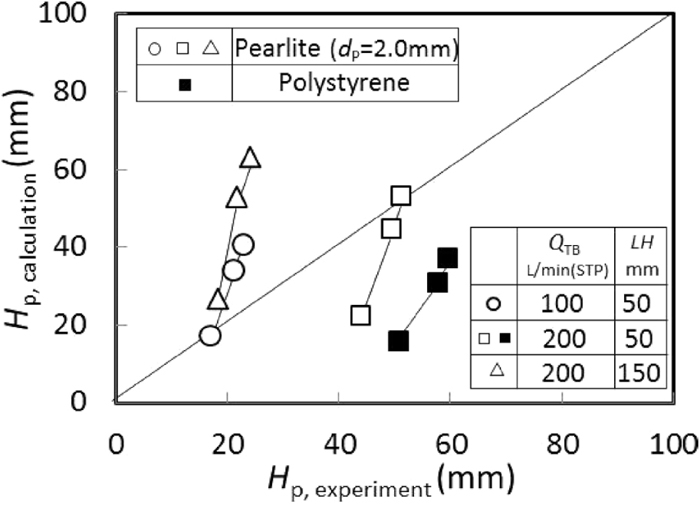
Comparison between calculated HP by the empirical expression of Kimura11) and experimental one.
To compare the penetration behavior of particles injection into water through the immersed lance with that of the particle blowing, the particle penetration depth of the injection was examined. The relationship between the particle penetration depth and feed rate is shown in Fig. 11. The penetration depth increased with the increase in the feed rate and the gas injection rate, QTI (L/min), but was not dependent on the lance immersion depth, ID (mm). Compared with the particle blowing in Figs. 6 and 7, the penetration depth of the particle injection was smaller, because the pearlite feed rate was smaller than that of top blowing.
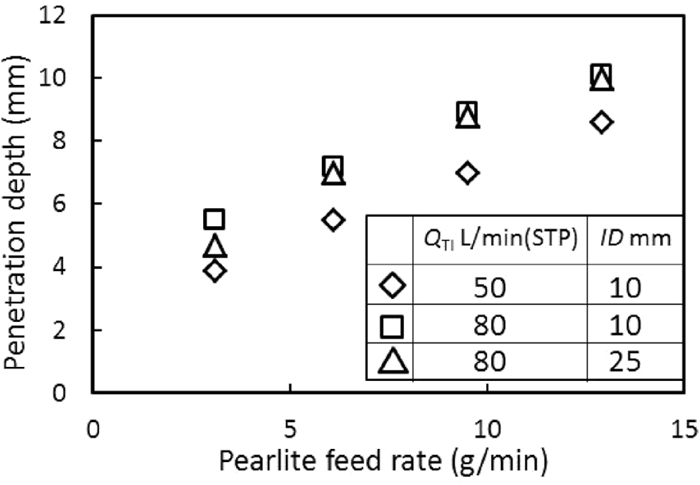
Relationship between penetration depth and pearlite feed rate for particle injection.
Ion exchanged reaction of pearlite with Na+ is expressed by Eq. (13).
| (13) |
As the reaction rate is normally controlled by the diffusion in the fluid film at the early stage,22,23) solid/liquid mass transfer rate during pearlite blowing is given by Eq. (14).
| (14) |
| (15) |
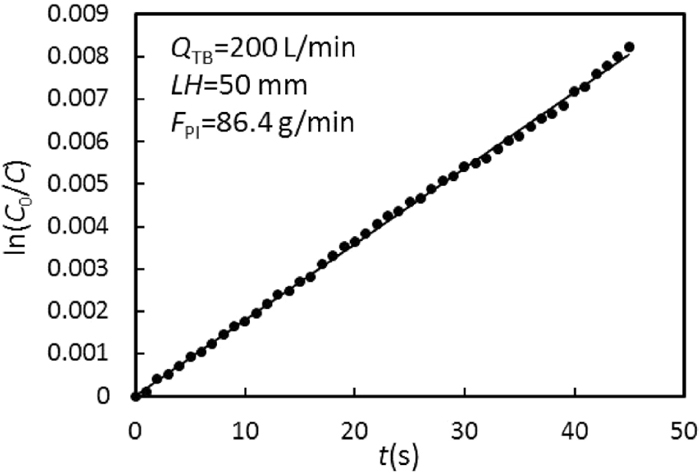
An example of temporal change in C0/C is shown in Fig. 12. QTB was 200 L/min, LH is 50 mm and pearlite feed rate, FPl was 86.4 g/min. As logarithmic C0/C increased almost linearly with time, the slope became the constant (k1a1+k2a2)/V value. The linearity of ln(C0/C) was also obtained at the other particle blowing condition in this study.
Typical example of temporal change in hydrochloric acid concentration.
Solid/liquid mass transfer rate was studied when pearlite particles were floated on the surface of HCl aqueous solution with the gas blowing without particle. Total surface area, a2 (m2), of floated pearlite particles was calculated by Eq. (16).
| (16) |
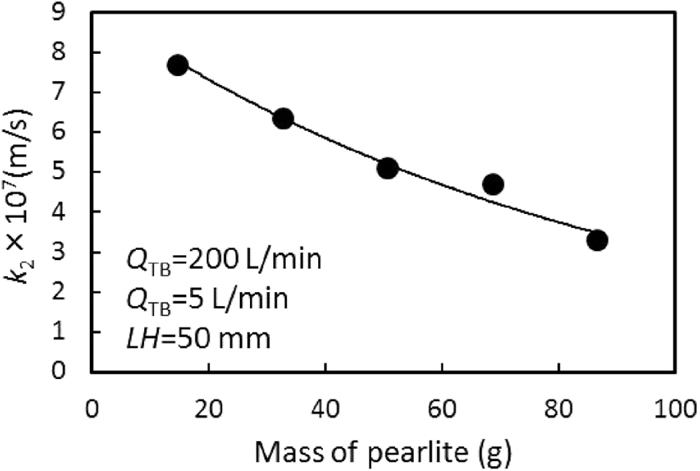
The relationship between k2 and mass of pearlite is shown in Fig. 13. QTB and QB were 200 and 5 L/min (STP), respectively, and LH was 50 mm. The increasing mass of floated particles reduced the k2 value, because thicker particles layer became insufficient to contact between the pearlite particle and HCl aqueous solution.
Relationship between mass transfer coefficient and mass of pearlite floated on liquid.
The particle blowing might enhance the floated particles temporally and the solid/liquid mass transfer rate due to the increasing a2. However, as seen in the slope in Fig. 12, the linearity of the slope was confirmed, that is, (k1a1+k2a2)/V was kept constant. In this study, it means that
| (17) |
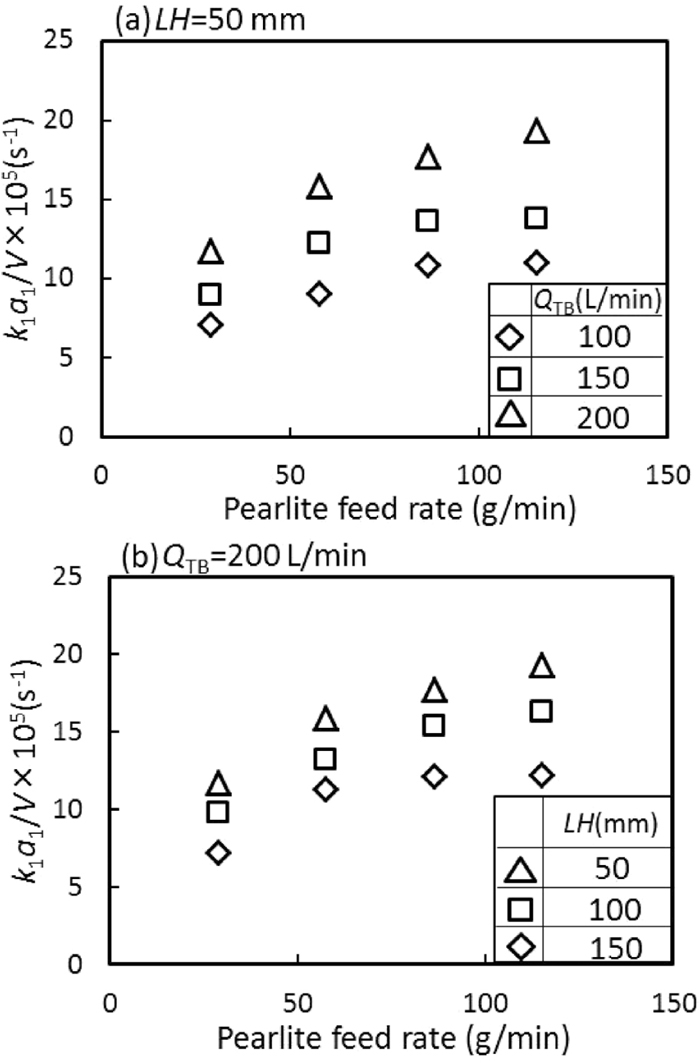
The relationship between mass transfer capacity coefficient and pearlite feed rate is shown in Fig. 14 where (a) is under the varied QTB (L/min) and the constant LH, and (b) is under the varied LH and the fixed QTB. As well as the penetration depth in Figs. 6 and 7, the k1a1/V value increased with the increasing pearlite feed rate and top blowing gas flow rate, and the decreasing lance height.
Relationship between mass transfer capacity coefficient and pearlite feed rate for particle blowing.
We assumed that the solid/liquid mass transfer occurred mainly from the particle breakthrough point at the cavity until the deepest particle penetration position. Froessling equation31) expressed by Eq. (18) is widely used to analyze the solid/liquid mass transfer rate in the fluid.
| (18) |
| (19) |
| (20) |
| (21) |
The
| (22) |
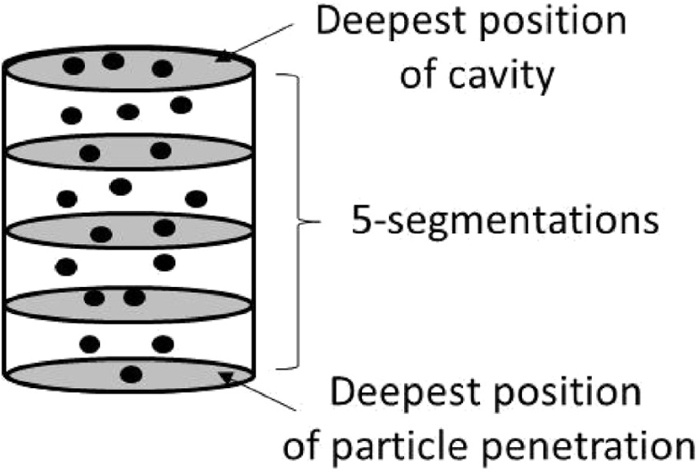
Segmentation for obtaining liquid and particle velocities.
Figure 16 shows the relationship between solid/liquid mass transfer coefficient or interfacial area and pearlite feed rate. The solid/liquid interfacial area, a1, in Fig. 16(b) was obtained by substituting the calculated mass transfer coefficient, k1, in Fig. 16(a) into the mass transfer capacity coefficient, k1a1/V, as shown in Fig. 14. The k1 value increased with the increase in pearlite feed rate, FPl, and QTB, and the decrease in LH. The effect of QTB and LH on k1 is due to hard blowing. On the other hand, as seen in Fig. 16(b), the a1 value increased with the increasing FPl at low FPl and it is suppressed at FPl>57.6 g/min. The dependency of QTB and LH on a1 was not clear.
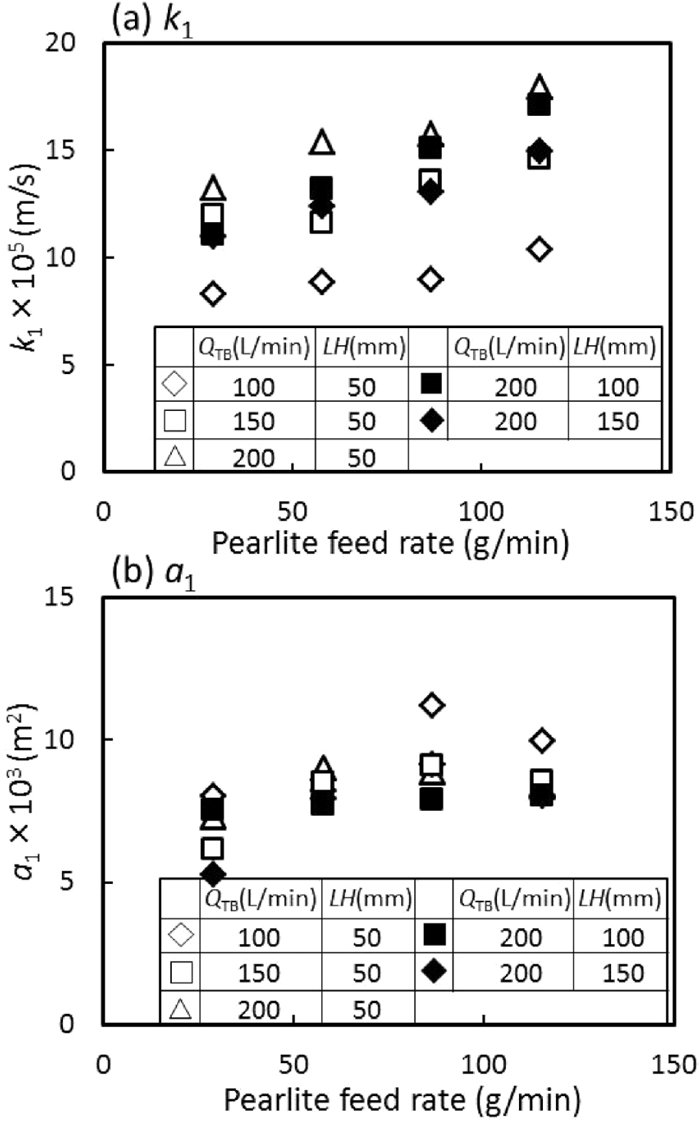
Relationship between solid/liquid mass transfer coefficient or interfacial area and pearlite feed rate.
Figure 17 shows the effect of penetration depth, Lp, on solid/liquid mass transfer properties such as (a) k1a1/V, (b) k1 and (c) a1. The k1a1/V, k1 and a1 values increased with the increasing Lp when QTB and LH are fixed. As for the constant Lp, k1a1/V and k1 increased with the increase in QTB under the constant LH, although the effect of LH was not clear at the same QTB. As the larger QTB leads to the faster particle velocity as shown in Fig. 3, that is, the larger
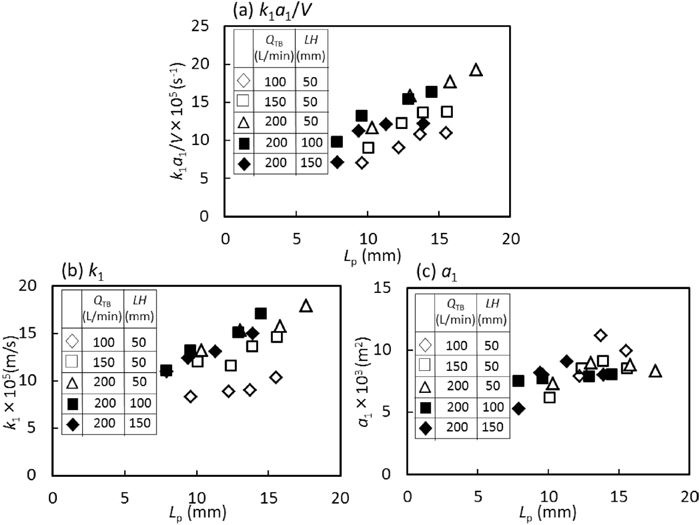
Relationship between solid/liquid mass transfer properties and penetration depth.
The mass transfer rate for the particle injection was measured under the same condition as the penetration depth in Fig. 11. The relationship between k1a1/V and pearlite feed rate is shown in Fig. 18. The k1a1/V increased with the increasing QTI and ID. However, the increase in k1a1/V was small, although the pearlite feed rate became the 4-times large value. It is due to the crowded particles at the particle invasion spot.
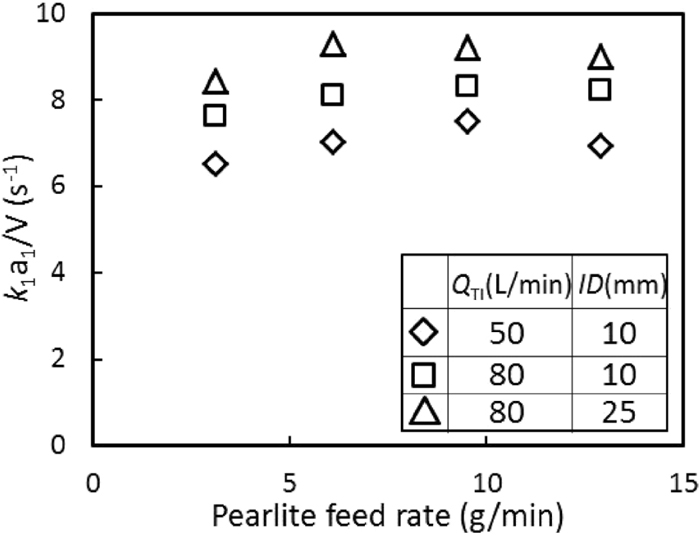
Relationship between solid/liquid mass transfer capacity coefficient and pearlite feed rate for particle injection.
The particle penetration depth and solid/liquid mass transfer rate of particle blowing were investigated by cold model experiments, and the CFD calculation of penetration depth by a combination of VOF and DEM model was carried out and compared with the experimental results.
(1) Both penetration depth and solid/liquid mass transfer rate increased with the increase in particle feed rate and top blowing gas flow rate, and the decrease in lance height and particle diameter.
(2) The calculated particle penetration depth was in good agreement with the experimental value.
(3) The following non-dimensional equation of particle penetration depth was obtained:
(4) The solid/liquid mass transfer coefficient calculated by the CFD simulation and Froessling equation increased with the increase in top blowing gas flow rate, particle feed rate and penetration depth.
(5) The solid/liquid interfacial area was expressed by a function of penetration depth.
The CFD computation of this work was supported by Mr. Tomomi Nakanishi (JFE Techno-Research Corporation).