Regular Article
Effect of Ti Content on the Characteristics of Inclusions in Al–Ti–Ca Complex Deoxidized Steel
2017 Volume 57 Issue 2 Pages 314-321
Details
2017 Volume 57 Issue 2 Pages 314-321
Experiments with different titanium addition were carried out in alumina crucible without slag at 1873 K to investigate the variation of inclusion composition, size and morphology in Al–Ti–Ca complex deoxidized steel. The samples exacted from the experimental steels were analyzed by field emission scanning electron microscopy (FE-SEM) and energy dispersive spectroscopy (EDS). Titanium influence significantly on the morphology, size distribution and composition of oxide inclusions in Al–Ca deoxidized steels, and the inclusions characteristics vary with titanium content. Liquid oxide inclusions are promptly modified by titanium. On the other hand, titanium can also change solid calcium aluminate inclusions into spherical ones in the melts similarly, but there are a number of inhomogeneous inclusions in molten steel at the initial stage. Therefore, to modify inclusions better, the content of titanium and calcium in molten steel should be controlled simultaneously during the production process.
It is generally accepted that titanium is a significant alloying element which can increase steel production quality. Titanium is always used as a kind of stabilizing element, which reacts with the carbon or nitrogen to form carbonitride to bind the soluble carbon and nitrogen, especially for IF steels,1) Ti–bearing stainless steels2) or wire cord steels.3) In addition, Ti–oxide in steel can be nucleating sites for intragranular acicular ferrite during solidification, and improve mechanical properties around welded region in steels.4,5,6,7,8) However, Ti–containing inclusions may also cause severe nozzle clogging problems, which are detrimental to steel production process. As a result, there are many researches of nonmetallic inclusions in Al–Ti deoxidized steel in recent years, such as thermodynamic,9,10,11,12,13,14,15,16) size distribution,17,18,19) modification process10,11,16,20) and collision character.21) Until now, the researchers haven’t reached an agreement on the equilibrium phases of the Al–Ti–O system in molten steel yet. Ruby-Mayer et al.14) and Jung et al.15) insisted that there was a liquid stable region between Al2O3 and Ti3O5 regions based on thermodynamic calculation. However, Wang et al.,9,10,11) M-A Van Ende et al.12) and Matsuura et al.16) thought that only Al2O3, Ti2O3, Ti3O5, and Al2TiO5 were stable phases. Therefore, it is difficult to solve the clogging problems in Ti–bearing steel production process only depending on Al–Ti oxide system at the present period.
Calcium treatment is a very common countermeasure in steelworks in order to modify Al2O3 or spinel inclusions to liquid calcium aluminate inclusion, which can avoid or prevent the inclusions from clogging the nozzle, particularly in Al-killed steel production process.22,23,24) During past decades, a number of researches on the reaction mechanism, modification behavior and size distribution of nonmetallic inclusions in Al-killed steel during calcium treatment process have been widely conducted.25,26,27,28,29,30,31,32) However, few systematic reports have been published on the deoxidization, especially inclusion evolution by calcium and titanium complex treatment yet.33,34,35) Besides, the evolution process and phase stability of the inclusions in the melts are not clarified due to lack of exact thermodynamic calculation. Thus, it is of interest to explore the formation and evolution of Al–Ti–Ca–O complex inclusions in detail.
In current article, the melts containing different aluminum and calcium concentration were prepared to investigate the effects of titanium content on the characteristics of inclusion composition, morphology and size distribution in Al–Ti deoxidized melts with Ca-treatment, respectively. After titanium addition, the samples took from the melts at different time were analyzed by field emission scanning electron microscopy and energy dispersive spectroscopy. Meanwhile, the thermodynamics calculation on the phase stability of all inclusions at steelmaking temperature and during solidification process was discussed in the present work. The results were performed to discuss the modification process of inclusions. The purpose of current studies is providing a theoretical basis for the further industrial application of Al–Ti deoxidized steel calcium treatment.
The experiments were conducted in a tube furnace, the schematic of which is shown in Fig. 1. In each experiment, 350 g pure iron was contained in a alumina crucible (56 mm ID, 100 mm high) surrounded by a graphite protection crucible. The crucible was then placed into a vertical tube furnace and the master irons materials were heated to 1873 K. The high pure argon was introduced into the crucible, and the flow rate of which was kept constant (5.0 L·min−1) during all four experiments process with the aid of a flow meter. After melted, the melts were hold for half an hour at 1873 K to achieve sufficient homogenization. Thereafter, the dissolve oxygen content in the melt was measured before and after initial deoxidants (Al wires and Ca–Fe alloy) addition by using an electrolyte oxygen probe with an accuracy of ±1 ppm. The first sample was taken from the melts 10 min after initial deoxidants by a quartz tube and quenched in an ice bath. Then titanium was added into melts in the form of Ti–Fe alloy to increase the yield of titanium in molten steel. Subsequently, the melts were respectively held for 1 minutes and 10 minutes at 1873 K and then sampled by a quartz tube, followed by rapid quenching (Sample 2 to Sample 3). After each sample collected from the melt, the dissolve oxygen content was immediately measured as above. Experimental process is provided in Fig. 2. In all experiments, the content of aluminum, titanium and calcium in the steel were controlled by adding different masses of alloy. The compositions of raw materials contain pure iron, Al wires, Ti–Fe alloy and Ca–Fe alloy are shown in Table 1.

Schematic diagram of experimental furnace.

Melting and sampling sequences of the present experiments.
| Type | Fe | Ni | Ti | C | Si | Mn | Al | Ca | S | P | Others |
|---|---|---|---|---|---|---|---|---|---|---|---|
| Pure iron | 99.944 | – | – | 0.002 | 0.01 | 0.03 | 0.001 | – | 0.007 | 0.007 | 0.043 |
| Al wire | – | – | – | – | – | – | 99.99 | – | – | – | 0.01 |
| Ti–Fe alloy | 26.513 | – | 69.594 | 0.130 | 0.030 | 0.241 | 3.192 | – | 0.011 | 0.025 | 0.284 |
| Ca–Fe alloy | 69.82 | – | – | – | – | – | – | 30.10 | – | – | 0.08 |
The content of aluminum, titanium and calcium in the samples were determined by the inductively coupled plasma optical emission spectrometry (ICP–OES) with an accuracy of ±0.5 ppm. The total oxygen level was measured by the inert gas fusion–infrared absorptiometry technique with an accuracy of ±1 ppm. The quenched iron samples were cross–sectioned and polished, for analyzing the morphology and chemical composition of the inclusions by FE–SEM&EDS (Zeiss Ultra–Plus). The planar size distribution of particles in a polished cross section of each sample was measured in this work. Total observed area of each sample was 19.86 mm2 which corresponds to the 36 observation areas consisting of the continuous 6 observation areas to the horizontal direction and the continuous 6 observation areas to the vertical direction at the magnification of 500 by using a FE-SEM.
The measured compositions of aluminum, calcium, titanium and oxygen in the melts are listed in Table 2. It can be clearly seen that the dissolve oxygen content in steel decreases to about 5 ppm with Ca–Fe addition. Contents of [Al] and [Ca] are in the range of 0.025 to 0.082 and 0.0001 to 0.0017 pct. Therefore, the typical inclusions after Ca–Fe addition are solid and liquid calcium aluminate related to the addition amount of calcium, respectively. Melt A and Melt B have relatively higher calcium content than the other two melts, the typical inclusions of which are liquid calcium aluminate. The different quantity Ti–Fe alloy was added to the steel to investigate the evolution process of the inclusion in Al–Ca deoxidized Steel with different titanium content.
| No. | [Al] | [Ti] | [Ca] | [O] | T.[O] |
|---|---|---|---|---|---|
| A-1 | 0.025 | – | 0.0013 | 0.0005 | 0.0062 |
| A-2 | 0.022 | 0.0043 | 0.0011 | 0.0007 | 0.0047 |
| A-3 | 0.022 | 0.0037 | 0.0010 | 0.0006 | 0.0041 |
| B-1 | 0.036 | – | 0.0014 | 0.0005 | 0.0054 |
| B-2 | 0.035 | 0.0522 | 0.0017 | 0.0005 | 0.0049 |
| B-3 | 0.031 | 0.0483 | 0.0011 | 0.0006 | 0.0038 |
| C-1 | 0.076 | – | <0.0001 | 0.0006 | 0.0073 |
| C-2 | 0.079 | 0.0064 | <0.0001 | 0.0006 | 0.0067 |
| C-3 | 0.078 | 0.0059 | <0.0001 | 0.0004 | 0.0064 |
| D-1 | 0.081 | – | <0.0001 | 0.0003 | 0.0078 |
| D-2 | 0.077 | 0.0583 | <0.0001 | 0.0009 | 0.0074 |
| D-3 | 0.082 | 0.0614 | <0.0001 | 0.0006 | 0.0059 |
Previous researches have insisted that titanium has series of common oxidation state in steel production process, such as Ti2+, Ti3+, Ti4+.36,37,38) Therefore, the corresponding oxides (TiO, TiO2, Ti3O5, Ti2O3, Ti4O7) can be the products of deoxidation reaction. The titanium content and the oxygen partial pressure of steel influence significantly the type of titanium oxide. According to some previous research, the deoxidized product is usually Ti3O5 at the common content of titanium and oxygen in steel refining process.37,38,39) Thus, the phase diagram and liquid region of the Al2O3–Ti3O5–CaO system under the common oxygen partial pressure (PO2=10−12 atm) was calculated by using thermochemical software (FactSageTM 7.0), as shown in Fig. 3. It is shown that a very small amount of Ti-containing oxide strongly influences the position of liquid phase, indicating that liquid phase can be easily shrinked by the present of TiOx. To assess the modification process of inclusions, the analysis results of inclusions composition in each experimental melts after titanium addition for 1 or 10 min were converted into mass percentage of Ti3O5, CaO and Al2O3, which were then projected into the calculated Al2O3–Ti3O5–CaO ternary system phase diagram, as also given in Fig. 3. And the size distributions of the inclusions in all samples are shown in Fig. 4.
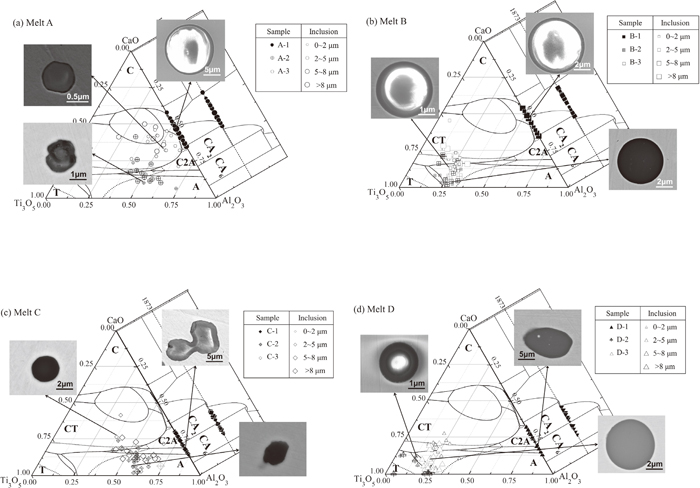
Composition distributions (mass fraction) of typical inclusions in the melts. Solid lines represent the boundary line of primary crystalline regions, and dotted lines represent the liquidus line at 1873 K. (C: CaO, T: Ti3O5, A: Al2O3, CT: Ca3Ti2O6, CA2: CaAl4O7, CA6: CaAl12O19).

Size distribution of the observed inclusions in all samples.
It can be seen that most of the inclusions in sample A-1 are spherical calcium aluminates, the compositions of which concentrate in or around the low melting point region in the ternary phase diagram after addition of initial deoxidants (aluminium wire and calcium iron alloy). After Ti–Fe alloy addition, the inclusions are mainly irregular calcium aluminates with a small amount of TiOx, as shown in Fig. 3(a). The effect of titanium on increasing the number of inclusions in Al–Ca deoxidized melts is obvious. The number increases gradually from 41 to 68/mm2 with Ti–Fe addition, and the size of inclusions drops to below 5 μm (showing in Figs. 3(a) and 4). Owing low titanium concentration (0.004%) in melt A, TiOx concentration in inclusions can reach to a level lower than 40%. Therefore, the compositions of inclusions in melts A locate outside the low-temperature liquid region of phase diagram.
Before titanium addition, most of the inclusions in sample B-1 are also spherical in shape owing to the fact that these inclusions are liquid at steelmaking temperature (showing in Fig. 3(b)). The inclusions in sample B-1 have a relatively large size (>5 μm). It also exists in sample B-2 and B-3 that typical inclusions after the titanium addition are similar in morphology to the inclusions observed earlier except for their higher titanium content, as indicated in Fig. 3(b). Furthermore, as shown in Figs. 3(b) and 4, titanium has some beneficial effect on reducing the size of inclusions in the melts at the initial stage. This trend is the same as melt A, however, it shows no significant trend at later stage, as shown in Fig. 4.
Due to low calcium concentration in melt C, a number of irregular shape inclusions can be observed in sample C-1. In addition, the compositions of the inclusions in sample C-1 are all located in solid calcium aluminates region of phase diagram. The solid phase inclusions in sample C-1 have a smaller size than sample A-1 and B-1. After titanium alloy added to the melt, the composition distributions of the inclusions are parallel to the direction of pure alumina. Meanwhile, the compositions of the inclusion in the melt show a more dispersed distribution, and less TiOx content of complex inclusions are formed in melt C with the extending holding time.
As can be seen, typical irregular shapes Al2O3–CaO type complex oxides after Al–Ca complex deoxidation are shown in Fig. 3(d). After Ti–Fe alloy addition, the compositions of the inclusions in sample D-2 and D-3 move into the liquid region of the phase diagram. However, it can be clearly seen that the inclusions are not homogeneous. As time goes by, a large number of homogeneous inclusions are formed at the last stage. In addition, the number of inclusion in D-3 is less than D-2 probably because of collide and aggregation.
Figures 5 and 6 are elemental mapping of typical inclusions after addition of Ti alloy in the melt A, melt B and melt D. It is obvious that the aluminum, titanium, calcium and oxygen element distribution of the inclusions are evenly distributed in sample A-2 and B-2. Therefore, the current results suggest that titanium promptly reacts with inclusion to generate titanium–calcium aluminate type inclusion after addition of Ti–Fe alloy in the molten steel. However, it can be clearly seen in Fig. 6 that the titanium–calcium aluminate inclusions in sample D-2 are not homogeneous. The multilayer inclusion is composed of a calcium aluminate core phase and a titanium–calcium aluminate outer layer phase as shown in Fig. 6. Therefore, it indicates that the reaction rate of modifying solid calcium aluminate is relatively slower than the liquid ones.
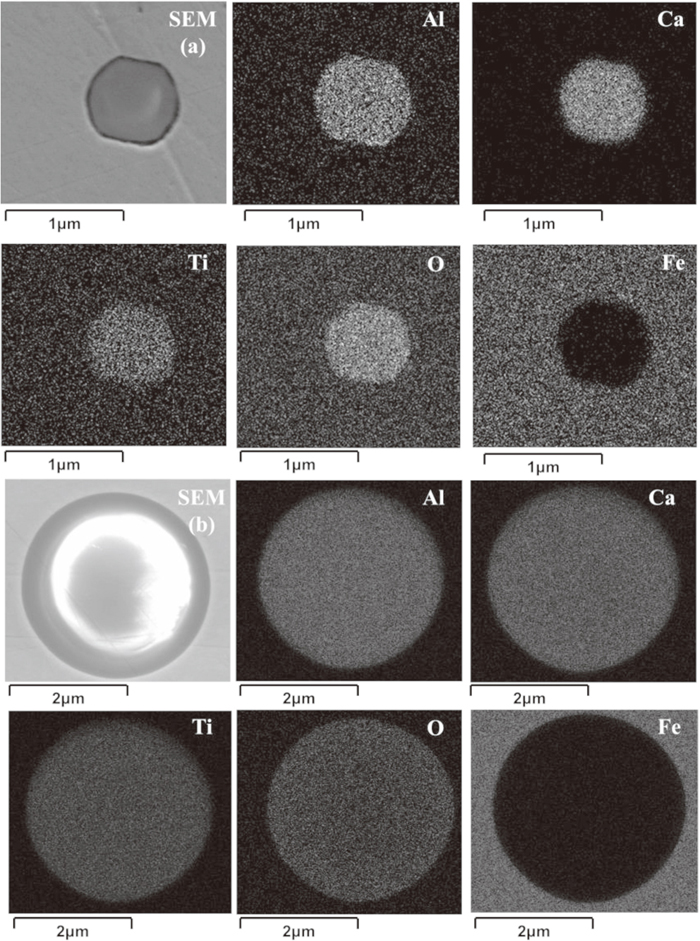
Elemental mapping of typical Al2O3–TiOx–CaO liquid inclusions (a) solid phase inclusion in sample A-2 (b) liquid phase inclusion in sample B-2.

Elemental mapping of typical Al2O3–CaOx–riching complex phase inclusion in sample D-2.
The thermodynamic calculations are very necessary to clarify the modification mechanism of Al–Ti–Ca–O complex inclusions. The stability diagram of the inclusions in molten steel has significant meaning not only in theoretical analysis but also in practical operations. Therefore, a phase stability diagram of Al–Ti–Ca–O system in molten steel at 1873 K has been calculated to predict the formation of inclusions in the present study. The thermodynamic calculation is based on the theory of minimum Gibbs free energy. The Gibbs free energy data of chemical reactions adopted in the present work is shown in Table 3.
| Eq. No. | Reaction | ΔG°/J·mol−1 | Ref. |
|---|---|---|---|
| 1 | Al2O3(s)=2[Al]+3[O] | 867500–222.5·T | 22 |
| 2 | CaO(s)=[Ca]+[O] | 138227+63.0·T | 40 |
| 3 | TiO2(s)=[Ti]+2[O] | −675600+234T | 44 |
| 4 | Ti2O3(s)=2[Ti]+3[O] | 822000–247.7·T | 43 |
| 5 | Ti3O5(s)=3[Ti]+5[O] | 1307000–381.8·T | 43 |
| 6 | Al2TiO5(s)= [Ti]+2[Al]+5[O] | 1435000–400.5·T | 16 |
| 7 | CaO·6Al2O3(s)=CaO(s)+6Al2O3(s) | 16380+37.58·T | 41 |
| 8 | CaO·2Al2O3(s)=CaO(s)+2Al2O3(s) | 15650+25.82·T | 41 |
| 9 | CaO·Al2O3(s)=CaO(s)+Al2O3(s) | 17910+17.38·T | 41 |
| 10 | 12CaO·7Al2O3(s)=12CaO(s)+7Al2O3(s) | −618000+612.1·T | 42 |
| 11 | 3CaO·Ti2O3(s)= 3CaO(s)+Ti2O3(s) | 192745(1873 K) | 45 |
| 12 | 3CaO·2TiO2(s)= 3CaO(s)+2TiO2(s) | 148365+24.14·T | 45 |
| 13 | CaO·TiO2(s)= CaO(s)+TiO2(s) | 74392+10.13·T | 46 |
It is known to us that aluminum has strong affinity with oxygen in liquid iron. Therefore, it is easy for the steel to take place the direct reaction between dissolved aluminum and oxygen after aluminum wire added in the melt, as shown in Eq. (1). When calcium-iron alloy is added to the melt, alumina can react with calcium to form CaO·6Al2O3 as shown in Eq. (14). This reaction is determined by linear combination from Eqs. (1), (2) and (10) (showing in Table 3).
| (14) |
If the calcium content of the melts is high enough, the following reaction occurred in the melts, as shown in Eq. (15).
| (15) |
Referring to relative phase diagram, 12CaO·7Al2O3 is only one kind complete liquid phase in Al–Ti–Ca–O system at 1873 K. So this phase is selected as the liquid phase for the calculation of phase stability between other solid phases (e.g. Al2O3, Ti2O3, Ti3O5, CaO·TiO2, 3CaO·2TiO2, 3CaO·Ti2O3, CaO·6Al2O3, CaO·2Al2O3 and CaO), and the phase diagram is also calculated using Eqs. (16), (17), (18), which is relate to the formation of calcium titanates.
| (16) |
| (17) |
| (18) |
Table 4 presents the corresponding interaction coefficients adopted in the present work. The stability diagrams of inclusion in Fe–Al–Ti–Ca–O melt at 1873 K have been calculated using the above thermodynamic data and equations, as a function of mass percent of calcium and aluminum in molten steel, as shown in Fig. 7. It is shown in Fig. 7(a) that CaO, CaO·2Al2O3 (CA2), CaO·6Al2O3(CA6) and liquid calcium-aluminates are main phase in molten steel with calcium and aluminium concentration ranging from 10−5 to 0.01%, 10−4 to 1%, respectively.
| i | j | k | i | j | k | ||||||
|---|---|---|---|---|---|---|---|---|---|---|---|
| O | Al | Ca | −3.953) | −0.0154) | 053) | Al | Al | O | 0.04357) | −0.00156) | −0.02858) |
| Ti | – | Ca | O | −0.04758) | 060) | 060) | |||||
| O | 47.4553) | Ti | – | 0.00452) | – | – | |||||
| Ca | Al | −31040) | −1798440) | 060) | O | Al | −1.9858) | 39.8254) | −0.02858) | ||
| O | 51990362) | Ca | 060) | ||||||||
| Ti | O | −0.3438) | 0.03147) | 0.02636) | Ca | Al | – | −0.07251) | 0.000740) | – | |
| O | Al | −0.2057) | 061) | 47.4554) | Ca | O | −0.00255) | – | −9022740) | ||
| Ca | 52000055) | Ti | – | −0.1333) | – | – | |||||
| Ti | Al | – | 0.003748) | – | – | O | Ca | −58040) | 65012954) | −9005654) | |
| Ti | O | 0.04249) | −0.00150) | 0.2036) | – | ||||||
| O | Ti | −3.438) | −0.035536) | 0.2036) | |||||||

Calculated inclusion stability diagrams in the Al–Ti–Ca–O system at 1873 K with experimental data (a) [Ti] = 0, (b) [Ti] = 0.005% and (c) [Ti] = 0.05%. Numbers adjacent to each line represent equilibrium oxygen content (in ppm) in liquid steel.
However, it is clearly shown in Fig. 7(b) that the stability region of calcium titanates (CT) arises while that of liquid calcium aluminates (LCA) significantly decreases, when the titanium content in the molten steel is 50 ppm. Titanium has significant influence on stable phase diagram, and it means that the calcium aluminate stability region becomes narrower with titanium content increases. If the titanium content increases to 0.05% or even more, the liquid phase stability areas remains greatly decreasing while solid calcium titanates phases (CT) increase as shown in Fig. 7(c). The chemical compositions of the experimental melts listed in Table 2 are also plotted in Fig. 7. It can be easily seen that the equilibrium relation calculation in the present work shows a good agreement with the experimental data of Seo et al.,33) Zheng et al.,34) Kimura et al.63) and Inoue et al.64) in the previous work. Therefore, Al–Ti–Ca–O phase diagram can be used to evaluate the change process of oxide inclusion effectively.
Due to rapid cooling rate, a number of significant transformation information during the solidification process is ignored in this work. Therefore, equilibrium precipitations of inclusions during solidification process are calculated by using Factsage 7.0 to investigate the transformation mechanism of the Al–Ti–Ca–O inclusion, as shown in Fig. 8. The steel compositions of Fe–0.01Al–Ti–0.002Ca–0.005O in mass pct were calculated. When [Ti]=0, there are only liquid calcium aluminate inclusions at steel-making temperature. During solidification of the steel, the transformed sequence of oxide inclusions is liquid inclusion, CaO·Al2O3 and CaO·2Al2O3. In the steel containing 0.008% titanium, the liquid phase just exists at higher temperature (>1873 K) in the molten steel. As the temperature decreases, it is more easily to precipitate other calcium aluminate phase. In addition, a small amount of solid calcium titanates phase precipitates during the solidification process of steel. However, with the increasing of titanium content, more liquid inclusions begin to precipitate during solidification process of the steel, until the solid calcium aluminate phase disappears at [Ti]=0.05%. As the titanium content increases from 0.05% to 0.2%, the formation temperature of calcium titanates decreases gradually, and it indicates the main phase in the steel is only liquid phase. If the titanium content of steel reaches to 0.2%, Ti2O3 phase will precipitate during the solidification process of steel, however, the calcium titanates phase still precipitates before the Ti2O3 phase.

Equilibrium precipitation of inclusions during solidification for steel of composition: Fe-0.01Al-0.002Ca-Ti-0.005O in mass pct: Ti = 0, Ti = 0.008%, Ti = 0.05%, and Ti = 0.2%.
According to the results of thermodynamic calculation at steelmaking temperature and in solidification process in Al–Ti–Ca–O inclusion system, it can be summarized that appropriate titanium addition is necessary to modify inclusions to liquid inclusion. In the present calcium treatment level, higher content is more easily to obtain the liquid phase inclusion.
The effects of titanium on the evolution of inclusions in Al–Ti–Ca deoxidized melts have been determined by the chemical experiments and thermodynamics calculations at different temperature. The main findings can be summarized as follows.
Titanium exerts a large influence on the morphology, size distribution and composition of inclusions in Al–Ca deoxidized melts, however, inadequate TiOx concentration in complex inclusions can rise the melt point of the inclusions, and then reduce the calcium treatment effect. Based on thermodynamic calculations at steelmaking temperature and during the solidification process, higher titanium content in the melts is more easily to get the liquid phase inclusion in the present calcium treatment level. Liquid oxides were modified promptly by titanium. Meanwhile, titanium can also modify solid calcium aluminate inclusions in the melts similarly, but there are unreacted calcium aluminate cores in the inclusions at the initial stage. Appropriate calcium addition could be beneficial to formation of liquid inclusions. Therefore, as for the production practice, both the addition amount of calcium and titanium should be considered simultaneously during the production process.
The authors wish to thank the National Natural Science Foundation of China (No. 51374059 and No. 51374060) and the Fundamental Research Funds for the Central Universities of China (No. N120602005) for their financial support for the current study.