Abstract
An numerical model for the bubble behavior of disintegration and dispersion is developed by using the model of Euler two-phase flows coupled with the bubble population balance model (BPBM). The gas volume fraction, and bubble size distribution are investigated under different stirring modes and gas flow rates. The results show that bubble behavior of disintegration and dispersion is the best under the clockwise-anticlockwise stirring mode (C-ARM), where effects of impeller rotating speed on the bubble behavior of disintegration and dispersion are different under different stirring modes. The excessive increasing in gas flow rate is not helpful for bubble behavior of disintegration and dispersion, while the gas holdup increases gradually and the mixing time increases rapidly with increasing the gas flow rate. The impeller under C-ARM with 2 rad/s for 2 s switching and the gas flow rate not exceeding 2.0 Nm3h−1 are recommended to use for the present system, which can optimize the bubble behavior of disintegration and dispersion in the most space of ladle except for the bottom one. Moreover, numerical results show a good agreement against experimental ones.
1. Introduction
The magnesium desulfurization for the refining process in the iron and steel industry gains intensive attention as the increasing demand for high quality and ultra-low sulfur steel. In the desulfurization reaction of magnesium injection method, the mass transfer between sulfur in the hot metal and magnesium is the rate-controlling step, which will inhibit the desulfurization reactions.1,2) Therefore, the desulfurizer waste and the low efficiency of desulfurization are critical problems in the desulphurization process using injection magnesium method.3,4,5) The injected bubbles are large in size and concentrate on the partial space around the nozzle when the conventional injection method is applied. The injected bubbles go up rapidly in the hot metal without adequate contacting with the hot metal, which results in the desulfurizer waste and low desulfurization efficiency in the deep desulphurization process. Therefore, the key way to improve desulfurization efficiency is how to disintegrate and disperse the large bubbles in the desulfurization process.
So far, the improving on injection operation parameters,6,7) the structure of nozzles,8,9) and the injection location10) has been carried out, while its effect on disintegration and dispersion of desulfurizer bubbles is still not obvious. To overcome this difficulty, a new method was proposed to disintegrate bubbles and accelerate the mixing of hot metal with desulfurizer, in which the gas injection is coupled with the mechanical stirring.11,12,13,14) The stirring-injection method was investigated under different impeller types and different stirring patterns in water model experiments.11,12,13,14) But a systematical numerical model has not yet been developed to describe the bubble disintegration and dispersion in the stirring-injection system. In fact, structures of the two-phase turbulent flow is complex, and the bubble behavior of disintegration and dispersion evolves dynamically with stirring-injection modes in the stirring-injection system. Moreover, bubble sizes and their distribution affect largely the gas-liquid contact and the desulfurization efficiency, while a single bubble size has been used instead of using the multiple bubble size in existing CFD simulations for gas-liquid flows,6,11,13,14) which may result in a deviation with the actual processes. Therefore, it is needed to develop a numerical model to treat correctly the bubble sizes distribution for the stirring-injection system.
Recently, the bubble population balances model (BPBM) has been applied widely in gas-liquid flows in chemical reactors, which provides a better describing to the complex industrial flow systems. In the present work, a numerical model has been developed by using the BPBM to predict the bubble behavior of disintegration and dispersion in the stirring-injection system.15,16,17) The effects of stirring mode, rotation speed, and gas flow rate on the bubble behavior of disintegration and dispersion in the stirring-injection system will be investigated using a new type of impeller, and a optimal operating will be proposed as well within the scope of this study.
2. Model Formulation
The BPBM is an effective method for predicting the bubble size distribution, including breakup and coalescence effects. In this work, the multiple size group equation of BPBM is coupled with the Euler model of two-phase flow to deal with the two-phase flows, in which the dispersed phase features a large variation in its characteristic sizes.
2.1. Euler Multiphase Hydrodynamic Equations
The model equations for the liquid and bubbles are derived based on the assumption that both phases could be described as continua. Therefore, the whole system is considered as the “Euler model”.
Mass conservation equation,18)
|
∂(
α
q
ρ
q
)
∂t
+∇⋅(
α
q
ρ
q
U
q
)=0,
| (1) |
where,
ρq,
αq, and
Uq are the density, volume fraction, and averaged velocity of liquid phase (
q=
l) and gas phase (
q=
g), respectively.
Momentum conservation equation,19)
|
∂(
α
q
ρ
q
U
q
)
∂t
+∇⋅(
α
q
ρ
q
U
q
U
q
)
=-
α
q
∇P+∇⋅(
α
q
μ
eff
(∇
U
q
+
(∇
U
q
)
T
)
)
+
α
q
ρ
q
g+
R
q
,
| (2) |
where
P is the pressure,
μeff is the effective viscosity,
g is the gravitational acceleration,
Rq is the inter-phase momentum exchange item.
The effective viscosity μeff includes the μeff,l and μeff,g, which is the effective viscosity of liquid phase and gas, respectively. The effective viscosity of the liquid phase μeff,l is composed of three contributions, which are the molecular viscosity μl, the turbulence viscosity μt, and an extra term due to bubble induced turbulence μBl, respectively.
|
μ
eff,l
=
μ
l
+
μ
t
+
μ
Bl
,
| (3) |
|
μ
t
=
c
μ
ρ
l
k
2
ε
,
| (4) |
The model proposed by Sato and Sekiguchi
20) is used to take account of the turbulence induced by the bubble movement.
|
μ
Bl
=
ρ
l
C
μ,Bl
α
g
d|
U
l
-
U
g
|,
| (5) |
where
k and
ε are the turbulence kinetic energy and its rate of dissipation, respectively.
Cμ and
Cμ,Bl are the empirical constant, and
d is the bubble diameter.
The effective gas viscosity is calculated using the following equation,21)
|
μ
eff,g
=
μ
eff,l
ρ
g
ρ
l
,
| (6) |
The turbulent kinetic energy k and its energy dissipation rate ε are calculated using the following equations,22)
|
∂
∂t
(
α
l
ρ
l
k)+∇⋅(
α
l
ρ
l
U
l
k)
=∇⋅(
α
l
μ
t
σ
k
∇k
)
+
α
l
G
k
-
α
l
ρ
l
ε+
α
l
ρ
l
k,
| (7) |
|
∂
∂t
(
α
l
ρ
ε
l
)+∇⋅(
α
l
ρ
l
U
l
ε)
=∇⋅(
α
l
μ
t
σ
ε
∇ε
)
+
α
l
ε
k
(
C
1ε
G
k
-
C
2ε
ρ
l
ε)+
α
l
ρ
l
ε,
| (8) |
where the standard values are used for the turbulence parameters:
C1ε=1.44,
C2ε=1.92,
Cμ=0.09,
σk=1.0,
σε=1.3,
Gk is the additional turbulent kinetic energy induced by bubbles, which is modeled according to the work of Elgobashi and Rizk.
22)
The interfacial momentum transfer between two phases has a dominant effect in the multi-phase momentum equations. The total interfacial forces can be categorized into drag force RD, lift force RL, virtual mass force RVM, and turbulence dispersion force RTD. The interfacial force between the two phases Rq is given as follows,
|
R
q
=
R
lg
=-
R
gl
=
R
lg
D
+
R
lg
L
+
R
lg
VM
+
R
lg
TD
.
| (9) |
The drag force RD is calculated as follows,
|
R
lg
D
=-
R
gl
D
=
3
4
ρ
l
α
g
C
D
d
|
U
l
-
U
g
|(
U
l
-
U
g
),
| (10) |
where
CD is the drag coefficient, which is obtained by the Schiller and Naumann model,
23)
|
C
D
={
max(
24
Re
b
(1+0.15
Re
b
0.687
),0.44
)
,
Re
b
≤1 000
0.44,
Re
b
>1 000
,
| (11) |
Where
Re
b
=
ρ
l
d|
U
l
-
U
g
|
μ
l
.
The lift force RL is calculated as follow,
|
R
lg
L
=
C
L
α
g
ρ
l
(
U
g
-
U
l
)×(∇×
U
l
),
| (12) |
where
CL is the lift force coefficient, which exerts the effect of the shearing motion in the liquid phase on the movement of the gas phase, and
CL is set as 0.5 according to Drew and Lahey
24) in present work.
The virtual mass force accounts for the additional work performed by bubbles in accelerating the liquid surrounding the bubble. The acceleration of the liquid is taken into account through the virtual mass force, which is given by
|
R
lg
VM
=
α
g
ρ
l
C
VM
D
Dt
(
U
l
-
U
g
),
| (13) |
where the virtual mass force coefficient
CVM is taken to be 0.5 for bubbles according to Liu’s work.
25)
The turbulent dispersion force results in an additional dispersion of phases from high volume fraction regions to low volume fraction regions due to turbulent fluctuations, which is given based on the Favre Averaged Drag Model,26)
|
R
lg
TD
=
C
D
C
TD
μ
t,g
σ
t,g
(
∇⋅
α
l
α
l
-
∇⋅
α
g
α
g
)
| (14) |
where
CTD and
σt,g are the turbulent dispersion coefficient and the turbulent Schmidt number of the gas phase, respectively. By default, the turbulent dispersion coefficient
CTD=1 and the turbulent Schmidt number
σt,g=0.9 are adopted.
25,26)
2.2. Bubble Population Balance Model
The bubble population balance model is a statistical formulation to describe the size distribution of non-uniform bubble in multiphase flow, which can be expressed as follow,17,27,28,29,30,31,32)
|
∂n(d,t)
∂t
+∇(
U
b
n(d,t))=
B
c
(d,t)
+
B
b
(d,t)-
D
c
(d,t)-
D
b
(d,t),
| (15) |
where
n(
d,
t) is defined as the density function of bubble number,
Ub is the bubble velocity, which can be calculated by the Euler two-phase flow model, where
Bc(
d,
t) and
Dc(
d,
t) are the velocity functions of bubble generation and disappearance in the bubble coalescence process, respectively, and
Bb(
d,
t) and
Db(
d,
t) are the velocity functions of bubble generation and disappearance in bubble breakage process, respectively. Reliable bubble models for coalescence rate and breakup rate are needed for the closure of model (15). The specific expressions are as follows based on the bubble-eddy collision mechanism,
17,29,30)
|
B
b
(d,t)=
∫
d
∞
n(
d
′
,t)
⋅
a
b
(d,t)⋅
b
b
(d,
d
′
,t)d
d
′
,
| (16) |
|
D
b
(d,t)=n(
d
′
,t)
a
b
(d,t),
| (17) |
|
B
c
(d,t)=
1
2
∫
0
d
a
c
(d,
d
′
,t)n(
d
′
,t)n(d,t)d
d
′
,
| (18) |
|
D
c
(d,t)=
∫
0
∞
a
c
(d,
d
′
,t)n(
d
′
,t)n(d,t)d
d
′
,
| (19) |
where the
ab(
d,
t) and
ac(
d,
d′,
t) are breakage rate function of bubbles and coalescence rate function of bubbles with size
d and size
d′, respectively.
bb(
d,
d′,
t) is the size distribution of daughter bubble form size
d to size
d′. To solve
Eq. (15),
ab(
d,
t),
bb(
d,
d′,
t), and
ac(
d,
d′,
t) are needed, which can be expressed as follows,
27)
|
a
b
(d,t)=
∫
0
1/2
b(
f
v
|d)
d
f
v
,
| (20) |
|
b
b
(d,
d
′
,t)=
2b(
f
v
|d)
∫
0
1
b(
f
v
|d)
d
f
v
,
| (21) |
where
b(
fv|
d) is the breakup rate of bubble for size
d breaking with the breakup fraction
fv, which is based on Luo’ model
27) and calculated as follow,
|
b(
f
v
|d)
=0.923(1-
α
g
)n
(
ε
d
2
)
1/3
∫
ξ
1
(1+ξ)
2
ξ
11
/3
⋅exp(
-
12
C
f
σ
β
ρ
l
ε
2/3
d
5/3
ξ
11
/3
)
dξ,
| (22) |
where
ε is the energy dissipation rate, and
ξ=
d
d
′
.
The coalescence rate of bubble can be expressed as follow based on Luo,27)
|
a
c
(
d
′
,
d
″
,t)=
∫
λ
d
ω
c
(
d
′
,
d
″
,t)⋅
p
c
(
d
′
,
d
″
,t)dλ
,
| (23) |
where
λ is the volume of turbulent eddy,
ωc(
d′,
d″,t) and
pc(
d′,
d″,
t) are the collision frequency and coalescence efficiency, respectively. The functional form of collision rate due to fluid turbulence is given as follow,
|
ω
c
(
d
′
,
d
″
,t)=
π
4
(
d
′
+
d
″
)
2
(
d
′
2/3
+
d
″
2/3
)
1/2
2
ε
1/3
| (24) |
|
p
c
(
d
′
,
d
″
,t)=exp(
-
t
d
′
d
″
τ
d
′
d
″
)
=exp(
-
C
e
W
e
d
′
d
″
1/2
[
0.75(1+
ξ
d
′
d
″
2
)(1+
ξ
d
′
d
″
3
)
]
1/2
(
ρ
g
/
ρ
l
+
C
VM
)
(1+
ξ
d
′
d
″
)
3
)
| (25) |
where
τd′d″ and
td′d″ are the bubble contact time and bubble coalescence time, respectively.
Ce is a model parameter of order unity which is set as 1.0.
27,31) Wed′d″ is the Weber number which can be written as =
We
d
′
d
″
=
ρ
l
d
′
(
u
d
′
2
+
u
d
″
2
)
σ
,
ξ
d
′
d
″
=
d
′
d
″
, and
CVM is the virtual mass coefficient, which is set as 0.5 in this work.
33)
3. Numerical Details
In this work, the fluent 14.0 is used to simulate gas and liquid two-phase flows in the stirring-injection system. Based on the experience25) that bubble Sauter diameter predicted does not depend on the group number when the group number is larger than ten, ten bubble groups with uniform increment ranging from 1 to 11 mm are specified for the dispersed phases under C-ARM and C-VRM in the BPBM, and ten bubble groups with uniform increment ranging from 1 to 15 mm are specified for the dispersed phases under C-CRM in the BPBM. The BPBM is explicitly resolved as source terms within the transport equations. In order to compare the simulation results with the ones of water model experiment, the material properties and boundary conditions were set corresponding to the water model.
A velocity inlet boundary condition is used at the outlet of the nozzle, and the gas phase volume fraction at the nozzle is defined as 1. The initial bubble size is set to be 0.011 m based on the experiment, and the exit is designed on the upper ceiling of the vessel as the degassing boundary condition, where dispersed bubbles are permitted to escape, but the liquid is not permitted to escape. The density of nitrogen is used with a constant density. The vessel wall is defined as no slip wall, and the scalable wall function is adopted for the close-to-wall area. The conservation equations are discretized using the control volume technique. The velocity-pressure linkage is handled through the BPBM procedure. The hybrid-upwind discretization scheme is used for the convective terms. A fixed physical time step of 0.001 second is adopted for all steady state simulations.
4. Experimental Details
In order to measure the bubble behavior of disintegration and dispersion inside the vessel and validate the mathematical model, a water model is established. The water model is a cylindrical vessel contained with a lance which is a disc impeller with injection role. The slope angle of disc impeller is taken as 10 degree based on the experimental optimizing.13) The sizes of water model and other parameters adopted in the present model are listed in Table 1. The nitrogen is injected into the shaft of the disc impeller and is jet out from the nozzle at the bottom of the disc impeller. When bubbles rise, the disc impeller can disintegrate bubbles and prevent bubbles from rising rapidly. The vessel and the disc impeller are shown in Fig. 1. The stirring modes employed include the clockwise-anticlockwise rotation mode (C-ARM), the clockwise variable-speed rotation mode (C-VRM), and the clockwise constant-speed rotation mode (C-CRM). The variable-speed stirring modes are shown in Fig. 2. The switch time of variable-speed is set as T. The disc impeller rotates at angular velocities of N1 and N2 in the former T/2 and the later T/2, respectively. The range of rotation speed adopted is 0.5–2.5 rad/s. Once the liquid surface reaches a steady state, the distribution of gas and bubble sizes is visually captured by a high-speed camera. Then, the location and size of bubbles are measured through the image analysis software of ImageJ. In the present work, the ImageJ is used to extract the dimensions from a digital image of disjoint bubbles after identifying their shapes and to measure the bubble size distribution. Finally, the measured data of mean bubble diameters are used as the source input in the mathematical model.
Table 1. Sizes of water model and other parameters.
| Parameter | Value |
|---|
| Diameter of vessel (m) | 0.44 |
| Height of vessel (m) | 0.5 |
| Height of level (m) | 0.37 |
| Distance from impeller bottom to vessel bottom (m) | 0.09 |
| Nozzle diameter (m) | 0.002 |
| Distance from nozzle to vessel bottom (m) | 0.06 |
| Diameter of disc-impeller (m) | 0.14 |
| Blade high (m) | 0.06 |
| Blade length (m) | 0.04 |
| Gas flow rate (Nm3h−1) | 0.1–2.3 |
5. Results and Discussions
The impeller stirring coupled with the gas injection affects the magnesium desulfurization process in part through its influence on the gas-liquid flow pattern. The extent of this effect depends on both the stirring mode of impeller and the gas flow rate, which is expressed through the gas volume fraction and the bubble size distribution.
5.1. Effect of Stirring Mode on Bubble Distribution
Three stirring modes are adopted, including the C-ARM for 2 s switching at speed of 1.8 rad/s, the C-VRM for 2 s switching at speed of 0.5–2.3 rad/s, and the C-CRM at speed of 1.8 rad/s. The gas flow rate is 1.5 Nm3h−1. Figures 3, 4, 5 show the gas volume fraction distribution and the flow field structure of the fluid under C-ARM, C-VRM and C-CRM, respectively. Figures 6, 7 show the turbulence kinetic energy and turbulence dissipation of the fluid at different time under C-ARM and C-VRM, respectively. The bubbles disperse well in the vessel expect for the bottom when gas is injected from the nozzle under C-ARM. Some bubbles disperse near the wall, and other bubbles partly form a spiral flow upward to the top surface under C-VRM. Little bubbles break and disperse around the impeller when bubbles rise, while most of bubbles gather to the impeller shaft and form large bubbles escape rapidly to the liquid surface, and a big vortex appears at the liquid surface under C-CRM.

It can be seen from velocity vectors and the fluid flow pattern obtain from the experiment that the fluid field is chaotic and irregular, and the bubbles collide for each other, which makes bubbles to disintegrate and disperse under C-ARM and C-VRM. On the other hand, the fluid field has a symmetrical structure, when the bubbles raise from nozzle, the fluid wrap the bubbles move upward around the impeller and escape from liquid surface, which is not helpful for promoting the gas-liquid mixing at different regions under C-CRM.
The prediction of bubble size distribution in the vessel is essential to the understanding of bubble dispersion behavior in the stirring-injection process. Figure 8 shows the bubble Sauter diameter along the radius at 0.2 m away from the vessel bottom at time t=17 s obtained from the experiment and the simulation, and the operation conditions in Fig. 8 is the same with those in Figs. 3, 4, 5, 6, 7. The same time experimental photographs taken at the same condition are used to obtain the mean bubble diameter by using ImageJ. It can be seen that large bubbles appear in the area near the shaft and small bubbles occupy the area near the vessel wall. A clear difference in bubble size distribution is observed under three different stirring modes. The result shows that the big bubble disintegrates into many bubbles with varying sizes as they flow through the impeller under C-VRM and C-CRM. While most of bubbles are large, and the large bubbles gather nearby the impeller shaft and rise quickly to the surface due to the effect of buoyancy. Only a small amount of small bubbles are scatter toward the vessel wall under C-CRM. Bubble size distribution under C-ARM is more uniform and smaller than those under C-VRM and C-CRM. Thus, it can be conclude that the fluid has large turbulence kinetic energy and turbulence dissipation under C-ARM, which leads to the increasing in the bubble number and decreasing in the bubble size.

Figures 3, 4, 5, 6, 7, 8 show that bubble volume distribution pattern and bubble size distribution obtained from the simulation are reasonably agreed with those obtained from the experiment although there is slight deviation. The mechanism model of coalescence and breakup proposed Luo27) within the BPBM is adopted in the present work. The reason for the discrepancy has relation with the mechanism model of Luo, which considers only the bubble breakup induced by the collision between the turbulence vortex and bubbles as well as the bubble coalescence induced by the turbulence random collision, and the breakup rates induced by shearing and surface instability are not included in the mechanism model of Luo.
5.2. Effect of Rotation Speed on Bubble Distribution
In order to observe the bubble behavior of disintegration and dispersion at different rotation speeds in the injection-stirring system, the gas volume fraction distribution and bubble size distribution at different rotation speeds are investigated under three stirring modes. The effects of rotation speed on the gas volume fraction distribution and the bubbles Sauter diameter distribution are shown in Figs. 9 and 10, respectively, where the monitoring points are located at the radius direction from shaft to the wall and the height of the monitoring points are 0.2 m away from the bottom of vessel at the Y=0 cross section, and the gas flow rate is 0.9 Nm3h−1. The rotation speed changes from 1.67 rad/s to 2 rad/s with a increment of 0.17 rad/s under three stirring mode. Figure 9 illustrate that stirring mode has great impact on the uniformity of the gas volume fraction distribution. The gas volume fraction distribution are uniform under C-ARM, and the gas volume fraction fluctuate at different monitor point under C-VRM, while most of the gas volume fraction concentrates near the impeller shaft under C-CRM. There are some effects of rotation speed on the uniformity of the gas volume fraction distribution and the values of gas volume fraction. The values of gas volume fraction rise slightly and gas volume fraction distribution more uniformly with the increasing of rotation speed under C-ARM mode (Fig. 9(a)). Under the C-VRM mode (Fig. 9(b)), values of gas volume fraction rise slightly with the increasing of rotation speed when the distance from the nozzle is small than 80 mm, and the effect of rotation speed on the gas volume fraction distribution is not obvious when the distance from the nozzle is large than 80 mm. While the gas volume fraction concentrates to the impeller shaft rapidly as the increasing of rotation speed under C-CRM mode (Fig. 9(c)).


It can be seen from Fig. 10 that the maximum bubble size near the impeller shaft decreases gradually from 6.5 mm to 5 mm under C-ARM and from 8 mm to 6 mm under C-VRM as the rotation speed is increased, respectively. The location where the bubble size is maximum is 70 mm away from the impeller shaft at the rotation speed of 0.5–2.17 rad/s, which migrates to 40 mm away from the impeller shaft at the rotation speed of 0.5–2.5 rad/s under C-VRM. The area where the bubble sizes are small is increased when the rotation speed is increased under C-ARM and C-VRM. The bubble sizes under C-ARM are more uniform than those under the other modes at the same rotation speed. Therefore, the highly varying rotation speeds result in the increasing bubble numbers and the decreasing bubble sizes as the breakup rate of bubbles is larger than the coalescence rate of bubbles under C-ARM and C-VRM. However, a large amount of bubbles stay together, which results in a high gas holdup near the impeller shaft as the rotation speed is increased under C-CRM. Consequently, the bubble coalescence takes place, and large size bubbles are generated in this region under C-CRM mode.
5.3. Effect of Gas Flow Rate on Bubbles Dispersion
Three stirring modes are used including the C-ARM for 2 s switching at speed of 2 rad/s, the C-VRM for 2 s switching at speed of 0.5–2.5 rad/s, and the C-CRM at speed of 2 rad/s. Figures 11 and 12 illustrate the distribution of gas volume fraction at the gas flow rates of 2.0 Nm3h−1 and 0.7 Nm3h−1, respectively. It can be seen that the values of gas volume fraction increase intensively with increasing gas flow rate under C-ARM and C-VRM, which range from 0.1 to 0.28 at some area in the upper part of vessel when the gas flow rate is from 0.7 Nm3h−1 to 2.0 Nm3h−1 under C-ARM. While the uniformity of the gas volume fraction gets worse when the gas flow rate is increased under C-ARM and C-VRM. The gas volume fractions are 0.15 and 0.10 under C-ARM and C-VRM, respectively as the gas flow rate is 0.7 Nm3h−1, which are relatively uniform except for the area at the bottom and nozzle areas. On the other hand, the gas flow rate has small impact on the gas volume fraction under C-CRM.


Figure 13 illustrates the bubble size distributions at the different levels to vessel bottom. The gas flow rates is 0.7 Nm3h−1 for Fig. 13(a) and 2.0 Nm3h−1 for Fig. 13(b), respectively, and the rotation speed is 2 rad/s under C-ARM. Figure 13(a) shows that bubble Sauter diameters are in the scope from 6 mm to 2 mm at the 0.2 m level and 7 mm to 2.2 mm at the 0.36 m level, respectively, and the bubble Sauter diameters change slowly at the same vertical distance from vessel wall. The bubble sizes become large along the direction from wall to the impeller shaft and the range of bubble size is uniform at gas flow rate of 0.7 Nm3h−1. However, the range of bubble Sauter diameters changes intensively from vessel wall toward the impeller shaft as the gas flow rate is increased as can been seen from Fig. 13(b). Large bubbles concentrate to the shaft direction when bubbles rise up, so the wave crest of bubble diameters moves to the shaft. It indicates that with increasing the gas flow rate, a part of bubbles are disintegrated by the impeller stirring and move upward uniformly, however, the bubble coalescence also occurs during this process, while other part of bubbles are not disintegrated by the impeller stirring before they escape from the fluid.
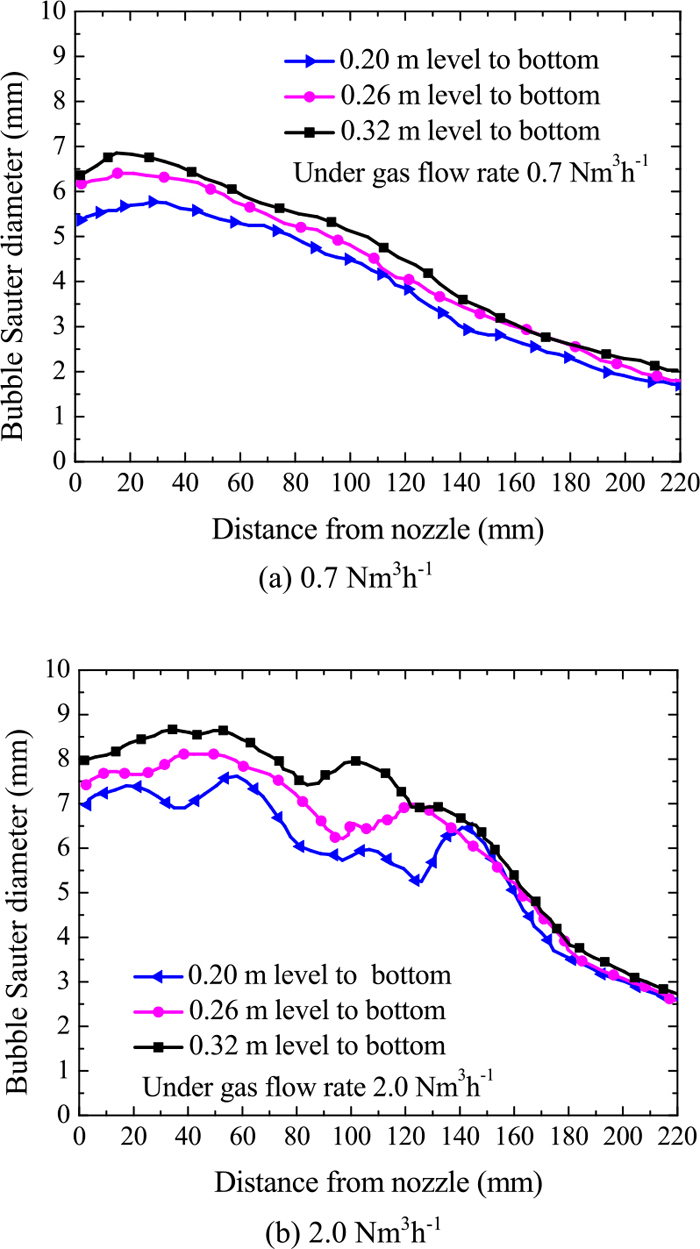
Figure 14 shows the percent of bubble Sauter diameter (D) at the vertical plane of the vessel, where the conditions adopted is the same with those of Fig. 13. The percent of bubble Sauter diameter has an increasing tendency with the increasing gas flow rate. The bubbles Sauter diameter percent with D=5 and D=6 mm reaches 42% at the gas flow rate of 0.7 Nm3h−1, which is 46% at the gas flow rate of 2.0 Nm3h−1. The proportion of bubbles with D=1 to D=4 mm decreases, which increases for bubbles with D=6 to D=8 mm at the gas flow rate of 2.0 Nm3h−1. As a result, the sizes of bubbles become more inhomogeneous as the gas flow rate increases. Therefore, increasing gas flow rate is not benefit for the bubble behavior of disintegration and dispersion.
5.4. Effect of Stirring Modes and Rotation Speeds on Bubble Dispersion Time
The mixing time refers to the time that the liquid surface reaches the steady state after the gas is injected into the vessel. Figure 15 shows the mixing time under the C-ARM and C-VRM with different rotation speeds, and the gas flow rate is 2.0 Nm3h−1. It can be find that the mixing time is shorter under C-ARM than that under C-RRM at the same rotation speed. The mixing time is short at a large rotation speed under the same stirring mode. The present results show that a fast disintegration and dispersion for bubbles can be achieved by increasing the rotation speed under C-ARM and C-VRM. It is appropriate to select the stirring mode of C-ARM with 2 rad/s for 2 s switching for the present system considering the factors such as the bubble size, the gas holdup distribution, and the bubble dispersion time.
6. Conclusions
The bubble behavior of disintegration and dispersion in the gas injection-stirring system is investigated using the Euler two-phase flow model coupled with BPBM. The effects of stirring mode, rotation speed, and gas flow rate on the bubble behavior of disintegration and dispersion are investigated. From the obtained results, the following conclusions can be drawn.
(1) A good agreement for gas volume fraction and bubble Sauter diameter is obtained between the BPBM predictions and the experimental measurements. The BPBM can be considered as a practicable approach for predicting bubble behavior of disintegration and dispersion in a stirring-injection vessel.
(2) The C-ARM mode is the best one for the bubble disintegration and dispersion under the same conditions. Bubbles are easy to gather together and to escape from fluid in the vessel, therefore, the disintegration and dispersion of bubbles get worst under C-CRM mode.
(3) The disintegration and dispersion of bubbles become better under the C-ARM and C-VRM when the rotation speed of impeller is increased. On the contrary, the disintegration and dispersion of bubbles become worse under the C-CRM.
(4) Increasing the gas flow rate can rise the gas holdup, but the gas holdup distribution and the sizes of bubbles become worse. Increasing the gas flow rate is not a desirable way to disintegrate bubbles.
Acknowledgement
The present work is supported financially by the National Natural Science Foundation of China under the grants of 51376040 and 51676031.
References
- 1) H. P. Sun, Y. C. Liu and M. J. Lu: Ironmaking Steelmaking, 37 (2010), 599.
- 2) G. A. Irons: Steelmaking Conf. Proc., 4 (1992), 255.
- 3) B. L. Sun, X. G. Chen and C. M. Zhang: J. Iron Steel Res., 15 (2013), 1.
- 4) W. Wu, Z. J. Han, Y. B. Hu and W. Wu: J. Univ. Sci. Technol. B, 15 (2008), 375.
- 5) J. B. Ruan and F. S. Zhang: J. Wuhan Univ. Technol., 27 (2004), 242.
- 6) J. Yang, M. Kuwabara, K. Okumura and M. Sano: Tetsu-to-Hagané, 92 (2006), 14.
- 7) H. Visser and R. Boom: ISIJ Int., 46 (2006), 1771.
- 8) W. L. Huang and L. P. Xu: Metall. Power, 170 (2014), 75 (in Chinese).
- 9) W. Wu, W. Wu, Y. B. Hu, L. Liu and Y. L. Ding: J. Iron Steel Res. Int., 15 (2008), 15.
- 10) E. Scheepers, J. J. Eksteen and C. Aldrich: Miner. Eng., 19 (2006), 1163.
- 11) R. Q. Liang, J. H. Ji and J. C. He: J. Iron Steel Res. Int., 18 (2011), 107.
- 12) Y. Liu, M. Sano, T. A. Zhang, Q. Wang and J. C. He: ISIJ Int., 49 (2009), 17.
- 13) Y. Liu, Z. M. Zhang, S. Masamichi, J. Zhang, P. Shao and T. A. Zhang: J. Iron Steel Res. Int., 21 (2014), 135.
- 14) P. Shao, T. A. Zhang, Z. M. Zhang and Y. Liu: ISIJ Int., 54 (2014), 1507.
- 15) J. M. Van Baten and R. Krishna: Chem. Eng. Technol., 27 (2004), 1302.
- 16) X. Sun, S. Kim, M. Ishii and S. G. Beus: Nucl. Eng. Des., 23 (2004), 3.
- 17) S. Kumar and D. Ramkrishna: Chem. Eng. Sci., 51 (1996), 1311.
- 18) F. Lehr, M. Millies and D. Mewes: Am. Inst. Chem. Eng., 48 (2002), 2426.
- 19) G. Montante, A. Paglianti and F. Magelli: Chem. Eng. Res. Des., 85 (2007), 647.
- 20) H. A. Jakobsen, B. H. Sannaes, S. Grevskott and H. F. Svendsen: Ind. Eng. Chem. Res., 36 (1997), 4052.
- 21) Y. Sato and K. Sekiguchi: Int. J. Multiphas. Flow, 2 (1975), 79.
- 22) S. E. Elgobashi and M. A. Rizk: Int. J. Multiphas. Flow, 15 (1989), 119.
- 23) L. Schiller and A. Naumann: Z. Ver. Dtsch. Ing., 77 (1933), 318.
- 24) C. Gentric, D. Mignon, J. Bousquet and P. A. Tanguy: Chem. Eng. Sci., 60 (2005), 2253.
- 25) Z. Q. Liu, L. M. Li, F. S. Qi, B. K. Li, M. F. Jiang and F. Tsukihashi: Metall. Mater. Trans. B, 46B (2015), 406.
- 26) A. D. Burns, T. Frank, I. Hamill and J. Shi: Proc. 5th Int. Conf. on Multiphase Flow, The Japanese Society for Multiphase Flow, Osaka, (2004).
- 27) H. Luo and H. Svendsen: Am. Inst. Chem. Eng., 42 (1996), 1225.
- 28) M. J. Prince and H. W. Blanch: Am. Inst. Chem. Eng., 36 (1990), 1485.
- 29) F. Lehr, M. Millies and D. Mewes: Am. Inst. Chem. Eng., 48 (2002), 2426.
- 30) M. Ishii, S. S. Paranjape, S. Kim and X. Sum: Int. J. Multiphas. Flow, 30 (2004), 779.
- 31) T. F. Wang, J. F. Wang and Y. Jin: Am. Inst. Chem. Eng., 52 (2006), 125.
- 32) J. Kumar, M. Peglow, G. Warnecke, S. Heinrich and L. Morl: Chem. Eng. Sci., 61 (2006), 3327.
- 33) M. R. Bhole, J. B. Joshi and D. Ramkrishna: Chem. Eng. Sci., 63 (2008), 2267.


