Note
Nitrogen Solubility in Mn–Si–Fe Melts
2017 Volume 57 Issue 4 Pages 764-766
Details
2017 Volume 57 Issue 4 Pages 764-766
Nitrogen solubility of two typical compositions of practical Mn–Si–Fe melts were measured by the gas-liquid metal equilibration technique in the range of 1673 to 1773 K under different nitrogen partial pressures, especially high nitrogen partial pressure close to pure nitrogen gas. It was found that nitrogen solubility increased as the increase of temperature but decreased as the increase of silicon content. The nitrogen partial pressure dependence of nitrogen solubility for 68 mass%Mn-18 mass%Si-Fe and 60 mass%Mn-30 mass%Si-Fe melts follows the Sievert’s law. Relative to pure Mn melt, which doesn’t obey the Sievert’s law, the increase of silicon or iron content in Mn–Si–Fe melts could decrease the deviation degree from the Sievert’s law. Silicon nitride precipitates were formed at the surface of the 60 mass%Mn-30 mass%Si-Fe melts at 1773 K when the nitrogen partial pressure is 0.4.
Si–Mn complex deoxidation is applied during the production of tire cord steels. It is required by the high grade steels that silicomanganese ferroalloy should have low Al and Ti contents, for example, less than 0.01 and 0.05 mass%, respectively.1) However, the current commercial silicomanganese ferroalloy products in China have high Al and Ti contents, which could not meet the technical requirements.2) A feasible method to remove Al and Ti from silicomanganese ferroalloy is to nitride Al and Ti by blowing N2 or gas mixtures containing N2 into the melts.3) As a fundamental data, nitrogen solubility of Mn–Si–Fe melts is significantly important for optimizing de-Al and de-Ti processes. Many investigations had been performed on the nitrogen solubility of liquid manganese4,5,6,7) and Mn–Fe6,7,8,9) melts. Mn–Si–Fe–C system and its sub binary and ternary systems containing Mn had been systematically studied by Kim et al.7) and Jang et al.10) Jang et al.10) measured the nitrogen solubility in Mn–Si melts (Si ≤ 21 mass%) and Mn–Si–Fe melts (Si ≤ 11 mass%, Fe ≤ 21 mass%) under the nitrogen partial pressure of 0.01 and 0.03 atm at 1673 and 1773 K, respectively. However, there was no nitrogen solubility data in Mn–Si–Fe melts (Si ≥ 18 mass%) at high nitrogen partial pressure. In the present study, nitrogen solubility of two widely used Mn–Si–Fe melts, Mn68Si18Fe (Mn ≈ 68 mass%, Si ≈ 18 mass%) and Mn60Si30Fe (Mn ≈ 60 mass%, Si ≈ 30 mass%), were measured by the gas-liquid metal equilibrium method at 1673 and 1773 K.
Master Mn–Si–Fe alloys were prepared by melting electrolytic manganese (99.99% purity), polycrystalline silicon (>99.99% purity) and electrolytic iron (99.99% purity) in a high purity SiO2 crucible (outer diameter: 40 mm, inner diameter [ID]: 30 mm, height: 100 mm) in Ar-3%H2 atmosphere using a vertical MoSi2 resistance furnace. Then, 50 g of alloys were weighed and placed in a SiO2 crucible for the experiment. In order to check the present measurement precision, nitrogen solubility of pure Mn melt was also measured in high purity alumina crucible and compared to the values from literatures. During the heating process, Ar-3%H2 mixture gas was used as protecting gas, and gas was switched to Ar-N2-3%H2 after reaching the desired temperature. The gas flow rates of Ar, N2 and H2 were controlled by the mass-flow controller. The total gas flow rate was 400 ml/min. Nitrogen partial pressure was selected as 0.4, 0.7 and 0.97 respectively. The smelting temperature was monitored by a Pt-6mass%Rh/Pt-30mass%Rh thermocouple and controlled within ± 1 K.
After being held for a certain time, quartz tube (ID: 4 mm) were used for sampling in the present study. The melts were sucked rapidly and quenched in water. Metal samples were prepared carefully for the chemical analysis. The nitrogen content was determined by the nitrogen/oxygen analyzer (LECO ONH-836 apparatus). Mn and Si contents in samples after experiments were measured by the perchloric acid oxidation titrimetric method and perchloric acid dehydration gravimetric method, respectively. The sample compositions were shown in Table 1.
| Temperature (K) | Nitrogen partial pressure (atm) | [mass%Mn] | [mass%Si] | [mass%N] | [mass%Fe] |
|---|---|---|---|---|---|
| 1673 | 0.4 | 68.33 | 18.27 | 0.0501 | Balance |
| 0.7 | 68.39 | 18.15 | 0.0647 | Balance | |
| 0.97 | 68.49 | 18.21 | 0.0748 | Balance | |
| 1773 | 0.4 | 68.68 | 18.39 | 0.0569 | Balance |
| 0.7 | 68.53 | 18.29 | 0.0761 | Balance | |
| 0.97 | 68.72 | 18.36 | 0.0909 | Balance | |
| 1673 | 0.4 | 59.85 | 30.15 | 0.0031 | Balance |
| 0.7 | 59.74 | 30.13 | 0.0043 | Balance | |
| 0.97 | 59.90 | 30.21 | 0.0049 | Balance | |
| 1773 | 0.4 | 59.92 | 30.24 | 0.0042 | Balance |
| 0.7 | 59.80 | 30.18 | 0.0055 | Balance | |
| 0.97 | 59.84 | 30.27 | 0.0062 | Balance |
Due to the high vapor pressure of manganese alloy melts, the nitrogen partial pressures over the Mn–Si–Fe melts surface were corrected in the following way as done by Kim et al.7) and Jang et al.10)
| (1) |
| (2) 7) |
In order to get the equilibrium value of nitrogen solubility, the equilibrium time should be determined in advance. Figure 1 shows the variation of nitrogen content with time in Mn68Si18Fe melt at 1673 K when the nitrogen partial pressure was 0.4. It could be seen that 6 h was sufficient to reach the gas-liquid metal equilibrium. In all the subsequent experiments, the equilibration time was set to be 6 h.

Variation of nitrogen content with time in Mn68Si18Fe melt at 1673 K.
Six samples (pure Mn, Mn68Si18Fe and Mn60Si30Fe at 1673 and 1773 K, respectively, when the nitrogen partial pressure was 0.97) were selected to study the influence of sampling method (rod samples and powder samples) on the measured nitrogen content. The corresponding results were shown in Fig. 2. It can be concluded that the there are no apparent differences between the measured results of rod samples and powder samples. In the following experiments, rod samples were used for analyses.

Effect of sampling method on the measured nitrogen content.
Figure 3 shows the nitrogen solubility of Mn–Si–Fe melts as a function of nitrogen partial pressure at 1673 and 1773 K. The hollow circular and triangular dots denoted the measured data for Mn68Si18Fe melts at 1673 and 1773 K, respectively, and the solid circular and triangular dots denoted the measured data for Mn60Si30Fe melts at 1673 and 1773 K, respectively. From Fig. 3, it can be seen that the nitrogen solubility of Mn–Si–Fe melts increases as the increase of temperature. Furthermore, nitrogen solubility of Mn60Si30Fe melts was lower than that of Mn68Si18Fe melts at the same temperature and the same nitrogen partial pressure. It had been proved that iron could decrease the nitrogen solubility of Mn–Fe melts.6,7,8,9) Since iron/silicon content in Mn60Si30Fe melts was small/larger than that in Mn68Si18Fe melts, it could be concluded that the smaller nitrogen solubility of Mn60Si30Fe melts is due to its high silicon content. In other words, the nitrogen solubility of Mn–Si–Fe melts decreases as the increase of silicon content. Similar phenomenon was also found in the work of Jang et al.10)
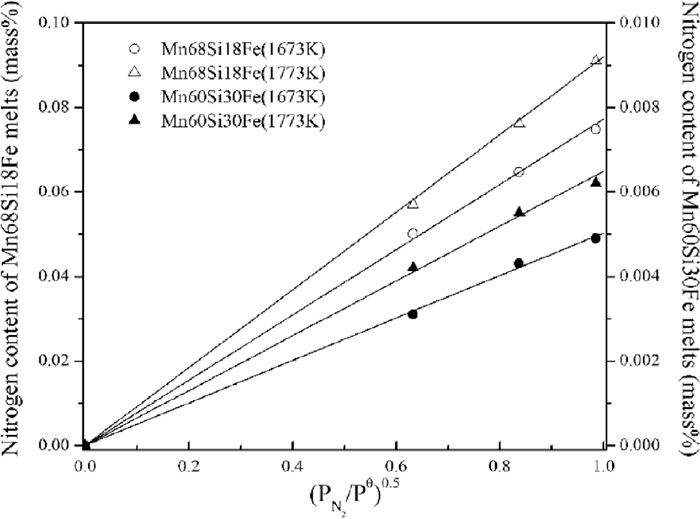
Effect of nitrogen partial pressure on the nitrogen solubility in Mn–Si–Fe melts.
The dissolution of nitrogen in liquid manganese could be represented as
| (3) |
| (4) 7) |
The nitrogen solubility of Mn–Si–Fe melts could be calculated according to Eqs. (5) and (6) using the thermodynamic parameters given by Kim et al.7) and Jang et al.10) It should be noted that the parameters in Eq. (6) are applicable in molten manganese.
| (5) |
| (6) |
Figure 4 shows the comparisons of calculated values with measured values by present study. It shows that the parameters suggested by Jang et al.10) are fit for manganese and Mn68Si18Fe melts, but not suitable for Mn60Si30Fe melts, since the composition of Mn60Si30Fe melt is out of the composition range used for model optimization by Jang et al.,10) as mentioned in the introduction part. Figure 5 gives the image of silicon nitride found in the surface of Mn60Si30Fe melts at 1773 K when the nitrogen partial pressure was 0.4. It was found that silicon nitride precipitates were formed at the surface of Mn60Si30Fe melt, which means that the melt was saturated with silicon nitride after reaching the gas-liquid metal equilibrium in the present experimental conditions. In order to make sure that samples for nitrogen analyses are unpolluted by any nitride precipitates which were trapped in the melt as inclusions at the high temperatures, Fig. 6 shows the SEM image of Mn60Si30Fe sample at 1773 K when the nitrogen partial pressure is 0.97. It could be seen that the sucked samples were clean without silicon nitride precipitates. In Fig. 6, the atomic percents of Si, Mn and Fe were 44.69%, 46.97% and 8.34% for the dark gray area, respectively, while they were 32.87%, 60.90% and 6.23% for the light gray area, respectively. The dual phase structure was formed due to the non-equilibrium crystallization during the solidification process of sample.

Comparison of experimental nitrogen contents with the calculated values.

Silicon nitride precipitates formed in the surface of Mn60Si30Fe melt.

SEM image of Mn60Si30Fe sample.
The following conclusions can be drawn from the present study,
(1) The nitrogen solubility in Mn–Si–Fe melts increases as the increase of temperature but decreases as the increase of silicon content. The dissolution of nitrogen in Mn68Si18Fe and Mn60Si30Fe melts follows the Sievert’s law. Silicon and iron could decrease the deviation degree from the Sievert’s law in Mn-based melts.
(2) The thermodynamic model of nitrogen solubility by Jang et al. is not applicable to Mn60Si30Fe melts.
(3) Mn60Si30Fe melts are saturated with silicon nitride after reaching the gas-liquid metal equilibrium in the present experimental conditions.
The authors gratefully acknowledge the research funding from the National Natural Science Foundation of China (No. 51274030).