Regular Article
Influence of Martensite Morphology on Sheared-Edge Formability of Dual-Phase Steels
2017 Volume 57 Issue 5 Pages 937-944

Details
2017 Volume 57 Issue 5 Pages 937-944
The automotive industry is increasingly demanding the availability of advanced high-strength steels (AHSS) with both higher strength and higher ductility. While there have recently been major improvements in the trade-off between ductility and strength, the sheared-edge formability of AHSS remains a critical issue. AHSS sheets exhibit cracking on sheared edges during stamping and forming operations, below the predictions of forming limit diagrams. The current study investigates the effects of microstructure on sheared edge formability measured through hole expansion experiments. Five commercially produced dual-phase (DP) steels with different microstructural configurations, but with equivalent tensile strengths of approximately 1 GPa, were evaluated. Quantitative stereological measurements of martensite size, contiguity, mean free distance, and number of colonies per unit area were made. The results showed the number of martensite particles per unit area, which represents microstructure homogeneity, correlates directly with the hole expansion ratio (HER). The overall trend is that HER increases as the number of martensite colonies per unit area increases; i.e. HER increases with a fine, evenly dispersed distribution of martensite. Additionally, HER decreases as the calculated carbon content in the martensite of these steels increases, which is attributed to the effect of carbon on martensite strength.
The development of advanced high-strength steels (AHSS) for automotive components is a continuing requirement for improving safety and reducing weight to improve fuel efficiency in vehicles, as well as decreasing overall emissions. Automotive companies demand steels that can be shaped by various forming methods and with material tensile strengths greater than 1 GPa. Higher strength steels generally have poorer formability as compared to lower strength steels, especially during the stretching of sheared edges. Poor formability can result in problems during stamping or during the assembly of vehicle parts and components. Forming limit diagrams (FLDs) are used to estimate the amount of deformation that can be imparted to a sheet metal before strain localization and failure occurs during a forming operation. Typically, sheared edge formability is less than the FLD prediction.
Higher-strength AHSS are often used for automotive parts with simple geometries, such as door impact beams or bumper reinforcements, but can also be used in parts with more complex geometries such as seat frames or B-pillars, where ductility and sheared edge formability are important considerations.1) While there have recently been major improvements in the trade-off between ductility and strength, sheared-edge stretching of AHSS remains a critical issue.
The mechanical properties of dual phase (DP) steels are dominated by the volume fraction, morphology, and distribution of the martensite in the ferrite matrix. Factors that affect the volume fraction of martensite include intercritical temperature, cooling rate, and alloy content. There are various morphologies for martensite, such as needle-like, granular, and equiaxed, and all of these morphologies result in increasing strength with increasing volume fraction of martensite. Aspects of the morphology can have preferential effects on the strength and ductility of DP steels. Bag et al. showed that long ribbons of martensite separated by ferrite had the greatest strength in the rolling direction at the expense of ductility, and that this morphology was achieved by heat treatments that ranged from 20 hours to 5 days and subsequent warm rolling. Decreasing martensite aspect ratios results in increased ductility at the expense of strength. An evenly distributed array of equiaxed martensite islands normally results in the best combination of strength and ductility for DP steels.2)
Figure 1 illustrates the hole expansion ratio (HER), a standard measure of shear edge formability, for a variety of steel grades as a function of ultimate tensile strength (UTS). As UTS increases, the HER decreases for most steel grades. However, DP steels do not follow this trend as consistently as the other steels. At lower strengths, the HER of DP steels decreases with increasing UTS. At strength levels of approximately 780 MPa and greater, the HER stops continuously decreasing and becomes scattered. This variation in the HER-strength relationship suggests that the microstructure morphology in these steels affects sheared-edge formability.

Hole expansion ratio (HER) versus ultimate tensile strength (UTS) for a variety of steel grades. Increasing ultimate tensile strength is generally associated with lower hole expansion ratios, with some variation in the trend in individual steel classes. Adapted from experimental work by Sadagopan et al.3)
Hole expansion has been studied and related to the tensile strength, total elongation, transverse elongation, normal anisotropy, and strain hardening exponent. Some of these properties have a better correlation with HER than others. The hole expansion ratio increases almost linearly with increasing transverse total elongation. Hole expansion is higher in materials that have a higher total elongation, post-uniform elongation, and a higher normal anisotropy. Post-uniform elongation can be correlated to the HER value of sheet steels, including AHSS. Figure 2 shows that there is almost a linear relationship between HER and post-uniform elongation. Increasing post-uniform elongation results in increasing HER. The correlation is not as strong for DP steels or within some other single classes of steels, which is another likely indication of the importance of microstructural morphology on HER performance. Overall, variations in sheared edge stretching limits exist among steel grades that are not fully explained by properties obtained from a tensile test.

Karelova et al. reported that variations in HER between DP and complex-phase (CP) steels of the same strength level can be explained by differences in their microstructure.5) Individual constituent properties within a microstructure affect local formability. Hasegawa et al. showed that multiphase microstructures have a lower HER than single phase grades with similar strength levels, and attributed the results to differences in hardness between constituent phases.6) Sugimoto et al. showed similar results, where lower HER values for a multiphase microstructure were obtained, as compared to a single phase material at the same strength level.7) Taylor et al. also showed that HER decreased with increasing martensite hardness and martensite/ferrite hardness ratio for DP steels, attributing this finding to greater strain partitioning to the ferrite during plastic deformation, which resulted in interface incompatibility and decohesion at ferrite-martensite interfaces.8) Plastic strain distribution within the microstructure directly affects the fracture behavior during hole expansion.9) For DP steels, a large amount of martensitic phase surrounding a ferritic phase can undergo significant amounts of plastic deformation, which reduces localization of deformation in the ferritic phase and therefore delays failure.10)
Variations in sheared edge stretching limits exist among various grades of dual-phase steels that are not fully explained by tensile properties alone. Factors such as chemical composition, processing routes, volume fractions of ferrite and martensite, and distribution of phases and their properties may also affect sheared edge stretching limits. The current study was performed with the objective of finding correlations between sheared-edge formability and microstructural features for dual-phase steel grades with mostly similar tensile strengths.
Four commercially produced dual phase steels with varying chemical compositions were studied, with a strength of about 1 GPa and designated DP980 A to D. Additionally, a DP1180 steel was included in the experimental matrix. All of these steels were uncoated. Table 1 lists the thickness and carbon, manganese, and silicon contents for each of the steels. These steels were micro alloyed for microstructural refinement.
| Steel | Thickness (mm) | C | Mn | Si |
|---|---|---|---|---|
| DP980 A | 1.45 | 0.162 | 2.04 | 1.46 |
| DP980 B | 1.00 | 0.116 | 1.77 | 0.51 |
| DP980 C | 1.45 | 0.101 | 2.07 | 1.50 |
| DP980 D | 1.40 | 0.140 | 1.86 | 0.50 |
| DP1180 | 1.10 | 0.167 | 2.13 | 1.34 |
Microstructures were evaluated in both a qualitative and quantitative manner. The volume fraction of microconstituents was calculated using light optical microscopy (LOM) and manual point counting according to ASTM Standard E562-11.11) Samples for volume fraction analysis were prepared using standard metallographic procedures following ASTM E3.12) A circle grid was overlaid on multiple micrographs, where the phase at grid intersections was recorded and a fraction was calculated from these point intersections. Five fields were analyzed for each steel, with a total point count of 2500 per steel. From the martensite volume fraction results, the average carbon content of martensite was calculated for the steels using a basic rule of mixtures formula as shown below:
| (1) |
Measurements of martensite size and dispersion were also performed using LOM. Several assumptions were made for these quantitative metallography measurements. It was assumed that all martensite packets in contact with each other with an extended boundary were a single martensite colony or particle for the measurements. Colonies were assumed to have a spherical shape. The measurements included mean free distance between martensite colonies, which is determined using the following equation defined by Fullman:13)
| (2) |
| (3) |
| (4) |

Representative micrograph of (a) circle grid of known dimensions used for quantitative stereology analysis, and (b) a martensite colony (circled).
Tensile tests were performed for all steels following the ASTM E8 standard.15) The tests were performed on an 89 kN screw-driven load frame at a crosshead displacement rate of 2.54 mm/min, with the gauge section displacement monitored with an extensometer. The tests were performed with the tensile axis parallel to the rolling direction. The properties of yield strength (YS), UTS, uniform elongation, total elongation, reduction in area, and true fracture strain were obtained from each test and averaged, with the standard deviation used as the uncertainty. Uniform elongation was determined as the strain associated with the maximum load, and post-uniform elongation was calculated by subtracting uniform from total elongation. Reduction in area was determined using caliper measurements at the minimum cross-sectional area and was calculated using the following equation:
| (5) |
| (6) |
Hole expansion tests were performed on the steels listed in Table 1. Sample blanks for hole expansion were machined with 101.6 × 101.6 mm dimensions. Blank punching was performed on an Interlaken formability press at a constant displacement rate of 25.4 mm/s. The hole expansion blanks had a 10 mm hole punched with a clearance within a 12.5 to 15% range. The punch tooling consisted of a 10 mm punch mounted to the top of the frame and a coordinating die plate. The die plate was interchangeable in order to provide clearance within the specified range. Clearance is expressed as a percentage and is a function of the punch diameter, die diameter, and sheet thickness, according to the following equation:
| (7) |
The hole expansion tests were conducted on an Interlaken formability press. All samples were tested using a conical punch (top angle of 60°) in the burr up position, relative to a punch coming up from the bottom. A constant hold-down force of 445 kN was used on the perimeter of the sample to prevent draw-in. A constant punch displacement rate of 50.8 mm/min was used for all tests. A monitor screen connected to a digital camera directed on top of the expanding hole provided a visual view during the test. The hole in each sample was measured using a caliper in three different directions (0°, 45°, 90°) after expansion to the point of a through-thickness fracture so that the HER of each steel could be calculated. Ten samples were tested for each condition. The hole expansion ratio was calculated by
| (8) |
Microstructural characterization was performed via light optical microscopy (LOM). Figure 4 shows the microstructures of the DP steels. The microstructures consist of a ferritic matrix (light-colored regions) with martensite islands (darker-colored regions) dispersed throughout.

Light optical micrographs of (a) DP980 A, (b) DP980 B, (c) DP980 C, (d) DP980 D, and (e) DP1180. Etched with 2 pct nital.
Table 2 shows the results of volume fraction analysis for all steels. The DP980 B to D steels contain a similar volume fraction of martensite, at 37 to 39 percent, with DP980 A containing slightly more martensite at 45 percent and DP1180 containing the most at 50 percent. Table 2 also shows the calculated amount of carbon in martensite for each grade. The martensite in DP980 C had the least amount of carbon at 0.266 weight percent, while DP980 D had the most carbon in martensite at 0.378 weight percent.
| Steel | Martensite | Ferrite | Martensite C-Content (wt. pct.) |
|---|---|---|---|
| DP980 A | 45 ± 1 | Bal. | 0.320 |
| DP980 B | 39 ± 1 | Bal. | 0.297 |
| DP980 C | 38 ± 1 | Bal. | 0.266 |
| DP980 D | 37 ± 1 | Bal. | 0.378 |
| DP1180 | 50 ± 1 | Bal. | 0.334 |
The other stereological measurements were mean free distance (MFD) between martensite colonies, contiguity, size of martensite colonies (equivalent radius in μm), and number of colonies per unit area (mm2, in this case). Table 3 lists the results of these measurements.
| Steel | MFD between Martensite Colonies (μm) | Contiguity | Martensite Colony Size (μm) | # of Martensite Colonies/mm2 |
|---|---|---|---|---|
| DP980 A | 7.03 | 0.171 | 4.31 | 33500 |
| DP980 B | 6.06 | 0.240 | 2.91 | 39600 |
| DP980 C | 5.37 | 0.272 | 2.47 | 36700 |
| DP980 D | 7.52 | 0.274 | 3.31 | 26800 |
| DP1180 | 4.97 | 0.265 | 3.73 | 29000 |
Tensile tests were performed on all steels in the longitudinal orientation. Table 4 summarizes the tensile properties for all steels. For all DP steels, continuous yielding behavior is observed with high initial work-hardening rates. The DP980 steels have ultimate tensile strengths (UTSs) between 965 and 1012 MPa, while the DP1180 steel has a UTS of 1175 MPa. The ductility of the DP980 steels is similar and ranges between 13.7 and 16.8 percent for total elongation, while the DP1180 steel has a lower total elongation of 11.0 percent. However, the reduction in area and true fracture strain have more variation between the alloys. The HER performance correlated most strongly with the true fracture strain of the steels, and HER had a slight correlation with UTS and other tensile property measurements.16)
| Steel | Total Elongation (pct) | Uniform Elongation (pct) | UTS (MPa) | YS (MPa) | Reduction in Area (pct) | True Fracture Strain (εf) |
|---|---|---|---|---|---|---|
| DP980 A | 16.8 ± 0.2 | 10.2 ± 0.1 | 1012 ± 3 | 691 ± 2 | 45 ± 0.5 | 0.60 |
| DP980 B | 13.7 ± 0.5 | 8.6 ± 0.0 | 987 ± 6 | 703 ± 12 | 57 ± 0.3 | 0.85 |
| DP980 C | 15.5 ± 0.8 | 9.8 ± 0.4 | 965 ± 6 | 655 ± 4 | 53 ± 0.8 | 0.76 |
| DP980 D | 15.4 ± 0.7 | 10.0 ± 0.1 | 1005 ± 8 | 633 ± 3 | 30 ± 0.2 | 0.36 |
| DP1180 | 11.0 ± 0.4 | 6.9 ± 0.1 | 1175 ± 7 | 846 ± 10 | 46 ± 0.6 | 0.61 |
Table 5 summarizes the hole expansion ratio results for all steels. DP980 B and DP980 C exhibited the highest HERs with values near 50%, followed by DP980 A and DP1180. The DP980 D steel exhibited the lowest HER of all steels, at 14.5 ± 0.9%.
| Sample | DP980 A | DP980 B | DP980 C | DP980 D | DP1180 |
|---|---|---|---|---|---|
| 1 | 45.4 | 51.9 | 54.3 | 14.8 | 22.6 |
| 2 | 29.2 | 53.0 | 55.3 | 15.1 | 28.7 |
| 3 | 36.9 | 54.4 | 46.0 | 16.1 | 19.4 |
| 4 | 33.5 | 48.4 | 49.1 | 13.8 | 26.9 |
| 5 | 46.2 | 53.5 | 36.4 | 14.6 | 26.3 |
| 6 | 34.9 | 57.0 | 50.2 | 14.1 | 28.6 |
| 7 | 37.1 | 48.7 | 52.6 | 13.4 | 24.0 |
| 8 | 42.9 | 49.8 | 55.3 | 15.7 | 36.4 |
| 9 | 41.7 | 44.6 | 41.1 | 13.2 | 20.2 |
| 10 | 37.2 | 47.8 | 49.3 | 14.2 | 22.8 |
| Average | 38.5 | 50.9 | 49.0 | 14.5 | 25.6 |
| Std. Dev. | 5.2 | 3.5 | 5.9 | 0.9 | 4.7 |
Sheared edge formability is influenced by microstructure. Figure 5 shows the correlation between HER and martensite volume fraction for the steels studied in this investigation; it is difficult to discern a trend in these data. However, if the DP980 D condition is excluded, HER decreases with increasing martensite volume fraction, though the range of volume fractions is small. Overall, the HER values vary greatly, while the martensite volume fraction is relatively similar for the DP980 steels. Thus, a more in-depth microstructural analysis was required in order to understand the role that microstructure plays in sheared-edge formability.

Hole expansion ratio as a function of martensite volume fraction.
One potentially important aspect is the carbon content of the martensite, which affects its strength. Figure 6 shows the relationship between HER and martensite carbon content. There is a strong correlation where HER decreases with increasing martensite carbon content, which results in a higher hardness difference between martensite and ferrite. This trend is consistent with results from Taylor et al.17) There is a slight deviation in the trend at lower martensite carbon contents and a high slope between carbon contents of approximately 0.30 and 0.34 weight percent, which suggests that other microstructural aspects are also important. The degree of martensite tempering during processing of each alloy is unknown and could contribute to deviations in the overall trend between HER and martensite carbon content as tempering generally decreases martensite hardness. Additionally, as discussed in the following paragraphs, characteristics of the martensite microstructure affect HER performance.

Hole expansion ratio as a function of carbon content of martensite.
Conventionally, martensite volume fraction is related to HER, but other stereological properties may also be important. Figures 7(a)–7(c) shows HER as a function of martensite contiguity, mean free distance between martensite colonies, and martensite colony size, respectively. There is no definitive correlation between HER and any of these measurements alone. However, each of these measurements represents a single aspect or characteristic of the overall microstructure, and it may be more appropriate to look at their combined effects.

Hole expansion ratio as a function of (a) contiguity of martensite, (b) mean free distance between martensite colonies, and (c) colony size of martensite for DP steels.
Figure 8 shows the correlation between HER and the product of contiguity, mean free distance, and colony size. The product of these measurements provides a combined parameter that represents martensite dispersion throughout the microstructure. Specifically, contiguity is representative of the connectivity of martensite in the matrix. It might be expected that as the contiguity of martensite increases, there is a larger continuous ferrite-martensite boundary area in which damage may propagate, and as a result, HER should decrease. Mean free distance is representative of martensite dispersion in the matrix. Larger mean free distances between martensite colonies would presumably result in a larger potential for strain localization in ferrite and possibly greater stress concentrations at ferrite-martensite boundaries due to longer dislocation pileups in ferrite, thus decreasing HER. Since damage initiates at ferrite-martensite boundaries, the size of martensite colonies is related to a flaw size when damage develops. Larger flaws have larger stress concentrations and therefore, HER should decrease as particle size increases. Figure 8 shows that there is a slight trend where HER decreases as the product of these measurements increases.
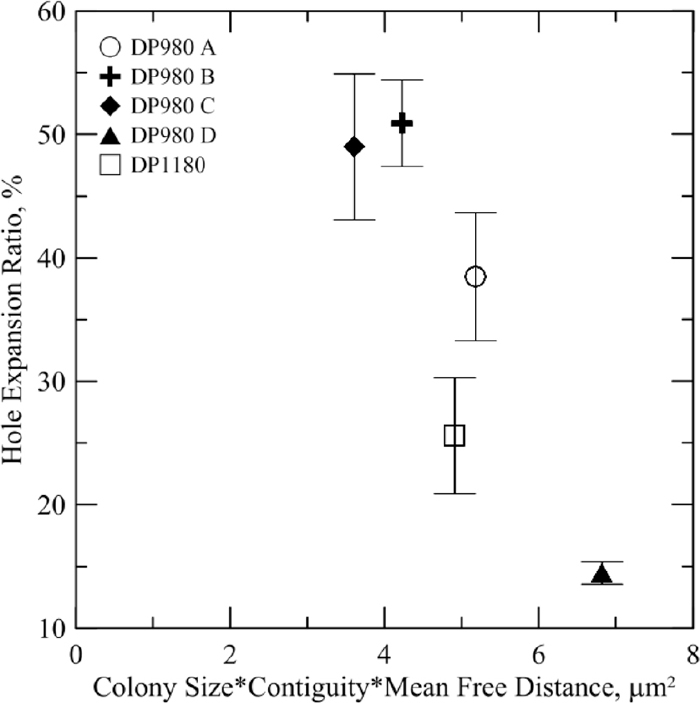
Hole expansion ratio as a function of the product of colony size, contiguity, and mean free distance of martensite for DP steels.
Another measurement that provides information on the dispersion of martensite is the number of colonies per unit area. Figure 9 shows the relationship between HER and number of martensite colonies per unit area. There is a strong correlation where HER increases with increasing number of colonies per unit area. In other words, as the martensite colonies are more dispersed throughout the microstructure, there is better performance in sheared edge formability. Data from another study16) are included for two additional steels—a DP980 and a DP1180. The data from these alloys also follow the trend observed for the experimental steels in the present study. The number of colonies per unit area can be quantitatively related to martensite volume fraction, mean free distance between martensite colonies, and martensite colony size, and the same fundamental concepts previously described also govern the relationship between the number of colonies per unit area and HER properties.

Hole expansion ratio as a function of number of martensite colonies per unit area.
Overall, HER performance relates most strongly to carbon content of martensite and the number of martensite colonies per unit area in the microstructure. Martensite carbon content and number of colonies per unit area are also somewhat related to one another. For a given alloy, the carbon content in martensite decreases as the volume fraction of martensite increases. One factor that controls the number of martensite colonies per area is the volume fraction of martensite; the carbon content in martensite generally decreases with an increasing number of martensite particles per area. However, for a given volume fraction, the number of colonies per unit area is dependent on martensite colony size and thus, differences in hole expansion performance for a given martensite volume fraction are possible. This behavior is exemplified by the differences in HER values of the DP980 steels in the current study despite similar martensite volume fractions. It should be noted that the carbon content of martensite was also different for these steels, although the data on HER versus carbon content suggest that other factors besides carbon content influence HER. Furthermore, a correlation coefficient for a linear fit was calculated for HER versus both carbon content in martensite and number of colonies per unit area. The coefficient is 0.81 between HER and percent carbon in martensite; as mentioned previously, this correlation does not account for the degree of tempering of the martensite in each alloy. The correlation between HER and number of martensite colonies per area is stronger with a value of 0.98. Therefore, it can be interpreted that both martensite hardness, which is inferred based on carbon content, and dispersion, measured through number of colonies per area, are critical factors for HER performance.
Sheared edge formability for dual phase (DP) steels was evaluated through hole expansion ratio experiments. Four of the steels were DP980 grades with similar tensile properties, and the fifth steel was a higher-strength DP1180 grade. Quantitative stereology measurements were made for the steels that provided information regarding martensite size, volume fraction, and distribution. Additionally, the carbon content of martensite was calculated by assuming the complete partitioning of carbon to austenite during intercritical annealing. The hole expansion ratio (HER) performance of these steels has the strongest correlation with the amount of carbon in the martensite and the number of martensite colonies per unit area; HER decreases with increasing carbon content in martensite and increases as the number of martensite colonies per area increases. The amount of carbon in martensite controls martensite hardness relative to the ferrite, and high martensite-to-ferrite hardness ratios have been previously shown to be detrimental to ductile damage development in dual-phase steels. The number of martensite colonies per unit area is a reflection of the homogeneity of the microstructure, and it is well established that more homogeneous microstructures have better HER and sheared-edge formability properties. A combined parameter of martensite colony size, contiguity, and mean free distance between martensite colonies also shows reasonable correlation with HER, due to the role that martensite-ferrite boundaries and ferrite grain size have on ductile damage development.
Support of this work by the sponsors of the Advanced Steel Processing and Products Research Center at Colorado School of Mines is gratefully acknowledged.