Abstract
The aim of this research is to investigate generation of micro voids affecting stretch flange formability in cold-rolled Dual-Phase (DP) steel sheets having a low volume fraction of martensite. The volume fraction of martensite was the dominant factor of the hole expanding ratio instead of the difference in hardness between ferrite and martensite when the difference in hardness between ferrite and martensite was large. On the other hand, the difference in hardness became the dominant factor of the hole expanding ratio in DP steel sheets having a low difference in hardness. Micro voids around the punched hole and the fracture edge of tensile deformation were observed in order to understand these different results. The void density is able to be associated with the hole expanding ratio under the same strain condition and the void density depends on the martensite spacing.
1. Introduction
The production amount of high strength dual-phase (DP) steel sheets for automobile use is growing to satisfy regulations on weight reduction and crashworthiness raised by the government year by year. When high strength DP steel sheets are applied to automobile frame parts with complicated shapes, stretch flanging of the blank edge becomes more difficult.1,2,3,4)
Stretch flange formability is represented by the hole expanding ratio. According to the hole expanding test,5) a punched hole is expanded by a conical punch from the sheared surface side until a fracture through the sheet thickness occurs at the punched hole edge. The hole expanding ratio of higher temperature tempered DP steel sheets is high because of martensite softening.6,7,8,9) In the hole expanding process, micro voids generated by punching at the interface between ferrite and martensite grow to become through-thickness crack by combining with each other, and for this reason, the hole expanding ratio of martensitic steel sheets is higher than that of DP steel sheets of the same tensile strength.6) Therefore, the suppression of micro void generation at the interface between ferrite and martensite is significant for improving the hole expanding ratio of DP steel sheet.
Micro void generation in DP steel sheets seems to change depending on differences in the hardness and volume fraction of the phases because of the difference in the deformability of ferrite and martensite.10,11,12) Here, the hole expanding ratio is able to be improved by appropriately setting the difference in the hardness and volume fraction by controlling the chemical composition and tempering condition for each level of tensile strength. In this study, the effect of the hardness and volume fraction of the phases on the hole expanding ratio is investigated in DP steels containing 20% or less martensite. The objective is to quantitatively evaluate the effects of martensite hardness and volume fraction so as to obtain high a hole expanding ratio.
2. Experimental Procedure
Eight DP steels were induction melted in the laboratory. Table 1 shows the chemical compositions of steels used. The silicon and manganese contents of the steels were controlled in order to obtain tensile strength of approximately 590 MPa. The ingots were hot-rolled to thickness of 2.8 mm, and cold-rolled sheets with the thickness of 1.4 mm were prepared from the hot-rolled sheets.
Table 1. Chemical compositions of steels used (mass%).
| Steel | C | Si | Mn | P | S |
|---|
| A | 0.07 | 0.50 | 1.42 | 0.01 | 0.002 |
| B | 0.07 | 0.85 | 1.25 | 0.01 | 0.002 |
| C | 0.07 | 1.43 | 1.03 | 0.01 | 0.002 |
| D | 0.07 | 1.89 | 0.63 | 0.01 | 0.002 |
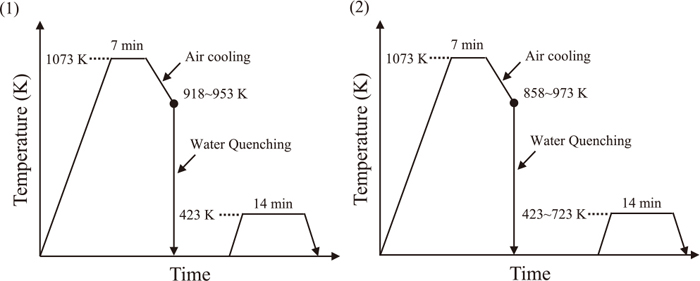
The annealing conditions are shown in Fig. 1. The sheets were kept at 1073 K (α+γ phase region) for 7 minutes to obtain fully recrystallized microstructure, followed by water quenching. After the water quenching, tempering was carried out at the various temperatures from 423 K to 723 K. The annealing conditions of Group 1 was adopted to obtain different volume fractions and hardnesses of martensite each other. The annealing conditions of Group 2 was adopted to vary only the martensite hardness though the volume fraction of martensite was kept at a constant. The microstructures were etched with 3% nital and observed with a scanning electron microscope. JIS No. 5 type tensile specimens (gauge length: 50 mm, gauge width: 25 mm) were machined from the annealed sheets; the tensile direction was parallel to the rolling direction. A tensile test with a cross head speed of 10 mm/min was carried out. The hole expanding ratio was measured according to the standardized JIS Z 2256 (2010).5) The square samples of 100 mm length with a 10 mm diameter punched hole in the center were prepared. The die diameter was 10.3 mm and the clearance was 11%. The punched hole was expanded using a conical punch from the burnished side until a crack through the thickness of the sample occurred on the hole edge. The hole expanding ratio (λ) was calculated by the following Eq. (1):
|
λ=(
d
h
–
d
0
)
/
d
0
×100
| (1) |
where d
0 and d
h are the initial hole diameter and hole diameter when the crack occurred on the hole edge, respectively.
The hardnesses of ferrite (Hvα) and martensite (HvM) were measured by using micro hardness meters (micro Vickers hardness meter and DUH-W201S, Shimadzu Co., Ltd.). Since the small size of the individual martensite prevents accurate measurement of the Vickers hardness, the DUH-W201S was used to measure the martensite hardness. The Vickers hardness of martensite (HvM) was then calculated from DUH hardness (DUHM) by using Eq. (2):
The relational Eq. (2) was calculated by two kind of hardness (Hv and DUH) of ferrite and martensite using representative various hardness samples.
The micro voids on the cross-sections after the punched specimens were observed.6,13) The observed size of the voids was 1 μm or more, and the measured point of the voids was the longer axis of the axes of an ellipse. The number of voids in the micrographs were counted in the area until 50 μm from the edge (approximately 0.07 mm2), and the void density was calculated.
3. Results
3.1. Effects of Volume Fraction of Martensite on Hole Expanding Ratio
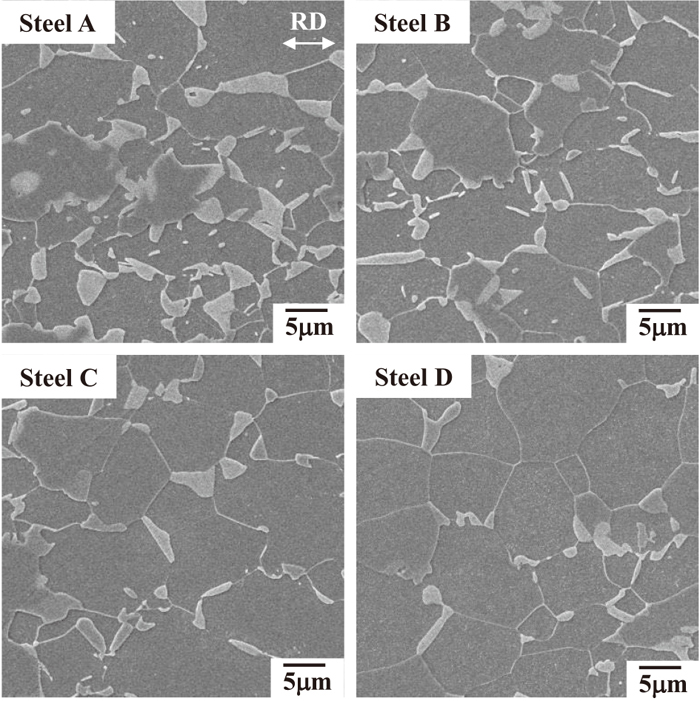
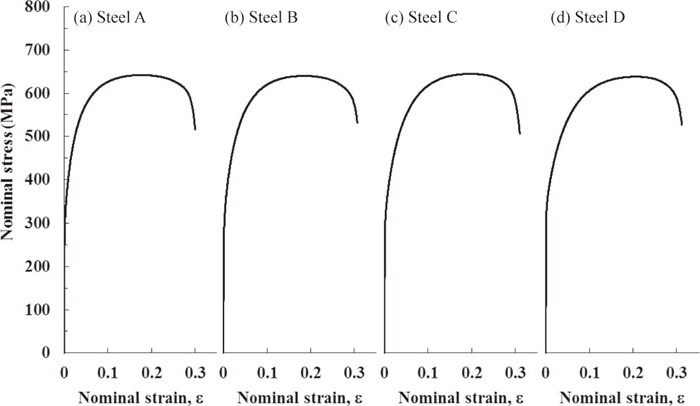
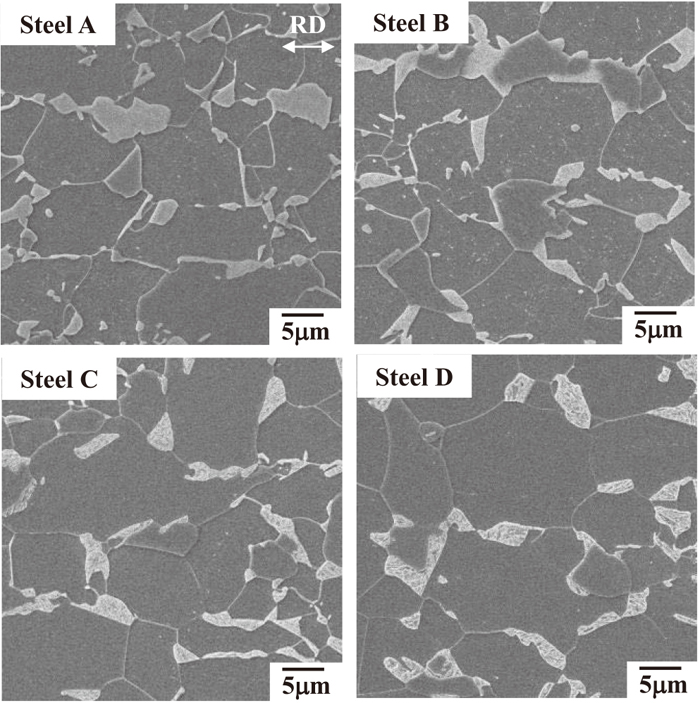
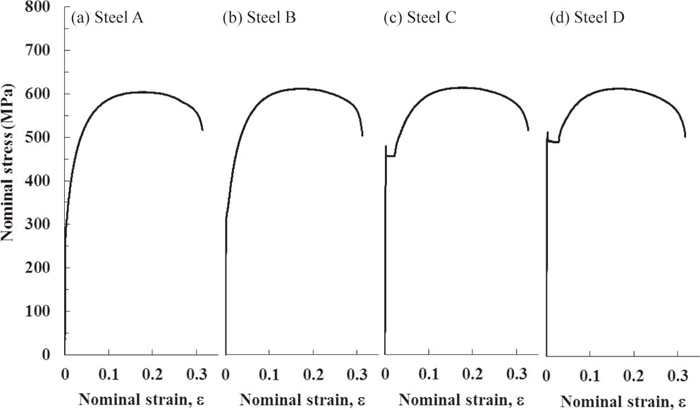
Figure 2 shows the microstructures of the steels in Group 1. The martensite volume fractions in Steels A, B, C, and D were from 7% to 16%. Figure 3 shows the engineering stress-strain curves of the steels in Group 1, and Table 2 shows the volume fraction of martensite (VM) and tensile properties of the steels in Group 1. The tensile strengths of all the samples were around 640 MPa, and their elongations were approximately 30%.
Table 2. Volume fraction of martensite and tensile properties of Group 1 steels.
| Group | Steel | VM (%) | TS (MPa) | El (%) |
|---|
| 1 | A | 16 | 643 | 30 |
| B | 12 | 639 | 31 |
| C | 9 | 644 | 30 |
| D | 7 | 637 | 31 |
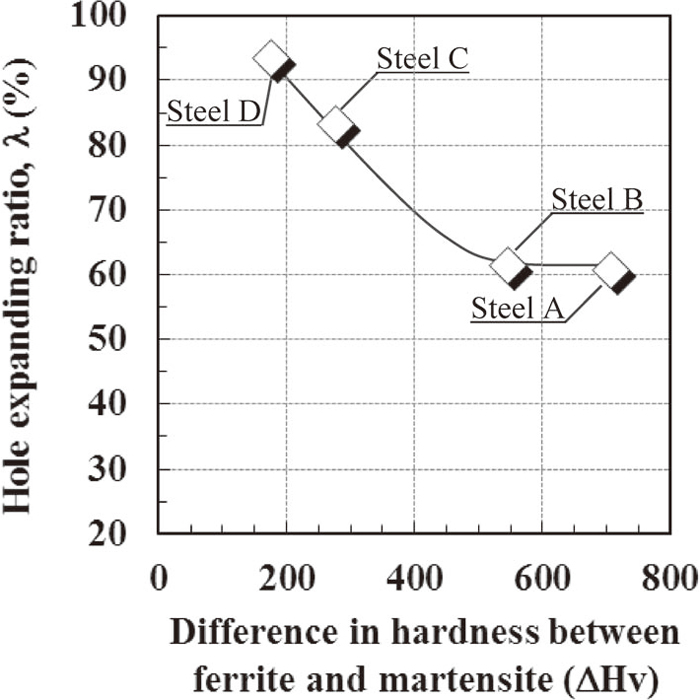
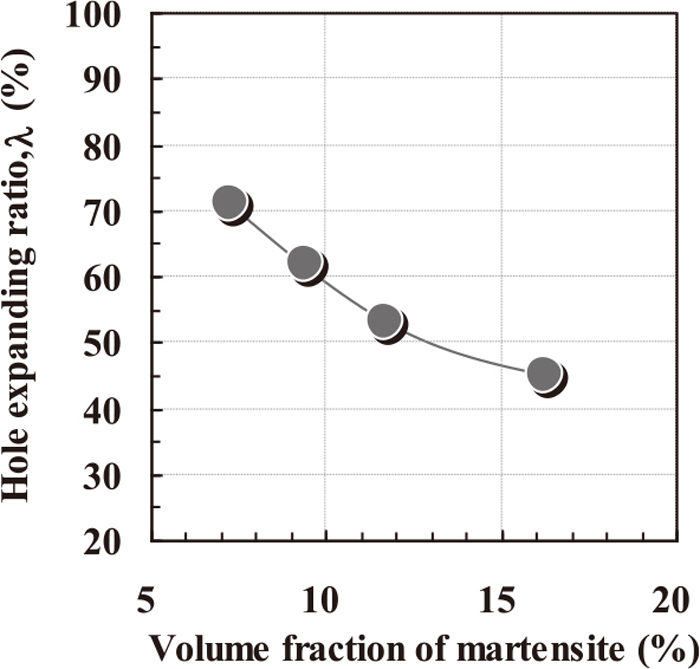
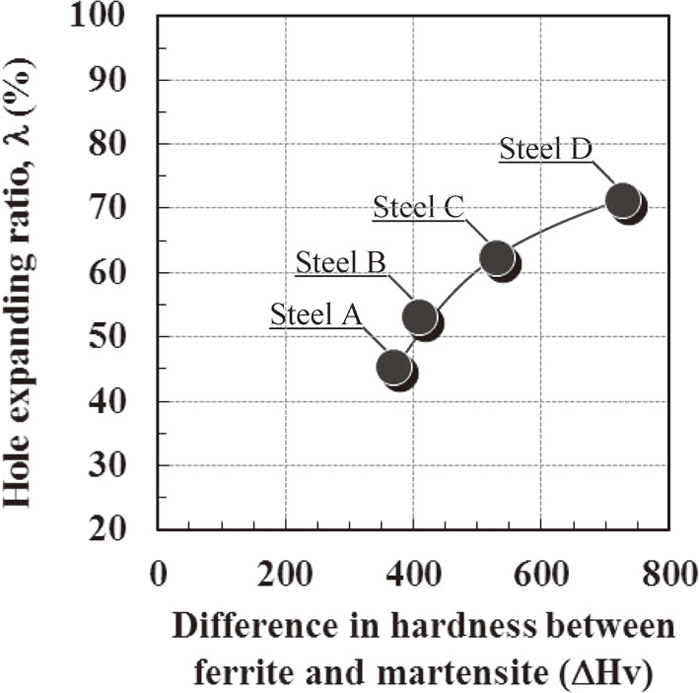
Figure 4 shows the relationship between the volume fraction of martensite and the hole expanding ratio of the steels of Group1. The hole expanding ratio decreased as the volume fraction of martensite increased. Pushkareva et al. reported that the hole expanding ratio of high strength DP steels over 1000 MPa was improved by an increase in the volume fraction of martensite.9) Figure 5 shows the change in the hole expanding ratio with the difference in hardness between ferrite (Hvα) and martensite (HvM). The hole expanding ratio increased with the increase in the difference in hardness, although the opposite results have been reported with 980 MPa grade DP steel sheets.6)
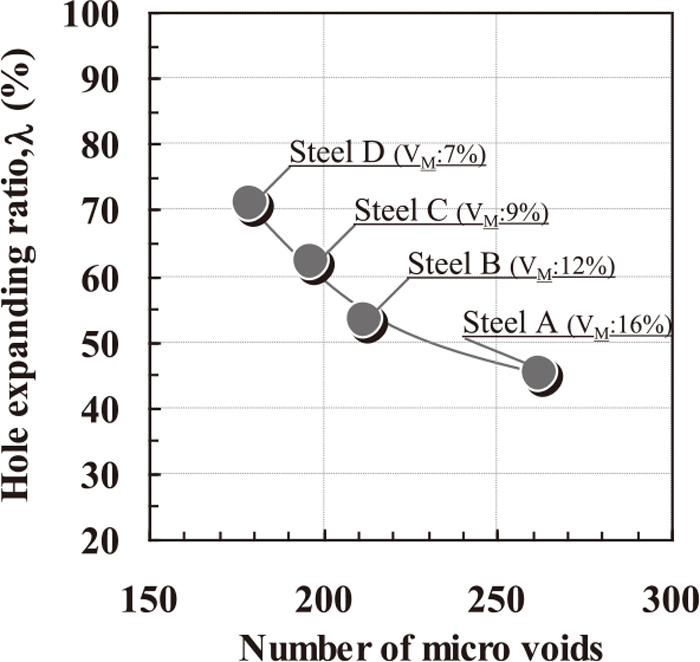
Since the edge of the hole is severely deformed by punching, the micro voids which are generated by punching are considered to greatly deteriorate the hole expanding ratio.14,15,16,17) To explain the result in Fig. 5, the microstructures in the cross-sections of the punched edge were observed. Figure 6 shows scanning electron micrographs of the cross-sections near the fracture surface of punched Steels A and D of Group 1, which exhibited a large difference in the hole expanding ratio. The arrows in the micrographs indicate micro voids generated by punching. Micro voids were observed at the interface between ferrite and martensite or in the martensite. In steel D, few voids were observed around martensite because of small number of martensite. Figure 7 shows the relationship between the number of micro voids and the hole expanding ratio. The hole expanding ratio decreased as the micro voids increased. These results indicate that the number of micro voids essentially affects the hole expanding ratio instead of the difference in hardness between ferrite and martensite.
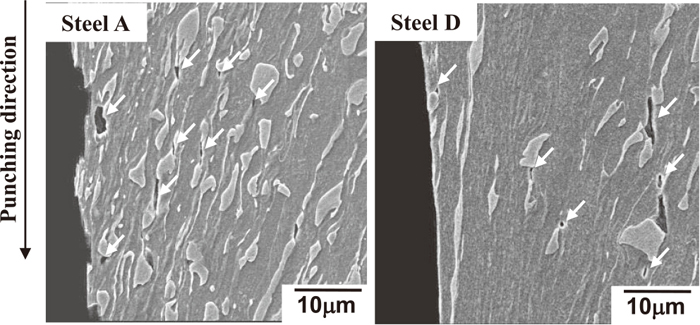
Figure 8 shows the microstructures of the steels in Group 2. The martensite volume fractions of Steels A, B, C, and D were 11% while the difference of hardness between ferrite and martensite varied. Figure 9 shows the engineering stress-strain curves of the steels in Group 2, and Table 3 shows the volume fractions of martensite (VM) and the tensile properties of the steels in Group 2. The tensile strengths of all the samples were about 610 MPa, and the elongations were about 31%. Although martensite was softened by tempering, tensile strength was at a constant high level. This is attributed to the small amount of martensite and to the solid solution strengthening of ferrite by silicon.
Table 3. Volume fraction of martensite and tensile properties of Group 2 steels.
| Group | Steel | VM (%) | TS (MPa) | El (%) |
|---|
| 2 | A | 11 | 606 | 32 |
| B | 11 | 612 | 31 |
| C | 11 | 614 | 33 |
| D | 11 | 612 | 32 |
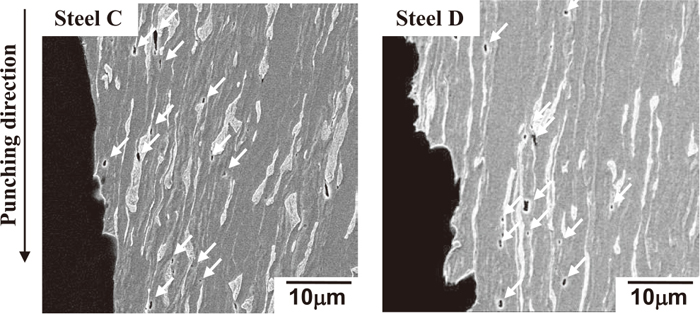
Figure 10 shows the change in the hole expanding ratio with the difference in hardness between ferrite and martensite in the Group 2 steels. The hole expanding ratio of Steel A was as large as that of Steel B. The hole expanding ratios of Steels C and D, however, were significantly increased by reducing the difference in hardness. As described above, the influence of the hardness difference shows the opposite tendency in Groups 1 and 2. Figure 11 shows scanning electron micrographs of the cross-sections near the fracture surface in punched Steels C and D of Group 2, which exhibited high hole expanding ratios. More micro voids were observed in the ferrite than that in Fig. 6. The number of micro voids of Steels C and D were 145 and 129, respectively. The hole expanding ratio increased as the number of micro voids decreased.
4. Discussion
4.1. Martensite Hardness and Void Density
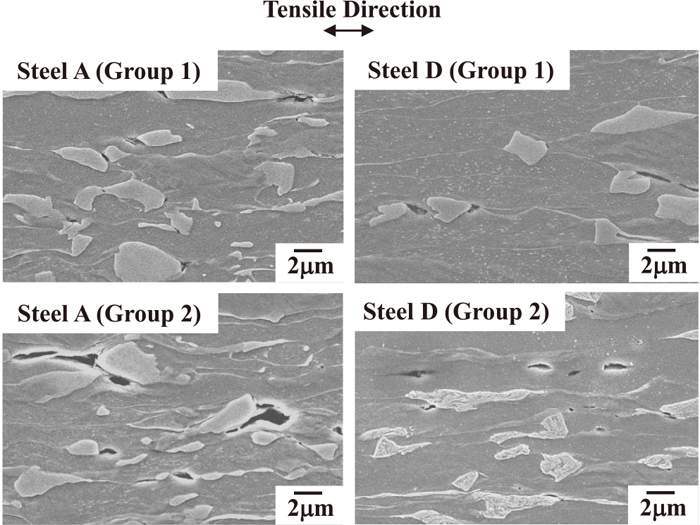
The hole expanding ratio increased as the martensite hardness increased as shown in Fig. 5. The relationship between the hole expanding ratio and the number of micro voids is shown in Fig. 7. The location of the voids moves from inside of the martensite to the interface between ferrite and martensite as the martensite hardness is increased by lowering the tempering temperture.18,19,20) The location of the voids also moves from the interface between ferrite and martensite to inside the martensite by coarsening of martensite.21) The distribution of strains between ferrite and martensite becomes inhomogeneous by deformation.22) Since strain changes significantly with distance from the punched edge in the hole expanded specimen, estimation of the void density is difficult. Here, the void density at each strain was measured by using gradually changing strain near the fracture point in the fractured tensile specimen. The cross-section in the fractured tensile specimens were observed to grasp the micro void generated by strain. Figure 12 shows magnified images of the cross-sections near the fracture surface after the tensile test in Steels A and D of Group 1 and Group 2. Micro voids were generated at the interface between ferrite and martensite or in the martensite except in Steel D of Group 2 while voids were generated in the ferrite in Steel D of Group 2. Void density obtained by using the fractured tensile specimen was also measured at several reduction rate of thickness (t*) near the fracture point. The void density measurement area at each t* in the cross-section near the fracture point was multiplication of 50 μm width and the thickness of the specimen, and the measured void size was 1 μm or more in diameter. The reduction rate of thickness, t* was calculated by Eq. (3):
where
to is the original sheet thickness, and
t is the thickness at the measurement position in the fractured tensile specimen. The thickness reduction t* was in the range from 29% to 56%.
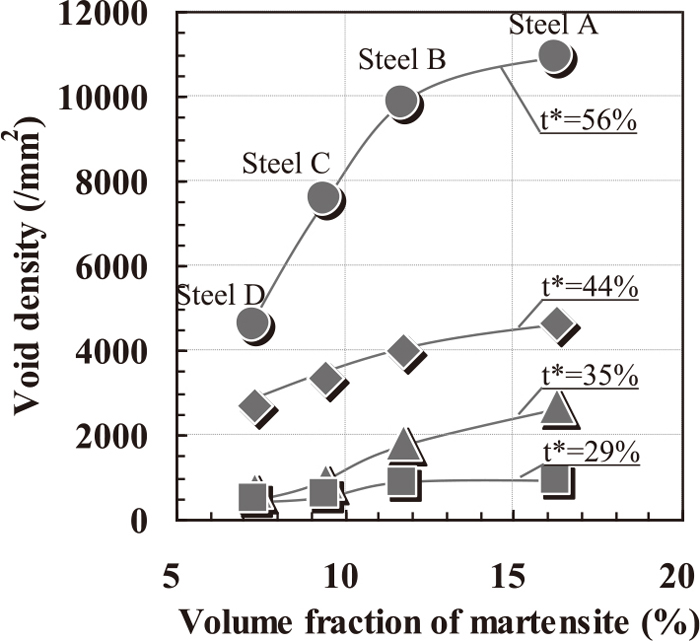
Figure 13 shows the relationship between the volume fraction of martensite and the void density in tensile tested specimen of the Group 1 steels. Void density increased with an increase in volume fraction of martensite or t*.
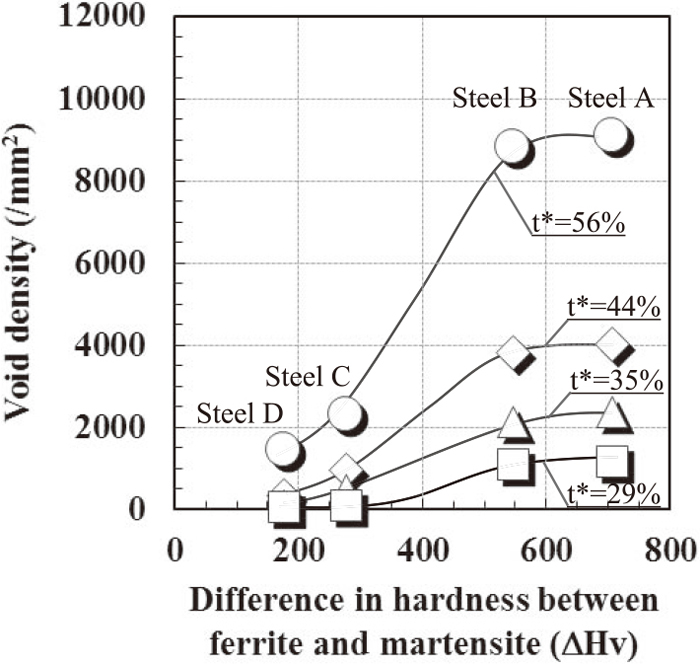
Figure 14 shows the relationship between the difference in hardness and the void density in the tensile tested specimen of the Group 2 steels. Void density increased as the hardness difference increased, and the influence of hardness was magnified at higher t*. This result shows good agreement with the previous paper reporting that softening of martensite by high temperature tempering reduces the number of voids generated in the martensite or at the interface between ferrite and martensite.
10)
4.2. Martensite Hardness and Void Generation
The micro voids in Steels C and D of Group 2 were observed in the ferrite as shown in Fig. 12. On the other hand, a lot of the voids in the other steels were in the martensite or at the interface between ferrite and martensite. Although micro voids were generated at low strain (t*=29%) except in Steels C and D in Group 2 in Fig. 14, many micro voids were generated even at low strain in Steel A in Group 1 in Fig. 13. The voids generated beside martensite in the Group 1 steels indicate that the existence of martensite is the dominant factor of micro void generation. In addition, the martensite hardnesses in Steels A and B of Group 2 were as high as those of Group 1; the morphology of martensite was also similar to that of Group 1. In contrast, since martensite was softened in Steels C and D of Group 2, martensite could sufficiently deform by punching. Although the difference in hardness in 980 MPa grade DP steel sheets was in the range from 250–450 Hv in the previous report,6) the difference in hardness in the Group 1 steels was in the higher range of 350–750 Hv. This is the reason why micro voids were easily generated at the interface or in the martensite compared with the results in the previous paper. Namely, if the difference in hardness is about 350 Hv or more, the volume fraction of martensite is able to become the dominant factor of void generation in DP steel sheets containing 20% or less martensite.
The void generation behavior of DP steel having high martensite hardness was affected by the volume fraction of martensite as shown in Fig. 13. Since the essential factor of the number of voids depending on the volume fraction of martensite seems to be the martensite spacing, the relationship between the martensite spacing and void density was evaluated by using Steel A of Groups 1 and 2 having large difference in hardness of approximately 700 Hv. The martensite spacing, SM was calculated using the following Eq. (4):
|
S
M
=(
0.9/
V
M
0.5
-0.8
)
×
d
M
| (4) |
where V
M is the volume fraction of martensite, and d
M is the average diameter of martensite.
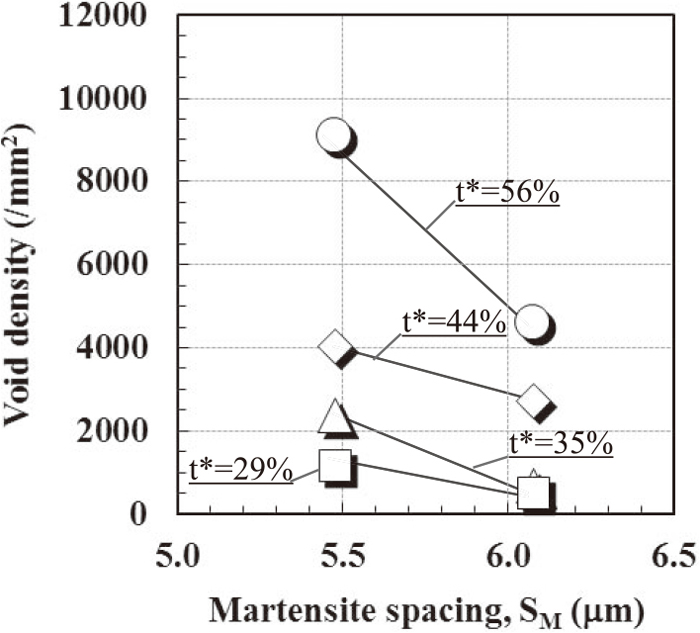
23) Figure 15 shows the relationship between the martensite spacing and void density at each reduction rate of thickness. Void density decreased as the mean martensite spacing increased. In the case of the precipitation, Furukimi
et al. reported that the number of voids decreased as the mean interparticle spacing increased.
24) Since micro voids are easily generated at locations close to spherical martensite,
25) the result in this study suggests that the reduction of void density by the decrease in the volume fraction of martensite is caused by a decrease in the martensite spacing. In other words, the void density of DP steel with less linkage of martensite seems to be low under the same strain condition. Therefore, in the case of punching, the number of micro void is reduced by the decrease in the volume fraction of martensite because of the increase in martensite spacing.
4.3. Void Density and Hole Expanding Ratio
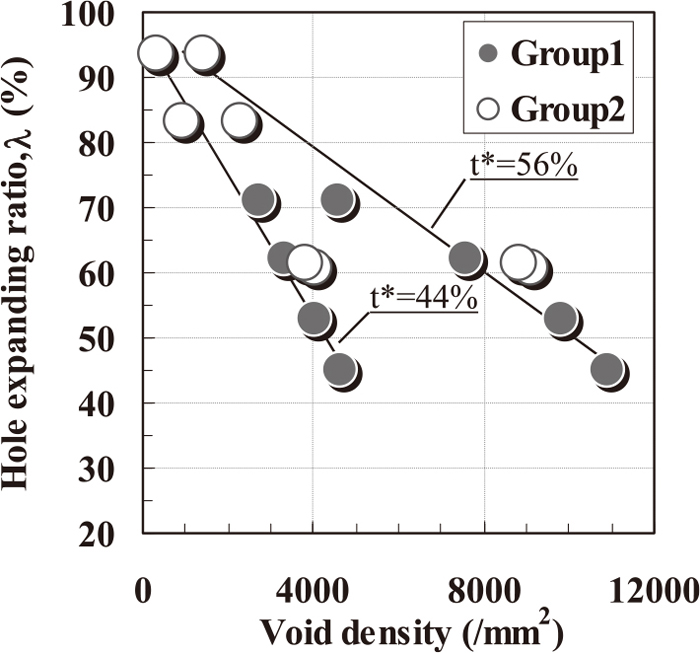
As shown in Fig. 7, a lower number of micro voids caused a higher hole expanding ratio; here, the hole expanding ratio was rearranged with the void density. Figure 16 shows the relationship between the void density and the hole expanding ratio at each reduction rate of thickness. The increase in void density significantly reduces the hole expanding ratio. When the reduction of thickness t* is regarded as strain, micro voids hardly occur even at high strain, depending on the difference in hardness between ferrite and martensite. Thus, the essential point in controlling the volume fractions of the phases and difference in phase hardnesses to increase the hole expanding ratio is to suppress the generation of micro voids. The reason why steels A and B in Group 2 showed the same hole expanding ratio is attributed to the fact that their void densities were the same. Since micro voids in DP steel having a large mean martensite spacing are hard to connect each other in hole expanding process, the hole expanding ratio was improved by the decrease in the volume fraction of martensite. As a result, reducing the volume fraction of martensite is important for increasing the hole expanding ratio of DP steel by reducing linkage of martensite.
5. Conclusions
The effects of the volume fraction of martensite and the difference in hardness between ferrite and martensite on stretch flange formability were investigated in DP steel sheets having the same tensile strength level. The obtained results were as follows;
(1) A comparison of steels having different volume fractions of martensite showed that a large difference in hardness caused a large hole expanding ratio.
(2) A comparison of steels having the same volume fraction of martensite showed that a small difference in hardness caused a large hole expanding ratio.
(3) The void density at each reduction of thickness decreased as the martensite spacing decreased.
(4) The hole expanding ratio shows a linear relationship with void density in spite of differences in hardness between ferrite and martensite or the volume fraction of martensite.
References
- 1) T. Yokota, A. Kobayashi, T. Ariga, Y. Funakawa and K. Seto: SAE Technical Paper, 01-1328, SAE International, Warrendale, PA, (2005).
- 2) N. Fujita, T. Nonaka, T. Tomokiyo, H. Taniguchi and K. Goto: SAE Technical Paper, 01-0341, SAE International, Warrendale, PA, (2007).
- 3) H. Takuda, K. Mori, H. Fujimoto and N. Hatta: J. Mater. Process. Technol., 92–93 (1999), 433.
- 4) K. Mori, Y. Abe and Y. Suzui: J. Mater. Process. Technol., 210 (2010), 653.
- 5) JIS Z 2256: 2010, Metallic materials-Hole expanding test.
- 6) K. Hasegawa, K. Kawamura, T. Urabe and Y. Hosoya: ISIJ Int., 44 (2004), 603.
- 7) A. Kamp, S. Celotto and D. N. Hanlon: Mater. Sci. Eng. A, 538 (2012), 35.
- 8) I. Pushkareva, C. P. Scott, M. Gouné, N. Valle, A. Redjaimia and A. Moulin: ISIJ Int., 53 (2013), 1215.
- 9) I. Pushkareva, S. Allain, C. Scott, A. Redjaimia and A. Moulin: ISIJ Int., 55 (2015), 2237.
- 10) M. Azuma, S. Goutianos, N. Hansen, G. Winther and X. Huang: Mater. Sci. Technol., 28 (2012), 1092.
- 11) T. Matsuno, D. Maeda, H. Shutoh, A. Uenishi and M. Suehiro: ISIJ Int., 54 (2014), 938.
- 12) G. Avramovic-Cingara, Y. Ososkov, M. K. Jain and D. S. Wilkinson: Mater. Sci. Eng. A, 516 (2009), 7.
- 13) K. Sugimoto, A. Nagasaka, M. Kobayashi and S. Hashimoto: ISIJ Int., 39 (1999), 56.
- 14) M. Sudo, M. Higashi, H. Hori, T. Iwai, S. Kambe and Z. Shibata: Trans. Iron Steel Inst. Jpn., 21 (1981), 820.
- 15) K. Sugimoto, J. Sakaguchi, T. Iida and T. Kashima: ISIJ Int., 40 (2000), 920.
- 16) S. Ohtani, T. Morikawa, K. Higashida, S. Hashimoto and H. Haren: Tetsu-to-Hagané, 96 (2010), 406.
- 17) J. Kobayashi, H. Tonegawa and K. Sugimoto: Procedia Eng., 81 (2014), 1336.
- 18) Y. Tomota, H. Yoshino and K. Kuroki: Scr. Metall., 11 (1977), 853.
- 19) Y. Tomota, Y. Kawamura and K. Kuroki: Bull. JSME, 24 (1981), 282.
- 20) O. R. Jardim, W. P. Longo and K. K. Chawla: Metallography, 17 (1984), 123.
- 21) D. Kondo, K. Kunishige and R. Ueji: Tetsu-to-Hagané, 92 (2006), 457.
- 22) H. P. Shen, T. C. Lei and J. Z. Liu: Mater. Sci. Technol., 2 (1986), 28.
- 23) T. Kitaura, H. Hidaka, T. Tsuchiyama and S. Takaki: Tetsu-to-Hagané, 91 (2005), 796.
- 24) O. Furukimi, S. Niigaki, N. Yamada, M. Aramaki, S. Oue and Y. Funakawa: Tetsu-to-Hagané, 99 (2013), 60.
- 25) J. Kadkhodapour, A. Bulz and S. Ziaei Rad: Acta Mater., 59 (2011), 2575.