Abstract
In order to operate a blast furnace properly, the future prediction of process variables by a transient model based on kinetics is useful. In general, such a kinematic blast furnace model includes uncertain factors regarding reaction rates and heat transfer. However, any guideline of adjusting such factors to reproduce actual transition of process variables has not been fully discussed in the literature. In this research, we developed a transient two-dimensional (2D) model for online use, and then discussed an adjustment method to reproduce the behavior of process variables when the reducing agent ratio (RAR) is changed from the viewpoint of mass and heat balance with the Rist diagram. It was found that appropriate consideration of the chemical reserve zone and the heat balance of the furnace was effective to fit the developed model to the actual data.
1. Introduction
A blast furnace in the steel making industry consumes huge energy to reduce and smelt the iron ore. Low coke ratio is pursued in recent operation to minimize the production cost, which results in unstable permeability and burden descent. On the other hand, the daily operation of blast furnaces still depends on operators’ intuition and experience. In the future, it is necessary to improve the stability and to reduce the production cost through process automation, since it may be difficult to maintain capable operators when the working population declines. Under such circumstances, a numerical model aiming at the process automation was constructed in this study.
There have been numerous studies of blast furnace models, such as a 1D steady-state model,1) a 1D transient model,2,3,4,5) a 2D steady-state model,6,7,8,9,10) a 3D transient model,11,12) a multi-fluid model,13,14,15,16) and a discrete element method model.17) The classification of the models from the viewpoint of its usage (online use or offline use) and its dimension is shown in Table 1. Here we assume that the online models are used in a guidance system or a process automation, and that the offline models are used for the prediction of the furnace state under unprecedented conditions or the elucidation of the phenomena in the furnace. The online model, which is the target of this research, still stays in the 1D transient model. Moreover, to the best of the authors’ knowledge, there are no study that validated the model accuracy by the comparison with the actual data for a long period over one month.
Table 1. Classification of the blast furnace models.
| Offline Model | Online Model |
|---|
| Steady-state model | Transient model | Transient model |
|---|
| 1D | Muchi (1967) | Hatano et al. (1985) | Hatano et al. (1981) |
| | Otsuka et al. (1990) |
| | Ujisawa (2009) |
| 2D/3D | Yagi (1993) | Takatani (1999) | This work |
| Austin et al. (1997) | Castro et al. (2000) |
| Dong et al. (2010) | Ueda et al. (2010) |
| Yang et al. (2010) | Castro et al. (2011) |
| Fu et al. (2014) | Nishioka et al. (2012) |
| Kuang et al. (2014) | |
| Shen et al. (2016) | |
In the recent blast furnace operation, the radial distribution of the ore-to-coke ratio at the furnace top is designed to ensure the permeability of the furnace. In this research, a 2D transient model which reflects such a boundary condition was constructed and validated by the comparison with long-term actual data.
In order to utilize the mathematical model for the process automation, the sensitivity of process variables, e.g. gas utilization ratio and solution loss carbon, to operational variables, e.g. RAR and blast temperature, of the model needs to be close to that of actual data. Especially, the behavior of process variables when RAR is changed must be reproduced with high accuracy because the hot metal temperature is controlled by mainly changing RAR.
In the kinematic model, there are several uncertain factors regarding the reaction rates and heat transfer. For example, the gas reduction rate has to be corrected by multiplying 0.1 to the experimental result to fit the model to actual data.18) However, such adjustments focus only on the fitting of the absolute value, and how to reproduce the sensitivity of the process variables to RAR has not been reported.
The sensitivity of the process variables to RAR is mainly determined by the mass balance of carbon, iron, and oxygen, and the heat balance which consists of reaction heat, sensible heat of hot metal, and heat loss from furnace wall. In this research, an intuitive way of adjusting the uncertain factors was established on the basis of the Rist diagram,19) which graphically represents the mass and heat balance.
2. Development of 2D Transient Model
The new 2D transient model was developed by modifying the conventional axial symmetric 2D steady-state model.20) The variables in the model are listed in Table 2.
Table 2. List of variables in the model.
| Symbol | Notes | Dimension |
|---|
| us | Velocity of solid | [m/s] |
| ϕs | Potential of solid flow | [m2/s] |
| Xo | Volume fraction of ore | [m3ore/m3bed] |
| ug | Mass velocity of gas | [kg/m2·s] |
| Pg | Gas pressure | [Pa] |
| Rs | Generation rate of solid volume | [1/s] |
| Ro | Generation rate of ore volume | [1/s] |
| Rg | Generation rate of gas | [kg/m3·s] |
| ρg | Density of gas | [kg/m3] |
|
u
g
0
| Molar velocity of gas | [kmol/m2·s] |
| ufe | Molar velocity of iron | [kmolFe/m2·s] |
| uc | Mass velocity of coke | [kg/m2·s] |
| R | Reaction rate | [kmol/m3·s] |
| X1–X5 | Mol fraction of gas component
1: N2, 2: CO, 3: CO2, 4: H2, 5: H2O | [kmol/kmol] |
| X6–X9 | Mol fraction of iron component
6: O(contained in FeOx),
7: [C], 8: [Si], 9: H2O (liq) | [kmol/kmolFe] |
| Tg | Gas temperature | [K] |
| Tc | Coke temperature | [K] |
| Tfe | Iron temperature
(including iron oxides, etc.) | [K] |
| Cp,g | Specific heat of gas | [J/kg·K] |
| Cp,c | Specific heat of coke | [J/kg·K] |
| Cp,fe | Specific heat of iron
(including iron oxides, etc.) | [J/kmol·K] |
| ΔHR | Reaction heat | [J/kmol] |
| η | Reaction heat distribution rate | [–] |
| E | Heat exchange coefficient | [J/m3·s·K] |
| ρfe | Molar density of Fe in ore | [kmolFe/m3ore] |
| ρore | Apparent density of ore | [kg/m3ore] |
| ρc | Apparent density of coke | [kg/m3coke] |
| h | Overall heat transfer coefficient | [J/m2·s·K] |
The solid velocity vector us is calculated by the potential flow in Eq. (1) and the volume generation rate in Eq. (2).
The generation rate of solid volume mainly consists of the gasification of coke, melting of iron ore, and the combustion of coke in the raceway. Ore volume ratio can be calculated by
Eq. (3).
|
∂
X
o
∂t
+∇⋅(
u
s
X
o
)
=
R
o
| (3) |
The term ∂Xo/∂t is important to describe the transient state when the coke ratio at the furnace top is changed.
2.2. Gas Flow Model
The gas velocity vector ug is calculated from the Ergun’s equation in Eq. (4), and the generation rate of the gas in Eq. (5).
Giving anisotropic flow resistance kg allows the calculation of the typical flow inside the coke slits of cohesive zone.
2.3. Reaction Model
The reactions in Table 3 are modeled as a function of temperature and gas composition. The reduction rates of iron ore by CO gas and H2 gas are proportional to the difference from the equilibrium gas concentration. Since the chemical equilibrium depends on the oxidization degree of iron, the reaction rates of R1 and R4 are switched depending on the oxidization degree of Fe; that is, the reduction rates of FeO1.5, FeO1.33, and FeO1.05 are different.20) These reaction rates are reflected to Rs in the solid flow model and Rg in the gas flow model. The gas composition, oxidization degree of Fe, and components in the iron are calculated as follows:
|
∇⋅(
u
g
0
X
i
)
=
∑
j
m
i,j
R
j
| (6) |
|
∂(
ρ
fe
X
i
)
∂t
+∇⋅(
u
fe
X
i
)
=
∑
j
m
i,j
R
j
| (7) |
where
mi,j is the molar ratio of the substance
i (1: N
2 (gas), 2: CO (gas), 3: CO
2 (gas), 4: H
2 (gas), 5: H
2O (gas), 6: O (contained in FeO
x), 7: [C], 8: [Si], 9: H
2O (liq)) in the reaction
j. For example,
m2,1 = −1,
m3,1 = +1, and
m6,1 = −1 in the case of reaction 1 (FeO
x + CO = FeO
x−1 + CO
2).
Table 3. Reactions in the model.
| Symbol | Notes |
|---|
| R1 | FeOx + CO = FeOx−1 + CO2 |
| R2 | C + CO2 = 2CO |
| R3 | FeO + C = Fe + CO |
| R4 | FeOx + H2 = FeOx−1 + H2O |
| R5 | C + H2O = CO + H2 |
| R6 | CO + H2O = CO2 + H2 |
| R7 | C(coke) = [C] |
| R8 | H2O(liq) = H2O(gas) |
| R9 | SiO2 + 2C = [Si] + 2CO |
| R10 | C + 1/2O2 = CO (Raceway) |
| R11 | C + H2O = CO + H2 (Raceway) |
Considering the reaction heat and heat exchange between the solid and the gas, the temperature is calculated as follows:
|
∇⋅(
ρ
g
C
p,g
T
g
u
g
)
=
∑
j
η
g
j
Δ
H
R
j
R
j
+
E
g,fe
(
T
fe
-
T
g
)
+
E
g,c
(
T
c
-
T
g
)
+q
| (8) |
|
∂(
ρ
c
C
p,c
X
c
T
c
)
∂t
+∇⋅(
ρ
c
C
p,c
T
c
u
c
)
=
∑
j
η
c
j
Δ
H
R
j
R
j
+
E
g,c
(
T
g
-
T
c
)
+
E
fe,c
(
T
fe
-
T
c
)
| (9) |
|
∂(
ρ
fe
C
p,fe
X
o
T
fe
)
∂t
+∇⋅(
ρ
fe
C
p,fe
T
fe
u
fe
)
=
∑
j
η
f
e
j
Δ
H
R
j
R
j
+
E
g,fe
(
T
g
-
T
fe
)
+
E
fe,c
(
T
c
-
T
fe
)
| (10) |
where subscripts
g,
c,
fe mean gas, coke, and iron including iron oxides,
etc. Transient terms are needed in
Eqs. (9) and
(10) to express the heat inertia.
2.5. Boundary Condition
The ratio of the total amount of ore to that of coke, i.e. total O/C, must be identical with the actual value. The total O/C can be described as follows:
|
total O/C=
∑
k
ρ
ore
v
k
A
k
X
o,k
top
∑
k
ρ
c
v
k
A
k
(
1-
X
o,k
top
)
| (11) |
where
X
o
top
is the ore volume ratio at the top,
v is the perpendicular component of solid velocity
us to the material surface,
A is the surface area, and the suffix
k indicates each radial position at the furnace top. The total O/C depends on the solid velocity, which is an unknown variable calculated in the model. Hence,
X
o
top
at each radial position cannot be given in advance, and has to be corrected so that the total O/C agrees with the actual value, while keeping the profile of the initial distribution.
The heat flux q through the furnace wall is calculated as follows:
where
h is the overall heat transfer coefficient which includes the thermal resistance of the heat transfer between the gas and the furnace wall, the heat conductivity of the wall, and the heat transfer between the wall and the cooling water, and
Tw is the cooling water temperature. This heat sink is incorporated in
Eq. (8) as a source term.
2.6. Solution Method
Equations (1), (2), (3), (4), (5), (6), (7), (8), (9), (10) were discretized by the finite volume method. The convergence calculation was conducted at each time step by the implicit method. The time step was 2 hours. The mesh number was 40 in height direction to reproduce the number of material layers in the actual furnace. The mesh number in radial direction was 5 to minimize the calculation time while keeping the accuracy of the model.
3. Concept of Rist Diagram
The Rist diagram is an effective tool to visualize the mass and heat balance in the blast furnace. As shown in Fig. 1, the Rist diagram associates the main process variables such as RAR, solution loss carbon, gas utilization ratio, heat loss, sensible heat of hot metal, sensible heat of hot blast.
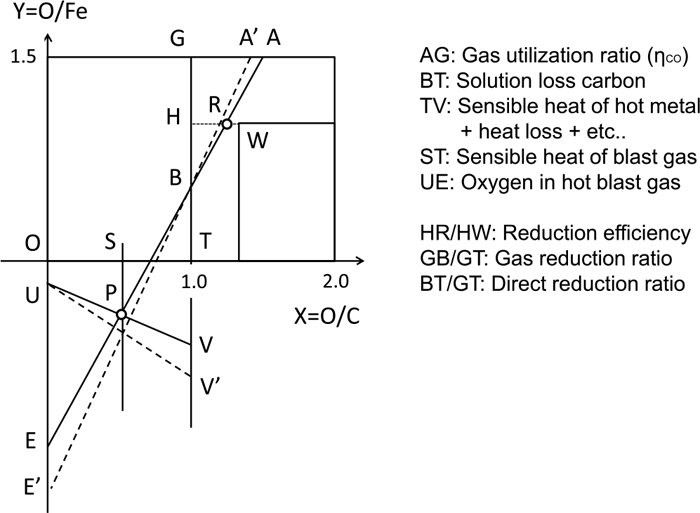
The horizontal axis (O/C) represents the degree of oxidization of carbon, which is 1 for CO gas and 2 for CO2. The upper part of the vertical axis (O/Fe) represents the degree of oxidization of Fe, which is 1.5 for unreduced iron ore (FeO1.5), 1.05 for partially reduced Wustite (FeO1.05), and 0 for reduced iron (Fe). The slope of segment AE represents RAR. The point W is the fixed point where the oxidization degree of iron is 1.05, and the oxidization degree of carbon is corresponding to the CO/CO2 ratio at the equilibrium between Fe and FeO1.05. The reduction efficiency is defined by HR/HW, which is the distance from the equilibrium. The segment AE must pass the point P which is determined from the constraint of the heat balance in the lower part of the furnace.
For example, if the reducing agent ratio (RAR) is raised by the increase of pulverized coal injection under the condition of the same blast temperature, the slope of segment AE rises to that of segment A’E’. The amount of oxygen per iron increases for the combustion of carbon in the raceway; point E moves to E’. In addition, the gas utilization, which is the conversion ratio of CO into CO2, becomes lower because CO gas volume per unit volume of oxidized iron increases; point A moves to A’. As a result, sensible heat of hot metal in the lower part of the furnace becomes higher; point V moves to V’.
The segment TV includes not only the sensible heat of hot metal and heat loss, but also the reaction heat of carburization and reduction of metalloids. However, they are not mentioned for the simplicity of explaining the Rist diagram. In addition, the existence of hydrogen is also neglected. These phenomena are taken into account in the developed model described in Section 2.
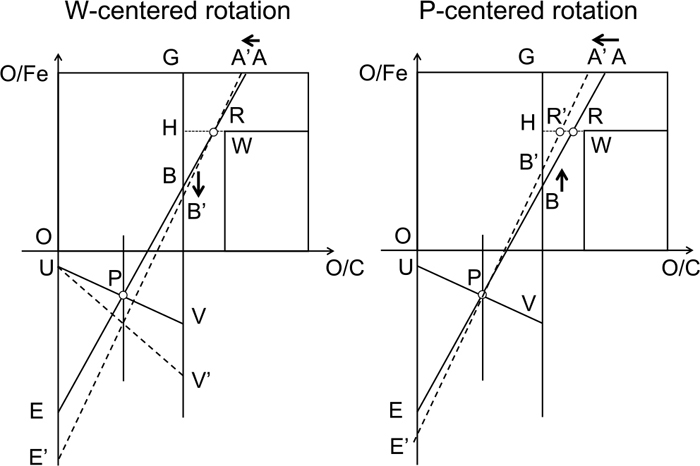
Here we define the terms “W-centered rotation” and “P-centered rotation” as illustrated in Fig. 2. The segment AE has two degrees of freedom in the Rist diagram; the slope (RAR) and the intercept (solution loss carbon). This means that the center of rotation of the segment AE varies when RAR is changed. The extreme cases are the W-centered rotation and the P-centered rotation.
In the case of W-centered rotation, point R representing the reduction efficiency is fixed. In the case of P-centered rotation, point P stays at the same position, which means that point V representing the sensible heat of hot metal neither moves. In normal operation, the rotation center exists between point R and point P. For example, Fig. 1 indicates the B-centered rotation, which is the intermediate state between the two. In the following, the case where RAR is increased is considered for the both extremes.
The W-centered rotation means the conversion ratio of CO into CO2 through the reduction of FeO1.05 is fixed. Therefore, when CO per iron is increased by the rise in RAR, the oxygen per iron, which is removed by CO gas through the reduction of FeO1.05, increases. As a result, the contribution of gas reduction becomes higher, and direct reduction which involves solution loss carbon becomes lower; point B moves to B’.
In the case of P-centered rotation, the reduction efficiency declines when CO per iron is increased by the rise in RAR; point R moves to R’. As a result, the contribution of gas reduction becomes lower, and direct reduction becomes higher; point B moves to B’. The increase of the input heat per iron by the rise in RAR is mainly utilized for the increase of solution loss carbon, not for the sensible heat of the lower furnace; point V stays at the same position. As a result, point P is fixed in the diagram.
The reason why we assume that the W-centered rotation and the P-centered rotation are the two extremes is as follows. The rotation center moves to higher position than point W only when the increase of RAR causes higher reduction efficiency. However, it is unnatural that chemical equilibrium is easier to achieve when more redundant CO per iron exists. It is also inconceivable that the rotation center exists in the lower position than point P, because it moves point V upwards. This means that the increase in the heat source results in the decrease in the sensible heat of the lower furnace; such a phenomenon rarely happens in ordinary operation.
4. Modeling Error
In this section, the cause of modeling error is investigated from the viewpoint of Rist diagram. It was found that the model calculation is similar to the P-centered rotation, whereas the actual data is akin to the W-centered rotation. We investigate how to adjust the model to be more similar to the W-centered rotation.
4.1. Cause of Modeling Error
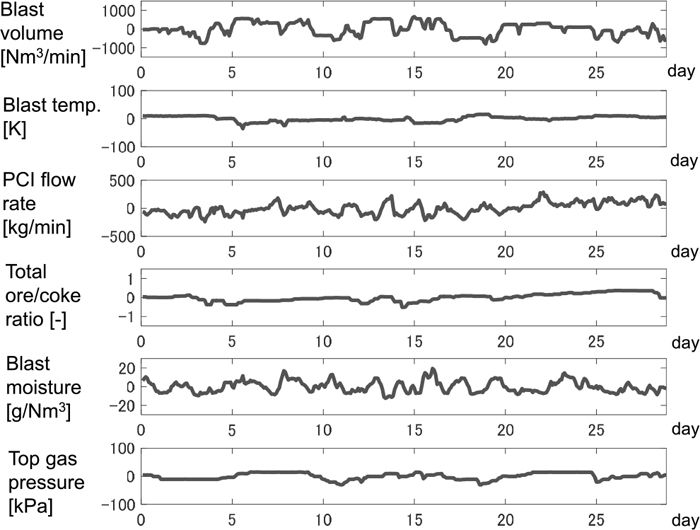
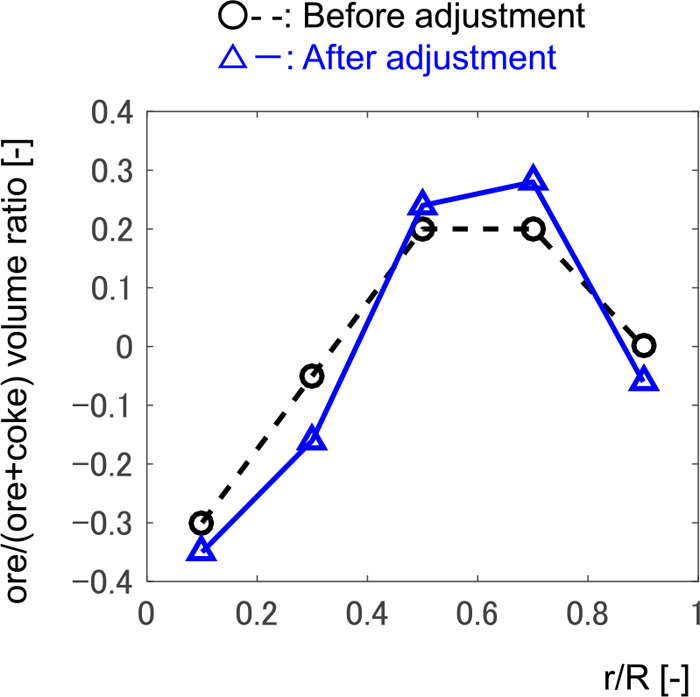
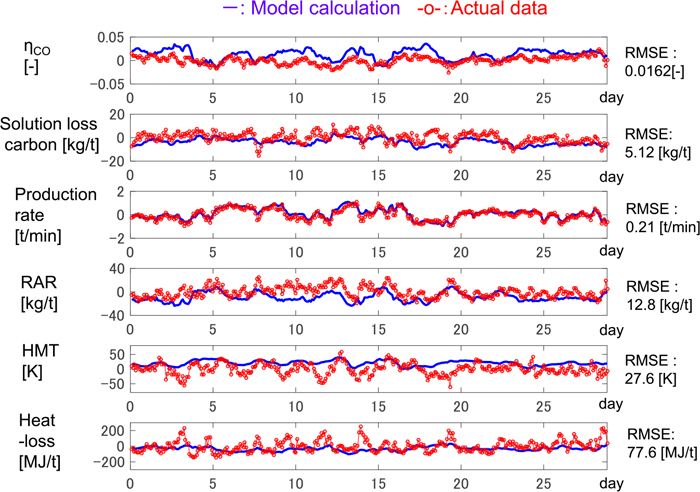
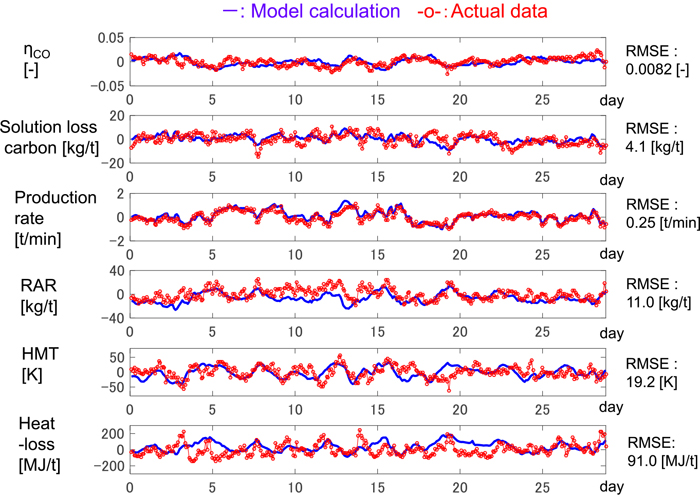
The calculation of the transient model was performed. Figure 3 shows the actual data of manipulated variables in a real plant, which were fed to the model. All variables are mean-centered. It was assumed that the distribution of ore-to-coke ratio was constant as shown in Fig. 4 (the line with circles). The distribution is measured occasionally in certain circumference direction by microwave distance meter. The averaged values of the measured data was used in this work. Figure 5 shows the model output and the corresponding actual data, in which all variables are the deviation from the mean value of the actual data.
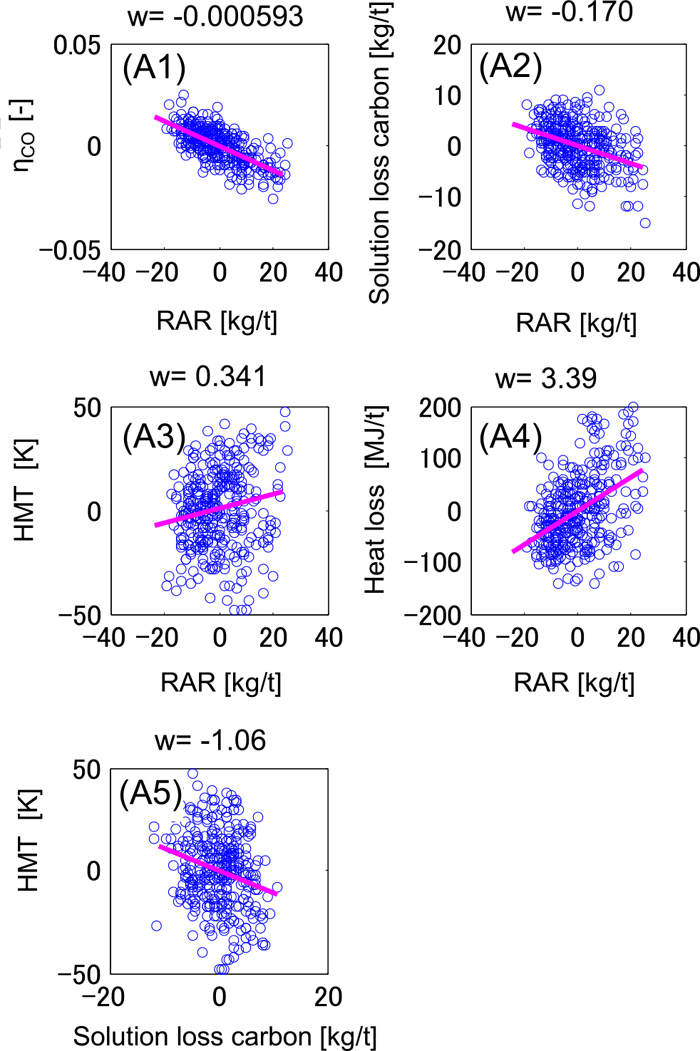
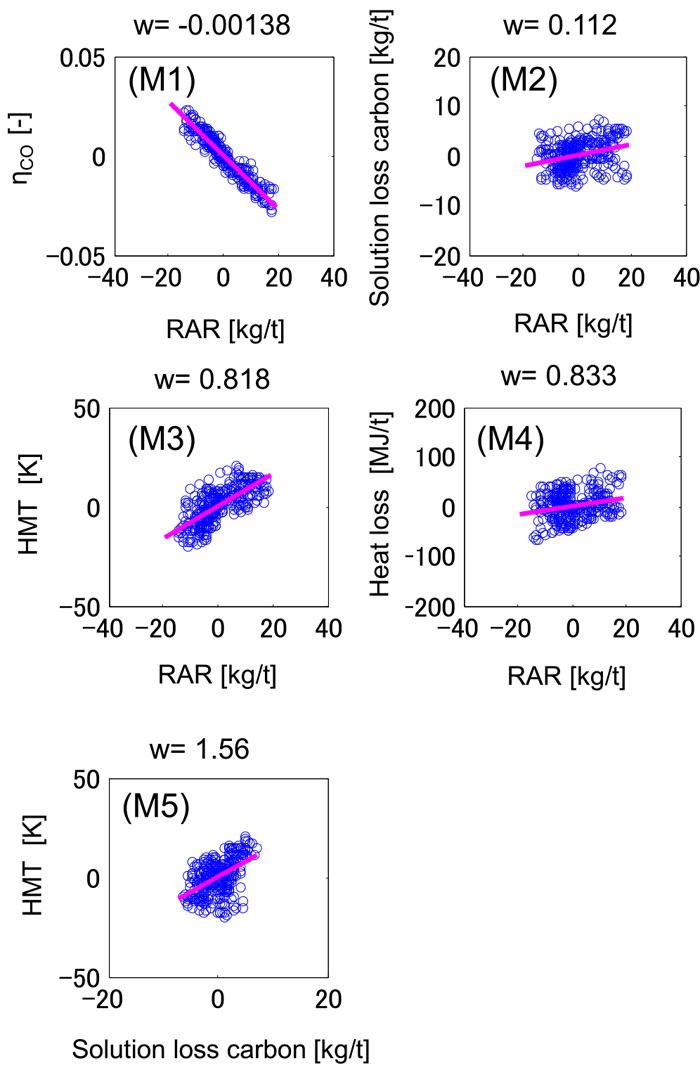
It was investigated whether the behavior of process variables is similar to the W-centered rotation or the P-centered rotation. The actual data and the calculation result are shown in Figs. 6 and 7, respectively, in which all process variables are mean-centered. Each point represents two-hour averaged value.
The behavior of the actual furnace is similar to the W-centered rotation because there is a negative correlation between RAR and solution loss carbon, as shown in Fig. 6(A2). On the other hand, the behavior of the transient model is akin to the P-centered rotation since their correlation is positive as shown in Fig. 7(M2).
This result is supported by the sensitivity of the gas utilization ratio to RAR in Figs. 6(A1) and 7(M1), which suggests that the slope is less significant in the case of actual furnace. As can be seen in Fig. 2, the movement of point A representing the gas utilization ratio is less remarkable in the case of W-centered rotation than that in the case of P-centered rotation. Hence, the actual data is akin to the W-centered rotation.
4.2. What Determines W-centered Rotation and P-centered Rotation
In this section, the phenomena in the furnace, which determine the P-centered rotation or the W-centered rotation, are discussed. In general, there exists a thermal reserve zone in a blast furnace where the rise of the burden temperature becomes gradual. Inside this region, a chemical reserve zone has been observed where the reduction of iron ore slows down.21,22) The CO/(CO+CO2) ratio, i.e. CO ratio, reaches the equilibrium between Fe and FeO1.05 in this zone. The fact that actual furnace is akin to W-centered rotation indicates little change of the CO ratio in the region where the oxidization degree of Fe is at 1.05; this supports the existence of the chemical reserve zone.
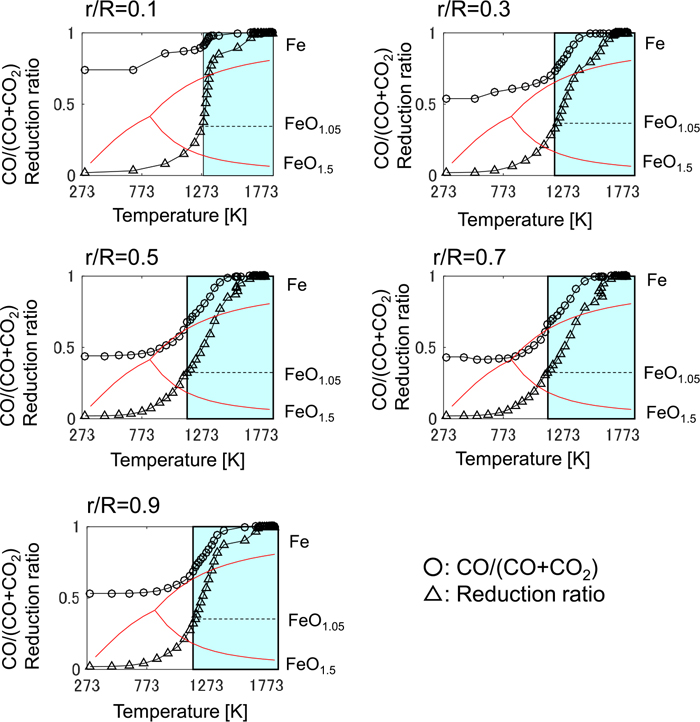
On the other hand, the relationship between the iron temperature and the CO ratio in the model calculation is shown in Fig. 8. The model inputs are average values of manipulated variables in Fig. 3. The bosh gas at the raceway is in the hot temperature region, where the CO ratio is close to one. While ascending in the furnace, the gas temperature declines through the heat exchange with the solid, and the CO ratio decreases due to the reduction of iron ore. In Fig. 8, the driving force of the reduction using CO gas is the difference between the CO ratio (the line with circles) and the CO ratio at the equilibrium between Fe and FeO1.05 (the top red line), when the oxidization degree is between 0 and 1.05 (the colored area). At any radial position in the furnace, the CO ratio never reaches the equilibrium line when the oxidization degree is between 0 and 1.05; that is, the CO ratio is different from the equilibrium state which seems to exist in the actual furnace. Hence, the CO ratio when the oxidization degree of Fe is at 1.05 may fluctuate significantly, which corresponds to the movement of point R in Fig. 1. This is the root cause of the P-centered rotation in the model calculation.
The heat balance in the lower part of the furnace is also the determinant factor of the rotation center. The input heat consists of the carbon combustion heat and the sensible heat of blast gas, while the output heat consists of sensible heat of hot metal, heat loss from furnace wall, and heat absorption caused by solution loss carbon. In the case where RAR is increased, the share of solution loss carbon decreases if the heat loss or the sensible heat of the hot metal increases remarkably. Comparing Figs. 6(A4) and 7(M4), the sensitivity of the heat loss to RAR is more significant in the actual furnace. It means that point V in Fig. 1 tends to move downwards when RAR increases in the actual furnace, which contributes to the W-centered rotation.
In the actual process, it has been reported that thickness of the solidified layer of iron at the bottom or the coating layer of slag at the side wall become thinner when the heat level rises.23) In the model calculation, the generation of such layers has not been taken into consideration. Moreover, it has been reported that the bosh gas tends to flow to the wall side when RAR is raised by increasing pulverized coal ratio, which causes the rise in the heat loss.24) This phenomenon is not considered in the calculation either. These are the cause of the small sensitivity of the heat loss to RAR in the model.
4.3. Countermeasure to Improve the Model Accuracy
The accuracy of the model is expected to improve by adjusting the model so that its behavior is similar to the W-centered rotation. To achieve this, the chemical reserve zone should be reproduced and the sensitivity of the heat loss to RAR should be increased. In the following, approaches to model improvement are investigated.
4.3.1. Loading Condition at the Furnace Top
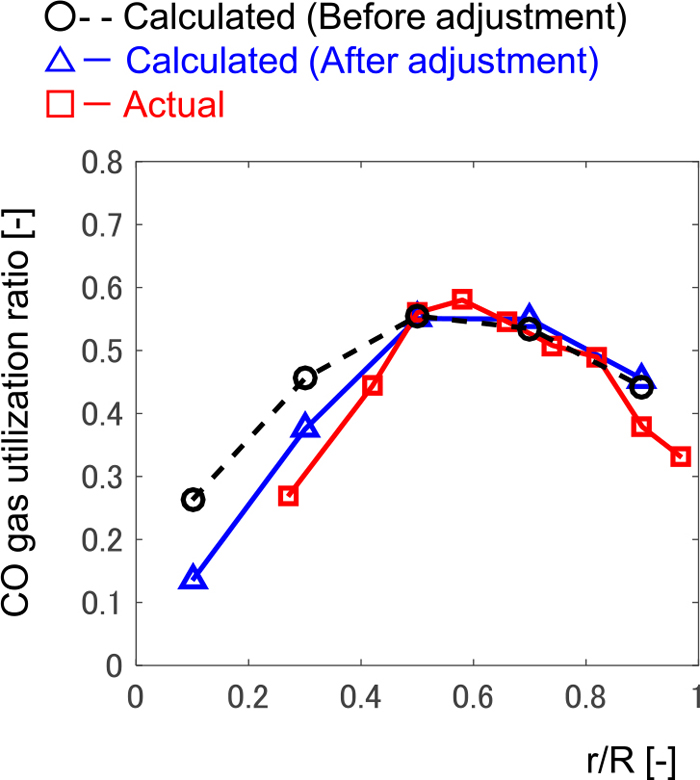
The radial distribution of the ore-to-coke ratio in Fig. 4 (the line with circles), which was employed in the calculation as the boundary condition in Fig. 5, may not be appropriate for the axisymmetric model calculation because it was measured in a certain azimuthal direction. Figure 9 compares the calculated and actual gas utilization ratio in the radial direction. Calculated and actual data are the mean values during the period in Fig. 5. To decrease the difference between the calculated and actual radial distributions, the ore-to-coke distribution was changed as shown in Fig. 4 (the line with triangles) while preventing the iron ore from reaching the hearth region without being fully reduced, which is not supposed to occur in the regular operation. This modification of the radial distribution of the ore-to-coke ratio is effective to reproduce W-centered rotation.
The existence of the region where plenty of unreduced iron ore exists for the CO gas is effective to ensure the region where the equilibrium is attained. In such a case, considering the process of CO rising in the furnace, unreduced FeO1.05 still exists when CO partially turns into CO2 by the reduction. As a result, the CO gas reduction is driven by the deviation from the CO ratio at the equilibrium with Fe/FeO1.05 for a long period, which allows the CO ratio to reach the equilibrium line in Fig. 8.
On the other hand, the increase of the region where a limited amount of iron ore exists also contributes to reproduce the W-centered rotation. If the amount of iron per CO is small, the sensitivity of the CO ratio to RAR is low, because it is difficult for CO to turn into CO2 regardless of the oxidization degree of iron. As a result, the sensitivity of the reduction efficiency to RAR in Fig. 1 is expected to become weaker.
4.3.2. Reaction rates of Gas Reduction and Coke Gasification
The CO/(CO+CO2) ratio, i.e. the CO ratio, of the bosh gas in the temperature zone where the chemical reserve zone forms is determined mainly by the balance between the reduction rate by CO (R1 in Table 3) which consumes CO gas, and coke gasification rate (R2 in Table 3) which produces CO gas. To achieve chemical equilibrium, it is desirable to accelerate R1 and decelerate R2. Originally, 0.1 was multiplied to the experimental reaction rate of R1 in Section 4.1, according to the previous study.18) This factor was increased to 0.15 so that the average of the calculated gas utilization ratio coincides with that of actual data. The reduction rates of FeO1.5, FeO1.33, and FeO1.05 are different in the model. The reduction rate of FeO1.05 was modified in this work since it is responsible for the chemical reserve zone. The reaction rate of R2 was not changed in this work.
4.3.3. Heat Loss
A radical countermeasure is to take account of the solidification layers and the drift of gas flow in the model. However, to avoid making the model more complicated, the heat flux in Eq. (12) was modified as follows:
|
q=-h(
T
g
4
-
T
w
4
)
| (13) |
where the exponent 4 was chosen so that the average of the absolute value of the hot metal temperature coincides with the actual data. The reason why we did not simply increase
h but powered
Tg is that the heat loss is expected to increase remarkably when the heat level of the furnace rises due to the increase in RAR.
5. Model Calculation after the Adjustment
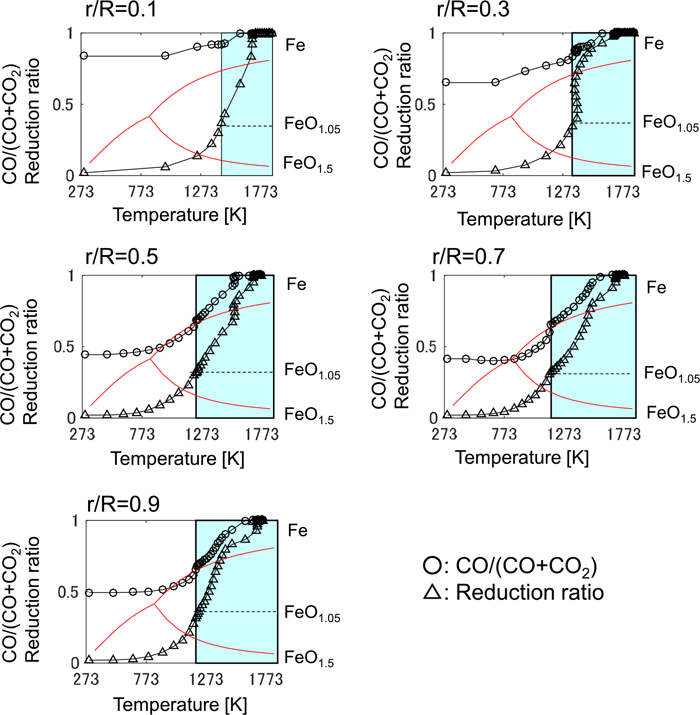
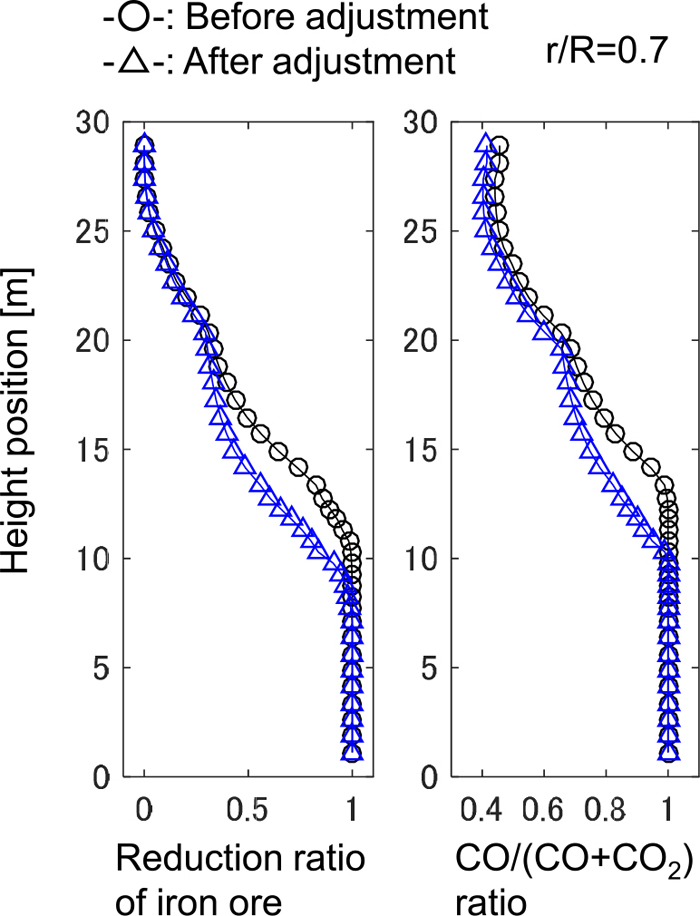
The relationship between the iron temperature and the CO ratio in the model calculation after the adjustment is shown in Fig. 10. Compared with Fig. 8, the CO ratio reaches at the equilibrium line of Fe/FeO1.05 in the region where non-dimensional radial position r/R is from 0.5 to 0.7. The distribution of reduction ratio and the CO ratio in height direction is shown in Fig. 11. The chemical reserve zone, where the oxygen exchange between CO and iron ore becomes gradual, is emphasized after the adjustment.
The sensitivity of gas utilization ratio, solution loss carbon, hot metal temperature, and the heat loss to RAR after the adjustment is shown in Fig. 12. Compared with the case before the adjustment in Fig. 7, the sensitivity is closer to that of the actual data in Fig. 6. For instance, the positive correlation in Fig. 7(M2) changes to the negative correlation in Fig. 12(M’2), which is in accord with actual data in Fig. 6(A2). This result demonstrates that the W-centered rotation in the actual furnace was reproduced successfully. The calculation errors of process variables shown in Fig. 13, in which all variables are the deviation from the mean value of actual data, are smaller than those in Fig. 5. The calculation accuracy of hot metal temperature and gas utilization ratio was improved by 50% in RMSE (Root mean squared error).
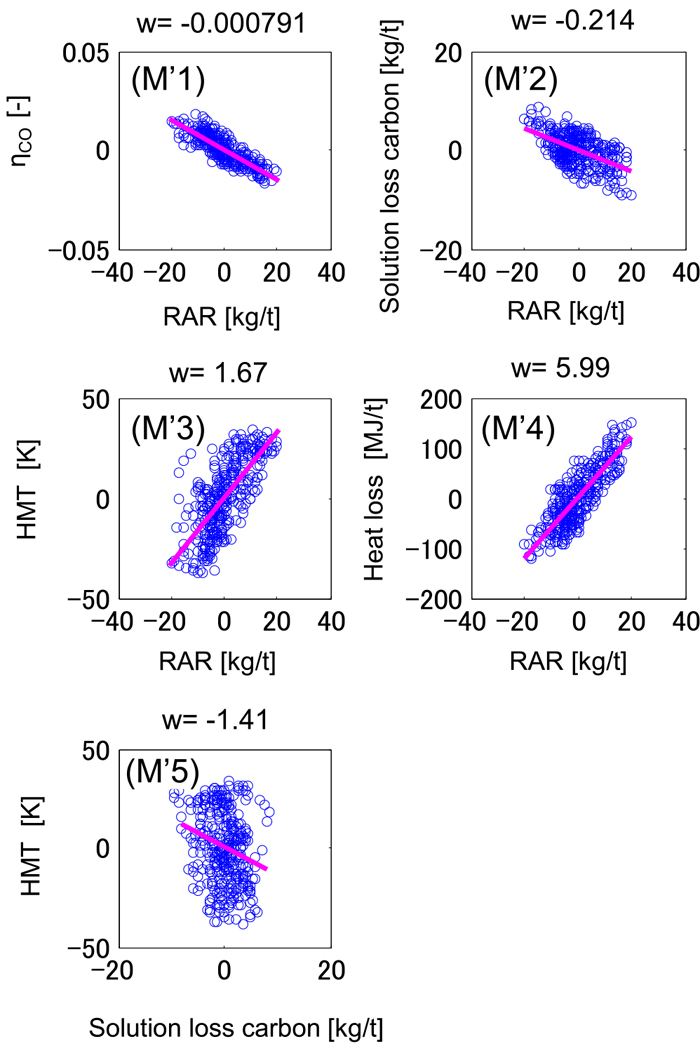
In this way, the consideration of the mass and heat balance with the Rist diagram gives a straightforward method to adjust the kinematic model to agree with the actual furnace. Whether or not the W-centered rotation (or the P-centered rotation) is reproduced can be a barometer of the accuracy of a blast furnace model.
6. Conclusion
In this research, a new transient 2D model for online use was established. The accuracy was evaluated by the comparison with the actual data for one month. The guideline of adjusting the model to reproduce the behavior of process variables, when RAR is changed, was discussed from the viewpoint of mass and heat balance with the Rist diagram. As a result, it was found that appropriate consideration of the chemical reserve zone and the heat balance of the furnace was effective to fit the developed model to the actual data.
References
- 1) I. Muchi: Trans. Iron Steel Inst. Jpn., 7 (1967), 223.
- 2) M. Hatano, Y. Misaka, Y. Matoba and K. Otsuka: Tetsu-to-Hagané, 67 (1981), 518.
- 3) K. Otsuka, Y. Matoba, Y. Kajiwara, M. Kojima and M. Yoshida: ISIJ Int., 30 (1990), 118.
- 4) M. Hatano, K. Kurita, H. Yamaoka and T. Yokoi: Trans. Iron Steel Inst. Jpn., 25 (1985), 933.
- 5) Y. Ujisawa: CAMP-ISIJ, 22 (2009), 881, CD-ROM.
- 6) X. F. Dong, A. B. Yu, S. J. Chew and P. Zulli: Metall. Mater. Trans. B, 41 (2010), 330.
- 7) Y. Shen, B. Guo, S. Chew, P. Austin and A. Yu: Metall. Mater. Trans. B, 47 (2016), 1052.
- 8) K. Yang, S. Choi, J. Chung and J. Yagi: ISIJ Int., 50 (2010), 972.
- 9) D. Fu, Y. Chen, Y. Zhao, J. D. Alessio, K. J. Ferron and C. Q. Zhou: Appl. Therm.Eng., 66 (2014), 298.
- 10) S. B. Kuang, Z. Y. Li, D. L. Yan, Y. H. Qi and A. B. Yu: Miner. Eng., 63 (2014), 45.
- 11) K. Takatani, T. Inada and Y. Ujisawa: ISIJ Int., 39 (1999), 15.
- 12) K. Nishioka, Y. Ujisawa and K. Takatani: CAMP-ISIJ, 25 (2012), 957, CD-ROM.
- 13) P. R. Austin, H. Nogami and J. Yagi: ISIJ Int., 37 (1997), 458.
- 14) J. A. Castro, H. Nogami and J. Yagi: ISIJ Int., 40 (2000), 637.
- 15) J. Yagi: ISIJ Int., 33 (1993), 619.
- 16) J. A. Castro, A. J. Silva, Y. Sasaki and J. Yagi: ISIJ Int., 51 (2011), 748.
- 17) S. Ueda, S. Natsui, H. Nogami, J. Yagi and T. Ariyama: ISIJ Int., 50 (2010), 914.
- 18) K. Takatani: Tetsu-to-Hagané, 81 (1995), 1031.
- 19) A. Rist and G. Bonnivard: Rev. Métall., 60 (1963), 23.
- 20) Y. Sawa, K. Takeda and S. Taguchi: Proc. 59th Iron Making Conf. AIME, Vol. 50, Iron & Steel Society, Warrendale, PA, (1991), 417.
- 21) K. Okabe, T. Hamada and A. Watanabe: Tetsu-to-Hagané, 55 (1969), 764.
- 22) C. Yamagata, T. Yamamoto, Y. Kajiwara, T. Inada, S. Ohara and Y. Nakamura: Ironmaking Steelmaking, 17 (1990), 394.
- 23) Y. Zhao, D. Fu, L. W. Lherbier, Y. Chen, C. Q. Zhou and J. G. Grindey: Steel Res. Int., 85 (2013), 891.
- 24) R. Murai, A. Murao, K. Goto, M. Sato and T. Ariyama: Tetsu-to-Hagané, 88 (2002), 249.