Abstract
We have investigated the crystallographic orientation relationship between ferrite and austenite and the interfacial planes between them of a low-carbon steel formed by the transformation from ferrite to austenite upon heating. Three-dimensional investigation using EBSD measurement with FIB serial sectioning technique is carried out on samples quenched from an early stage of the reverse transformation. The prior austenite orientation of martensite in the quenched microstructure is determined based on an analysis of the variants in the Kurdjumov–Sachs (K–S) relationship and the three-dimensional ferrite–austenite microstructure is successfully reconstructed. The crystallographic analysis on the three-dimensional microstructure has revealed that the nucleus of reverse-transformed austenite maintains the K–S relationship or close to it with two or three adjacent ferrite grains. The significance for reverse-transformed austenite to select these specific orientation relationships was estimated through a statistical assessment. In addition, the influence of crystallographic relationship between ferrite and austenite to nucleation and growth of reverse transformation is discussed.
1. Introduction
To control the microstructure in low-carbon steels, it is important to thoroughly understand the nucleation and growth of the austenite (γ) phase which was transformed from the ferrite (α) phase upon heating. Comprehension of the origin of the austenite formation will contribute to appropriate control of martensite in steel products after quenching in the heat treatment process. The nucleation and growth of austenite are affected by the interfacial energy and mobility of the α/γ interface.1,2) Therefore, the crystallographic relationship between ferrite and austenite is of much importance on the austenite formation because the orientation relationship and the boundary plane between the two phases characterize the structure of the interface.
Several studies on steel texture have shown that the orientation of austenite after reverse transformation does not occur randomly, but it is strongly related to the initial texture of the ferrite phase before the transformation. For example, ferrite-to-austenite transformation occurring in an intercritical annealing range is known to indicate the memory effect.3,4,5,6) There must be a rule that determines austenite orientation in relation to the initial ferrite texture. The variant selection of austenite during reverse transformation has been discussed in the literatures and several models have been proposed.3,4,5,6,7,8,9,10,11,12,13,14,15,16,17,18,19)
Tomida et al. proposed the variant selection model to predict the texture change in α→γ transformation based on the orientation relationships at multiple interfaces with different ferrite grains.9,10) In these studies, the variant of austenite is assumed to be selected to simultaneously satisfy the Kurdjumov–Sachs (K–S) relationship20) with one ferrite grain and an orientation relationship near the K–S relationship with about 10° of the tolerance angle with other adjoining ferrite grains. They have shown that the texture change is quantitatively predictable by their model. Although the model was initially developed for the austenite to ferrite transformation, it was subsequently proved to be applicable to texture changes occurring in reverse (ferrite to austenite) phase transformation.10)
Lischewski et al. observed the α→γ phase transformation in a C–Mn steel containing microalloying elements by in situ electron backscattering diffraction (EBSD) measurement and analyzed the orientation relationship between the parent ferrite grains and transformed austenite grains at triple junction.17,18) They found that a considerable number of transformed austenite grains are related to two adjacent mother grains by the approximate K–S relationship and deduced that the reason for such a variant selection is due to the preferential nucleation of the K–S variant with low interfacial energy.
The present authors investigated the frequency of the orientation relationship between austenite and adjacent ferrite grains during the reverse transformation.19) There is a tendency that austenite grains satisfy the K–S relationship or the near K–S relationship with plural adjacent ferrite grains. The misorientation from the K–S relationship is reduced in the orientation relationships with all of the adjacent ferrite grains. It is suggested that the nucleation process of austenite is crystallographically related to not only one or two adjacent ferrite grains but all the adjacent ferrite grains at triple junction.
Aaronson and co-workers studied the geometrical atomic matching on the interphase boundary between bcc and fcc structures by microscopic observation and computer simulation.21,22) They demonstrated that an interface with the K–S relationship or the Nishiyama–Wasserman (N–W) relationship23) realizes the partial coherent atomic matching between ferrite and austenite. In addition, the coherency between ferrite and austenite significantly influences the growth behavior because the mobility of the α/γ interface is also a function of the coherency between the two phases.24)
The nucleation frequency and growth direction of austenite may be affected by specific orientation relationships with adjacent parent grains. To elucidate the contribution of orientation relationships on the behavior of nucleation and growth of austenite, the orientation relationships between austenite and all neighboring ferrite grains must be considered. However, information on the internal structure of a material is not obtained when a conventional observation technique is applied on the surface of the material. Therefore, the true conjugation relationship and interfacial planes between ferrite and austenite is yet to be discussed. For analyzing the entire crystallographic relationship around an austenite grain, the three-dimensional microstructure must be considered. In recent years, material characterization has been performed by the serial sectioning method using focused ion beam (FIB) with SEM–EBSD analysis.25,26,27) This technique has enabled precise processing of materials and crystallographic analysis of three-dimensional microstructures.25) The spatial resolution is sufficient to measure individual submicron-size crystals in steel, such as the same size dimension of substructures in martensite.26)
One difficulty to observe directly the ferrite–austenite microstructure in low-carbon steels at room temperature is that the austenite phase is not stable during cooling. Recently, several analytical methods to determine the austenite orientation from the ferrite one were developed.28,29,30,31) In these methods, prior austenite orientation can be found through an analysis on the martensite variants based on the K–S relationship. An application of the analytical methods to crystallographic study has been developed by Li et al.34) They estimated the orientation of austenite grains which reversely transformed from pearlitic structure in an Fe-0.6C-1Cr alloy on the basis of the orientation analysis of lath martensite by EBSD. Using the estimated austenite orientation, they successfully analyzed the orientation relationship between reverse-transformed austenite and pearlitic ferrite.
In the present study, a novel method to reconstruct a three-dimensional microstructure consisting of austenite and ferrite is developed to analyze the crystallographic relationship in the early stage of ferrite to austenite reverse transformation. A ferrite-martensite microstructure was produced by a heat treatment followed by quenching and three-dimensional EBSD analysis was carried out by serial sectioning method using FIB-SEM. In the crystallographic analysis, the contiguity relationship and the boundary planes between each austenite grain and all the adjacent ferrite grains in the reconstructed three-dimensional microstructure are taken into consideration. The influence of orientation relationship to grain-growth of austenite is also investigated by in situ EBSD technique using a heating stage. Although the observation by this technique is performed on sample surface, attention is paid to measure the grain-growth behavior of austenite with the orientation relationships to the adjacent ferrite grains. The influence of the crystallographic relationship between ferrite and austenite to the nucleation and grain-growth behaviors of austenite is discussed.
2. Experimental Procedure
2.1. Material Preparation and Three-dimensional EBSD Measurement
An Fe-1.0Mn-0.1C (mass%) low-carbon steel was melted and cast as a 50-kg ingot in a vacuum induction furnace. The ingot was hot-rolled to 2 mm in thickness and cooled to 710°C by water spray; this was followed by furnace cooling to room temperature with a cooling rate of 20°C/h. The plate was then cold-rolled to 1 mm in thickness, and test pieces were cut from the middle part of the plate with dimensions of 200 × 10 × 1 mm3. After that, heat treatment was performed between 710 and 730°C with a heating rate of 5°C/s, and the test pieces were immediately quenched from the set temperature at a rate of faster than 1000°C/s using a high-pressure water spray system. For SEM observation, rectangular samples with dimensions of 15 × 7 mm2 were cut from the test pieces. Their surfaces were polished mechanically and then chemically etched in a solution of 5% nitric acid and 95% ethanol. Observations of microstructure were conducted using a field-emission scanning electron microscope (FE-SEM), operating at 20 kV. Samples for TEM observation were prepared form the heat-treated test pieces; they were mechanically ground to a thickness of less than 0.1 mm and punched to discs with 3 mm in diameter. Then, they were electropolished using an electrolyte solution containing 5% perchloric acid and 95% acetic acid. TEM observations were conducted using a Hitachi HF-2000 operating at 200 kV. The TEM carbon replica samples were also prepared to observe carbide distribution in the samples.
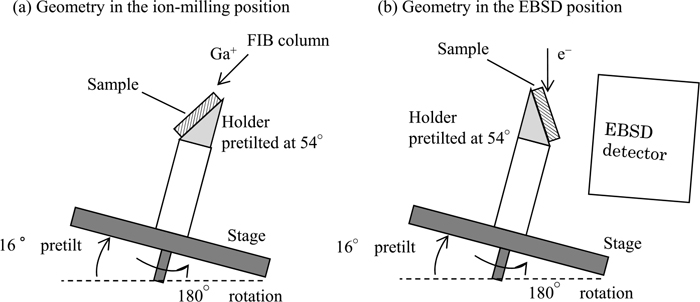
Three-dimensional EBSD was performed using FEI Quanta 3D FEG, a FE-SEM equipped with an ion-beam column and an EBSD detector (TSL Hikari). The sample is installed on a holder pretilted at 54° and mounted on a stage reversely tilted by 16° from the horizontal position, as shown in Fig. 1(a). This setup realizes grazing-incidence ion milling by the ion-beam column which is mounted at an angle of 38° from the vertical. The movement from the milling position to the EBSD position is accomplished by rotating the stage by 180° (Fig. 1(b)), followed by automatic adjustment of the stage to the eucentric position by detection of a fiducial marker that is milled next to the measured area. The plane of the sample was sliced by sputtering of a Ga+ ion beam accelerated to 30 keV at a step of 0.1-μm thickness. On each of the sputtered planes, EBSD measurement was performed in a 27 × 40 μm2 area with a step size of 80 nm in a rectangle scan grid. The acquired EBSD data set includes a slight displacement among adjacent sections due to sample drift in the position during the measurement. For precise alignment of the EBSD maps, the deviation of each image is corrected by a calculation method using the Euler angles and its position (X, Y) in the EBSD maps. The differences of Euler angles at the corresponding positions between any of two EBSD image data are calculated and are compared each other in the whole serial sections. The position of the each EBSD image data is corrected as the exact position with a minimum difference of Euler angles among adjacent sections.25)
The chemical composition of the steel used for in situ EBSD measurement is selected to be Fe-0.2C (mass%) instead of Fe-1.0Mn-0.1C, in order to avoid the demanganization at high temperature. It is discussed later that the decarburization is not affected during the present in situ EBSD measurement at high temperature. The ingot was hot-rolled and cold-rolled in the same way to the samples for three-dimensional measurement to a sheet of 1.5 mm in thickness. A sample for in situ EBSD measurement was cut from the sheet in dimensions of 5 × 7 mm and the surface plane was mechanically grinded to 0.8 mm in thickness. The surface of the specimen was polished mechanically and then chemically with colloidal silica suspension. A high temperature EBSD measurement was carried out using a FE-SEM (FEI Quanta 200 FEG) equipped with the heating stage made by TSL Solutions Japan. The heating condition in range from 680 to 810°C is shown in Fig. 2. The EBSD measurement was carried out at each temperature between 680 to 810°C during about 10 min. in order to measure the orientation of austenite and ferrite during the grain-growth of austenite.

3. Experimental Results
3.1. Microstructure in the Early Stage of the Ferrite-to-austenite Transformation
The microstructures of the samples which were heat-treated between 710 and 730°C and subsequently quenched were investigated by SEM observation in order to trace the changes in the microstructures. It was confirmed that the microstructure changed in a manner similar to that observed in conventional annealing of cold-rolled steel;35,36) i.e., the initial cold-rolled ferrite microstructure recrystallized by 710°C during the heating process with a rate of 5°C/min and then the reverse transformation to austenite occurred at over 710°C. The details of the microstructures quenched from the state before and after the reverse transformation were as follows.
The microstructure of the sample produced by heat treatment at 710°C is shown in Fig. 3(a). The microstructure comprises recrystallized ferrite grains and dispersed cementite particles. In the sample quenched from 730°C (Fig. 3(b)), regions containing martensite appear at the triple junction of the ferrite grains as indicated by arrows in Fig. 3(b). Since the martensite phase is produced by quenching from the austenite phase, it is considered that the reverse transformation has occurred at the vicinity of triple junction during the heating process between 710 and 730°C. The volume fraction of the transformed austenite at 730°C was estimated to be ~6%.

To understand the role of cementite as the possible nucleation site of austenite, the ferrite triple junctions in the sample quenched from 710°C were observed using the carbide extraction replica TEM technique. The bright field micrograph is shown in Fig. 4, wherein cementite particles are shown as black particles and ferrite grain boundaries are imaged as thin curves. Most of the triple junctions do not accompany cementite particles, and the cementite particles disperse inside the ferrite grains rather than on the grain boundaries. Some of the cementite particles are aligned along the horizontal direction of the micrograph, i.e., along the direction of cold rolling; this indicates that the cementite particles remain at the initial position in the cold-rolled microstructure even after recrystallization. Therefore, it is considered that the cementite particles are not adjacent to austenite nucleus when the reverse transformation occurred.

The martensite in the sample quenched from 730°C (Fig. 3(b)) was investigated by TEM observation. Figure 5 shows a typical martensite region, which must have been austenite region at 730°C, with a highly black contrast. Martensite appears at the ferrite triple junctions in the microstructure and the interfaces to adjacent ferrite grains are observed to be straight in most cases. Cementite particles are observed inside ferrite grains, and martensite is not observed around them. It is indicated that austenite nucleation did not occurred around the cementite particles in ferrite grains even after austenite appears at the triple junction.

From the above mentioned observations, it is confirmed that austenite transformed firstly at the triple point of the ferrite matrix in the early stage of the reverse transformation. The microstructure of the sample quenched from 730°C is considered to be quenched from the early stage of the reverse transformation since the fraction of martensite is small. Hence, a three-dimensional analysis was performed for the sample quenched from 730°C.
3.2. Determination of Prior Austenite Orientation from Martensite Blocks
A series of crystal orientation mapping data of the microstructure comprising ferrite and martensite in the sample quenched from 730°C was obtained by the three-dimensional EBSD measurements. Figure 6 shows a part of cross-sectional mappings including one region of martensite. The colors in the mappings indicate the orientations along the normal direction of the sample being consistent with the referential standard stereographic triangle attached in Fig. 6.
Inside the martensite in each mapping, plural martensite blocks or packets with different orientations are identified. For example, in Fig. 6(a), two martensite blocks, Block 1 (yellow) and Block 2 (blue), appear in the martensite. In the following, such an area or volume with the same orientation is referred simply as a martensite block. The remaining dark area is the part of the martensite; the orientation data could not be obtained owing to the low quality of EBSD patterns measured at 80 nm steps.
Since these martensite blocks transformed from one austenite crystal, the orientations of the martensite blocks are supposed to correspond to the variants of a specific orientation relationship. By defining the orientation relationship between the two phases and by identifying the corresponding variant to the martensite blocks, the orientation of the prior austenite can be calculated from the orientation of the martensite blocks. The orientation relationship and the corresponding variant are determined by the following analysis method.
The plural orientations of prior austenite are calculated tentatively from the orientations of different martensite blocks with assuming orientation relationship and variant correspondence. When the appropriate orientation relationship and variant relationship is given, the austenite orientations calculated from different martensite blocks must agree each other, otherwise the austenite orientations will be inconsistent with each other. When three or more austenite orientations agree with each other within a predefined tolerance angle, prior austenite orientation is identified as the average of these calculated orientations. In the present study, the tolerance angle to access the common austenite orientation is set to 5°. The orientation relationship is defined as one which has deviation from the exact K–S relationship by 1.4° in close-packed directions (<011>γ and <111>α) and 0.1° in close-packed planes ({111}γ and {011}α); those deviations are determined by an optimization of the orientation relationship for experimentally measured martensite blocks.38,39) The detail of calculation method for prior austenite orientation is explained in the other reports written by some of the present authors and others.28,29,30,31,32,33)
An example of the analysis result for the martensite blocks shown in Fig. 6 is shown in Fig. 7, where a 001-pole-figure projection of the experimentally measured orientations of martensite blocks, the analyzed austenite orientation and the ideal orientations of 24 variants derived from the determined austenite orientation are indicated. The orientations of the variants derived from the determined austenite orientation are consistent with those of the measured martensite blocks.
In the present study, 89 regions of martensite were totally investigated in the three-dimensional microstructure analysis. The 21 martensite regions among them are partially appeared on the surface of initial sample, in which 10 regions face to the surface with the area lower than 5% to the whole interface area of each martensite region, and the other 11 regions face to the surface more than 5%. The later 11 regions are excluded from the present study.
In most cases, the determination method singled out a prior austenite orientation for a martensite region. In a few cases, however, two prior austenite orientations were found in a martensite region. In the latter cases we regard that two austenite grains existed before quenching. The average of the misorientations among the calculated austenite orientations from different martensite blocks is 2.8°, which indicates that the orientations of prior austenite are obtained with good accuracy.
In order to reconstruct the three-dimensional ferrite–austenite microstructure at 730°C, we replace the orientation data in martensite regions with the determined prior austenite orientations. A reconstructed microstructure that includes an austenite grain and its adjacent ferrite grains is shown in Fig. 8. The grains are expressed as aggregates of voxels with dimension of 0.08 × 0.08 × 0.1 μm3. The colors of the grains follow the pattern shown in Fig. 6. We know the contiguity relationship of the grains from the three-dimensional microstructure. For instance, the austenite grain shown in Fig. 8 has five adjacent ferrite grains. Based on the similar observations, we classified the austenite grains by the number of adjacent ferrite grains, and the ratio is shown in Table 1, Most of (90%) the austenite grains are adjacent to four or five ferrite grains, while 10% of them are adjacent to three ferrite grains. These austenite grains are considered to have nucleated at the grain corner or grain edge of ferrite during the heat treatment.

Table 1. Number of interfaces to neighboring ferrite grains for each martensite.
| Number of adjacent ferrite grains | Number of austenite precipitates | Ratio (%) |
|---|
| 2 | 0 | 0% |
| 3 | 8 | 10% |
| 4 or 5 | 70 | 90% |
The orientation relationship between the austenite grains and the adjacent ferrite grains is evaluated based on the misorientation ΔθKS from the K–S relationship; ΔθKS is defined as the smallest rotation angle between all the 24 K–S variants of the determined austenite orientation and the orientation of the adjacent ferrite grain. For calculating ΔθKS, the following relationships are used.
|
P=
g
α
(
R
j
V
i
KS
g
γ
)
-1
| (1) |
|
Δ
θ
KS
=
cos
-1
(
(
P[
1,1]
+P
[2,2]
+P
[3,3
]-1
)
/2
)
| (2) |
P corresponds to the rotation from the ideal orientation of ferrite which relates to the austenite orientation by the exact K–S relationship to the measured ferrite orientation.
V
i
KS
represents the exact K–S relationship, which is expressed by a 90° rotation around the <112> axis of the austenite crystal coordinate system.9) For example, the orientation relationships between the austenite grain and five adjacent ferrite grains shown in Fig. 8 are analyzed as follows. The orientation relationship of the austenite grain with Ferrite grain 1 deviated from the K–S relationship by a ΔθKS of 2°; the deviation is 3°, 9°, 22°, and 23° in the cases of Ferrite grains 2, 3, 4, and 5, respectively. When the orientation relationship with ΔθKS<3° is considered as the K–S relationship and 3°≤ΔθKS<10° as the orientation relationship near to the K–S relationship, two of the five ferrite grains (Ferrite grains 1 and 2) correspond to the K–S relationship; one (Ferrite grain 3) is near to the K–S relationship.
Similarly, the orientation relationship of all the austenite grains and adjacent ferrite grains are investigated. 42% of the austenite grains maintain these orientation relationships with two adjacent ferrite grains, and 31% of the austenite grains have three adjacent ferrite grains with such an orientation relationship. 27% austenite grains have just one ferrite grain with the K–S relationship.
3.3. In situ EBSD Measurement at Elevated Temperatures
In order to measure the grain-growth of austenite, microstructures at different temperatures from 730 to 810°C were measured by EBSD in the same field of view of the microstructure. The microstructures at the different temperatures are shown in Figs. 9(a) to 9(d), where the image quality mapping of EBSD patterns of ferrite grains is indicated in gray scale image and the austenite grains in red color are superimposed on it.

In Fig. 9(a) (730°C), a reverse transformed austenite grain mainly appeared at the triple junction of ferrite grains which were already recrystallized before reaching to the observation temperature. With rising the temperature (Figs. 9(b) to 9(d)), the austenite grains grew into adjacent ferrite grains. When the temperature reaches at 840°C, the whole microstructure transforms to austenite. The start and finish temperatures of the reverse transformation agree with the transformation temperatures of the same composition of steel in the phase diagram, which indicates that composition change in the sample hardly occurred during the observation.
The distance that the different α/γ interfaces migrated during grain-growth varies considerably. For example, when the microstructure at 730°C (Fig. 9(a)) is compared with that at 790°C (Fig. 9(c)), grain-growth of austenite was performed mainly by the specific α/γ interfaces indicated by the arrows in Fig. 9(c).
By performing similar in situ EBSD measurements several times, 74 α/γ interfaces were measured. The relationship between the distance of interface migration and the orientation relationship is shown in the Fig. 10. Here, the distance of the α/γ interface migration, ΔD is defined as the difference of the position of the interface between 730 and 790°C, which are measured in the vertical direction to the interface. The orientation relationship is analyzed as the misorientation from the K–S relationship, ΔθKS. The interfaces with the ΔθKS lower than 9° migrated less than 1.0 μm. It is indicated that the migration of α/γ interface with the K–S relationship or the near K–S relationship is remarkably suppressed. ΔD of the interfaces with ΔθKS over 9° ranges to 8 μm whereas it varies widely according to the interfaces. The grain-growth of austenite is performed mainly by the interfaces with the orientation relationship deviated largely from the K–S relationship.
4. Discussion
The three-dimensional ferrite–austenite microstructure was successfully reconstructed by serial sectioning EBSD measurements combined with the method of determining prior austenite orientation. In most cases, the determination method proposed in the present study was able to determine the orientation of prior austenite from plural variants in a region of martensite. Each austenite grain was adjacent to three-to-five ferrite grains, which implies that the nucleation of austenite occurs at the grain corners or grain edges of the ferrite matrix. In the microstructure before austenite formation, it was confirmed that the cementite particles located randomly in the microstructure. The grain corner and triple junction where eventually the nucleation of austenite occurred are not accompanied the cementite particles in most case in the present study. It is considered that the cementite particles does not influence to the orientation of the reverse transformed austenite. Concerning to the similar three-dimensional analysis on the transformation between ferrite and austenite, Zhang et al. has investigated the orientation relationship during the forward (γ → α) transformation upon cooling in Co-15Fe alloy,40,41) and concluded that reverse transformed austenite is related with one or two of adjacent ferrite grains by the K–S relationship or the N–W relationship. Most of the austenite grains satisfied the K–S relationship with one adjacent ferrite grain in the present study however other adjacent ferrite grains also satisfied the orientation relationships near to the K–S relationship.
In the following analysis, in order to clarify the statistical significance of the near K–S relationship as the second and the third orientation relationship is discussed. The frequency of the experimentally determined orientation relationships was evaluated with the misorientation from the K–S relationship, ΔθKS. For the evaluation, the frequency of the measured orientation relationships was compared with the probability of orientation relationship with assuming that the austenite orientations are selected randomly. The random orientations of austenite are estimated under the following assumptions;
1. Austenite transforms at the grain corners and edges as long as it maintains the exact K–S relationship with just one of the adjacent ferrite grains.
2. The orientation relationships with the other adjacent ferrite grains are distributed randomly.
Therefore, the random orientation of austenite,
g
assumed
γ
can be given as;
|
g
assumed
γ
=
V
i
KS-1
g
j
α
| (3) |
g
j
α
represents the orientation of the adjacent ferrite grains measured in the experiment and the index j discern the adjacent ferrite grains (j = 1–4 or 5). All the possible austenite orientations were generated under this condition; then, their orientation relationships with the adjacent ferrite grains were analyzed using the Eqs. (1) and (2). The number of austenite orientations generated in the estimation was normalized to the number of the measured austenite orientations.
In order to evaluate the statistics of plural orientation relationships between an austenite grain and their adjacent ferrite grains, it has to be taken into account that the orientation relationships with different ferrite grains are related each other and one orientation relationship restricts the others. For example, when one of the orientation relationships satisfies the K–S relationship (ΔθKS = 0°), the orientation relationships with the other adjacent ferrite grains are restricted and usually ΔθKS take finite values (ΔθKS > 0°) since the orientation of austenite cannot select the exact K–S relationship with two adjacent ferrite grains simultaneously. To elucidate the effect of the restriction, the orientation relationships with different adjacent ferrite grains are classified as follows. The orientation relationship with the smallest ΔθKS in each of the austenite grains was classified into a Group 1, and the one with the second-smallest ΔθKS was classified into Group 2, the ones with the third- and fourth-smallest ΔθKS were classified into Groups 3 and 4, respectively. Figures 11(a)–11(d) show the frequency of the measured orientation relationships which are represented by the misorientation from the K–S relationship (ΔθKS); the dotted lines shown in Groups 2–4 represents the estimated probabilities assuming that austenite transforms as long as it maintains the one exact K–S relationship.

In Group 1 (Fig. 11(a)), most of the measured orientation relationships have a very small ΔθKS. The frequency lower than 2° in ΔθKS corresponds to 59% of all the orientation relationships. The K–S relationship is maintained quite accurately with one of the adjacent ferrite grains, and it is generally recognized as the orientation relationship of the phase transformation between ferrite and austenite.41)
In Group 2 (Fig. 11(b)), the orientation relationships near the K–S relationship, i.e., ΔθKS = 2°–12°, are frequently observed. Moreover, Fig. 11(b) indicates that the frequency of the orientation relationships in ΔθKS ranging from 2° to 6° is significantly higher than the estimated probability (dotted line). A similar tendency is observed in Group 3 (Fig. 11(c)), where the frequency of the orientation relationship with ΔθKS ranging from 6° to 12° is higher than the estimated probability. For instance, 50% of the orientation relationships have ΔθKS less than 14° when compared with 22% for the estimated probability.
In Group 4, the distribution of ΔθKS is almost comparable to the estimated probability. The orientation relationships are considered to be selected randomly according to the preference to the K–S relationship.
The frequency of the orientation relationships in Group 2 decreases significantly when ΔθKS is lower than 2°. This is because the orientation relationship with ΔθKS less than 2° can be scarcely selected as the orientation relationship in Group 2 when the orientation relationship in Group 1 selects the exact K–S relationship with ΔθKS less than 2°. The orientation of austenite which satisfies the exact K–S relationship with two adjacent ferrite grains simultaneously is not selectable and the orientation relationship in Group 2 is restricted by those in Group 1. A similar restriction is also affecting to the orientation relationships in Group 3. The orientation relationship with low ΔθKS, e.g., lower than 6°, in Group 3 is quite few. This is because there is no selectable orientation to satisfy such low ΔθKS orientation relationships. This is considered to be the reason for the broader distribution in Groups 2 and 3, which result in a high frequency of the near K–S relationship. Although the orientation relationships with the second and the third ferrite grains are restricted by the more preferred orientation relationship with other adjacent ferrite grains, they take the possible minimum in the total orientation relationships of the austenite grain.
From the above discussion, it can be concluded that a considerable number of reverse-transformed austenite is related to two or three adjacent ferrite grains with the K–S relationship and the near K–S relationship. These orientation relationships are preferentially selected between reverse transformed austenite grains and ferrite grains at plural interfaces. It is additionally described to the above result that the frequency of the orientation relationships does not changed even if the analysis included the excluded austenite grains because they are facing to the surface of the sample with large area (over 5% of the whole interface area of the austenite grains).
In the literature, the coherency of the interphase boundary between ferrite and austenite has been studied in connection with the K–S relationship and the N–W relationship.21,22,24,42) It is suggested that the interface with these orientation relationships is of low-energy with maintaining partial coherency between austenite and ferrite. To exhibit a typical example of the interfaces between austenite and ferrite, the three-dimensional morphology of the austenite grain described in Fig. 8 is shown in Fig. 12. The color on the surface indicates the normal orientation at each surface voxel which is calculated using the method explained in Appendix I. The color corresponds to the referential standard stereographic triangle attached in Fig. 6. The morphology of austenite grains is often observed as a kind of tetrahedron, but they are not the regular one rather an elongated or thin tetrahedron in most cases. The interface with the K–S relationship or near relationship to the K–S relationship tends to be flat plane. These interfaces may correspond to specific appropriate orientations of boundary planes to maintain coherency at the atomic level. The reason for selecting the K–S relationship and the near K–S relationship between reverse transformed austenite and adjacent ferrite grains may be for realizing maintain coherency at the interfaces.

It is also indicated that the nucleus of austenite at grain corners or edges would have more than two or three interfaces to adjacent ferrite grains since the orientation relationships are selected at these interfaces when the nucleus is formed, which suggest that the morphology of austenite nucleus is a kind of polyhedron with plural interfaces to ferrite grains. Clemm et al. proposed that the preferable morphology of the nucleus at grain boundary is a rounded tetrahedron.43) The tetrahedral morphology of nucleus may be preferred for lowering the interfacial energy of the nucleus at grain corner by holding coherent interfaces to adjacent mother grains.
The other one or two interfaces of austenite grain are deviated from the K–S relationship largely. As the in situ EBSD measurement has shown, the interfaces deviated from the K–S relationship largely by over 9° tend to migrate rapidly into adjacent ferrite grains when austenite grain grows further. It should be emphasized that reverse transformed austenite grain always accompany the interfaces deviated largely from the K–S relationship when it nucleates at grain corner or grain edge. The degree of the deviation is far larger than the possible minimum. Such nuclei with the restricted orientation and morphology of austenite nucleus may be favored for formation of austenite grains for reducing the free energy of nucleus by forming stable interfaces as well as realizing rapid grain-growth.
5. Conclusions
The crystallographic relationship between austenite and ferrite in the early stage of reverse transformation upon heating has been investigated on the basis of the K–S relationship and deviation from it. The following conclusions are obtained.
(1) The three-dimensional ferrite–austenite microstructure is successfully reconstructed by the serial sectioning EBSD measurement combined with the determination method of a prior austenite orientation from the martensite variants. The prior austenite orientation is identified from orientation information of martensite blocks in the three-dimensional microstructure. It is noted that the EBSD measurement of martensite in each cross section is not perfectly obtained due to the low quality of EBSD patterns of martensite.
(2) The K–S relationship within 4° deviation is satisfied at one of the interfaces among the transformed austenite grain and the adjacent ferrite grains. Moreover, at other one or two interfaces, the orientation relationship near the K–S relationship are frequently satisfied. The interfaces satisfying the K–S relationship and the near K–S relationship are likely to be originated from the preference to realizing coherent interfaces of the austenite. The interfaces with the K–S relationship and the near K–S relationship hardly migrate when the austenite grain grows.
(3) At the other one or two interfaces of austenite grain, the orientation relationships are randomly distributed according to the K–S relationship. It has shown that the interfaces largely deviated from the K–S relationship migrate rapidly when the austenite grain grows.
(4) Plural orientation relationships between an austenite grains and adjacent ferrite grains tend to approach to the K–S relationship. Although the second and the third orientation relationship are deviated from the K–S relationship, their misorientation of about 4 to 12° from the K–S relationship is consistent to the possible minimum in the restriction to the orientation relationships.
Appendix I
The normal orientation of the interfacial boundary in the three-dimensional ferrite–austenite microstructure is obtained through the following two analytical steps.
It should be noted that accuracy of the analysis method for normal direction of interface in the present study are not high. This is because the voxel size is 0.08 × 0.08 × 0.1 μm, and therefore, the EBSD data neighboring to the ferrite–martensite interface is not clearly identified as is shown in Fig. 6. However, the method estimates a number of normal directions at voxels on the interface. The average of them would provide rough information about the statistical mode of the normal directions as well as the curvature of the interface.
The normal vector of the interfacial boundary of a crystal grain is analyzed in a sample coordinate system. When the surface is perfectly flat, the normal vector is given as the cross-product of any two vectors on the surface. In the case of the measured interface boundary, plural cross-products are calculated, and the averaged vector of them is defined as the normal vector of the interfacial boundary. As depicted schematically in Fig. A1, eight vectors X1–X8, which start from the center voxel and extend up to each adjacent voxel are taken into account. The cross-products of two adjacent vectors among X1–X8 are calculated, and the averaged vector is given as follows.
|
n
s
=
1
8
∑
i=1
8
x
i
×
x
i+1
|
x
i
|
2
|
x
i+1
|
2
-
|
x
i
⋅
x
i+1
|
2
| (a1) |
ns represents the normal vector of the interfacial boundary in the sample coordinate system. The vector X9, which appears in the case of i = 8, is equal to X1. Then, the normal orientation nc of the interfacial boundary is given from the ns by converting the sample coordinate system to the crystal coordinate system using the measured Euler angle at the voxel.
|
g=
(
cos
φ
1
cos
φ
2
-sin
φ
1
sin
φ
2
cosΦ
sin
φ
1
cos
φ
2
+cos
φ
1
sin
φ
2
cosΦ
sin
φ
2
sinΦ
-cos
φ
1
sin
φ
2
-sin
φ
1
cos
φ
2
cosΦ
-sin
φ
1
sin
φ
2
+cos
φ
1
cos
φ
2
cosΦ
cos
φ
2
sinΦ
sin
φ
1
sinΦ
-cos
φ
1
sinΦ
cosΦ
)
| (a3) |
ϕ1, Φ, ϕ2 are Euler angles in Bunge notation.
References
- 1) G. Miyamoto, R. Hori, B. Poorganji and T. Furuhara: Metall. Mater. Trans., 44A (2013), 3436.
- 2) S. Tateyama, Y. Shibuta and T. Suzuki: Scr. Mater., 59 (2008), 971.
- 3) N. Yoshinaga, K. Ushioda, A. Itami and O. Akisue: ISIJ Int., 34 (1994), 33.
- 4) N. Yoshinaga, H. Inoue, K. Kawasaki, L. Kestens and B. C. De Cooman: Mater. Trans., 48 (2007), 2036.
- 5) H.-R. Wenk, I. Huensche and L. Kestens: Metall. Mater. Trans., 38A (2007), 261.
- 6) G. Brückner and G. Gottstein: ISIJ Int., 41 (2001), 468.
- 7) K. Ameyama, T. Maki and I. Tamura: J. Jpn. Inst. Met., 50 (1986), 602.
- 8) T. Furuhara and T. Maki: Mater. Sci. Eng. A, A312 (2001), 145.
- 9) T. Tomida, N. Imai, K. Miyata, S. Fukushima, M. Yoshida, M. Wakita, M. Etou, T. Sasaki, Y. Haraguchi and Y. Okada: ISIJ Int., 48 (2008), 1148.
- 10) T. Tomida, M. Wakita, M. Yasuyama, S. Sugaya, Y. Tomota and S. C. Vogel: Acta Mater., 61 (2013), 2828.
- 11) O. Hashimoto, S. Satoh and T. Tanaka: Tetsu-to-Hagané, 66 (1980), 102.
- 12) O. Hashimoto, S. Satoh and T. Tanaka: Tetsu-to-Hagané, 66 (1980), 112.
- 13) N. Nakada, T. Tsuchiyama, S. Takaki and S. Hashizume: ISIJ Int., 47 (2007), 1527.
- 14) N. Nakada, T. Tsuchiyama, S. Takaki and N. Miyano: ISIJ Int., 51 (2011), 299.
- 15) T. Hara, N. Maruyama, Y. Shinohara, H. Asahi, G. Shigesato, M. Sugiyama and T. Koseki: ISIJ Int., 49 (2009), 1792.
- 16) T. Fukino and S. Tsurekawa: Mater. Trans., 49 (2008), 2770.
- 17) I. Lischewski and G. Gottstein: Mater. Sci. Forum, 495–497 (2005), 447.
- 18) I. Lischewski and G. Gottstein: Acta Mater., 59 (2011), 1530.
- 19) K. Hata, M. Wakita, K. Fujiwara, K. Kawano, T. Tomida, M. Sugiyama, T. Fukuda and T. Kakeshita: Mater. Trans., 57 (2016), 1514.
- 20) G. Kurdjumov and G. Sachs: Z. Phys., 64 (1930), 325.
- 21) J. M. Regisbee and H. I. Aaronson: Acta Metall., 27 (1979), 351.
- 22) J. M. Regisbee and H. I. Aaronson: Acta Metall., 27 (1979), 365.
- 23) Z. Nishiyama: Sci. Rep. Tohoku Imp. Univ., 23 (1934), 638.
- 24) H. I. Aaronson, T. Furuhara, J. M. Regisbee, W. T. Reynolds, Jr. and J. M. Howe: Metall. Trans. A, 21A (1990), 2369.
- 25) S. Zaefferer, S. I. Wright and D. Raabe: Metall. Mater. Trans. A, 39A (2008), 374.
- 26) S. Morito, Y. Edamatsu, K. Ichinotani, T. Ohba, T. Hayashi, Y. Adachi, T. Furuhara, G. Miyamoto and N. Takayama: J. Alloy. Compd., 577S (2013), S587.
- 27) H. Yoshida, S. Takagi, S. Sakai, S. Morito and T. Ohba: Tetsu-to-Hagané, 99 (2013), 625.
- 28) M. Humbert, H. Moustahfid, F. Wagner and M. J. Philippe: Scr. Metall. Mater., 30 (1994), 377.
- 29) M. Humbert and N. Gey: J. Appl. Crystallogr., 35 (2002), 401.
- 30) C. Cayron, B. Artaud and L. Briottet: Mater. Charact., 57 (2006), 386.
- 31) T. Morimoto, F. Yoshida, I. Chikushi, H. Kitahara and N. Tsuji: Tetsu-to-Hagané, 93 (2007), 591.
- 32) G. Miyamoto, N. Iwata, N. Takayama and T. Furuhara: Acta Mater., 58 (2010), 6393.
- 33) K. Hata, M. Wakita, K. Fujiwara and K. Kawano: Nippon Steel & Sumitomo Metal Tech. Rep., 114 (2017), 26.
- 34) Z.-D. Li, G. Miyamoto, Z.-G. Yang and T. Furuhara: Scr. Mater., 60 (2009), 485.
- 35) D. Z. Yang, E. L. Brown, D. K. Matlock and G. Krauss: Metall. Trans. A, 16A (1985), 1523.
- 36) D. Z. Yang, E. L. Brown, D. K. Matlock and G. Krauss: Metall. Trans. A, 16A (1985), 1385.
- 37) G. Miyamoto, N. Takayama and T. Furuhara: Scr. Mater., 60 (2009), 1113.
- 38) M. Humbert, P. Blaineau, L. Germain and N. Gey: Scr. Mater., 64 (2011), 114.
- 39) T. Takeuchi, Y. Adachi, D. Dorner and M. Enomoto: Mater. Sci. Forum, 561–565 (2007), 69.
- 40) G. H. Zhang, T. Takeuchi, M. Enomoto and Y. Adachi: Metall. Mater. Trans. A, 42A (2011), 1597.
- 41) A. D. King and T. Bell: Metall. Trans. A, 8A (1975), 1419.
- 42) T. Furuhara, K. Oishi and T. Maki: Metall. Mater. Trans. A, 33A (2002), 2327.
- 43) P. J. Clemm and J. C. Fisher: Acta Metall., 3 (1955), 70.


