Abstract
Subsurface microcracks developed in the Ti–Fe–O cross-rolled material were characterized in order to clarify the subsurface fatigue crack initiation. A considerable amount of microcracks in β platelets were detected. The {0001} transgraular microcracks in α grains predominantly generated at the β grain boundary between recovered α grain and recrystallized α grain, and grew into the recrystallized α grain along the basal plane, although the microcracks at the twist boundary of α grains and at the α-β interface were occasionally detected. Stress concentration around the microcrack in β platelets may assist the microcrack initiation on basal plane (transgranular facet) in neighboring α grain due to a combination of the shear stress and tensile stress normal to the basal plane at α-β boundary. The {0001} transgraular microcracks growth and/or coalescence occurred with the assistance of shear stress on prismatic plane such as {1010} steps.
1. Introduction
In titanium alloys, subsurface crack initiation not associated with per-existing defects has been reported in high-cycle regime and at lower temperature under both cyclic and dwell fatigue loading.1,2) The subsurface fatigue crack initiation sites in near-α and α-β type titanium alloys commonly appear crystallographic transgranular facet or facets.1,2,3,4,5,6,7,8) Mostly the facets formed on or near the {0001} basal plane regardless their inclination to the principal stress axis. Dislocation movement in α phase is restricted on the primary slip plane and fairly planar so that dislocation arrays on {0110}<1120> are piled-up in the vicinity of grain boundaries and a local stress concentration generates near α grain boundary.9,10) The stress distribution between “soft” (plastically deformed) and “hard” (elastically deformed) α grains duo to strain incompatibility at their boundary may develop microcrack in the hard grain under fatigue loading.10,11) Slip deformation analysis based on full constraints model by Taylor theory was suggested that internal stress in a grain was developed on the normal to {0001} and hardly relaxed.12) The accumulated tensile stress along <0001> may be responsible for initial microcracking and its opening in the hard grain.
A model based on the Stroh mechanism13) was proposed to understand the{0001} facet formation under dwell fatigue loading; that was the combination of critical shear stress and tensile stress on the {0001}, and the transgranular facet was normal to the loading axis.14) The deformation and damage modes activated at the specimen surface of polycrystalline titanium alloys revealed that the facet formed by a combination of a relatively high resolved shear stress on the {0001} (moderate Schmid factor) and a high tensile stress perpendicular to the {0001}.15) According to the full constraints model analysis, the relaxation under the simple shear mode was easier than that under the tension mode.16) The localized basal slip on {0001} under the simple shear mode may assist the growth of microcrack. Although these models maintain the microcracking and microcrack growth to form a facet,10,17) phenomenological details in microcrack generation, especially trigger and beginning of microcracking have not been clear yet.
A near-α type Ti–Fe–O alloy clearly exhibited the subsurface fatigue crack generation, where the strain incompatibility between recovered (soft) α grain and recrystallized (hard) α grain under cyclic deformation may induce the {0001} microcrack and its growth in the recrystallized α grain.10) However, no attention has paid on the role of β phase for the crack initiation, even though β phase is softer than α phase. Since dislocations density in β phase is higher than that in α phase,2) β phase may be responsible for the cyclic deformation and microcrack generation in near-α type and α-β type titanium alloys. Furthermore, the cross-rolled Ti–Fe–O material (CR) provided microstructure with rather clearly divided into recovered α grain and recrystallized α grain regions, and planar dislocations were aligned in the recovered α grains.18) After cyclic deformation, the dislocation structure was rearranged, and sub-boundary structures were developed in the recovered α grain region, and less dislocations were dispersed in the recrystallized α grains.
In the present study, microcracks developed in the Ti–Fe–O CR material under cyclic deformation was characterized to discuss the subsurface crack generation, especially focused on β phase for its role on the trigger and beginning of microcrack initiation.
2. Experimental
2.1. Test Material and Fatigue Test
The test material was a cross-rolled plate of a near α-type Ti–Fe–O alloy; the main chemical compositions were as follows: 0.0005 H, 0.386 O, 0.003 N, 0.994 Fe, 0.003 C, and balance of Ti in mass%. The Ti–Fe–O alloy was double melted in vacuum arc remelting, forged (1273 K heating), and hot rolled (1123 K heating) to a 43-mm-thick plate. Then the plate was cross-rolled (1123 K heating) in the transverse direction (TD) to a 27-mm-thick plate, and annealed at 1023 K for 3.6 Ks, followed by air cooled.
Tensile tests were done at a strain rate of 4×10⁻⁴ s−1 using a screw-driven-type tester. Cylindrical test pieces were cut parallel to the first rolling direction (RD); the gage geometry was 3.5 mm in diameter and 25 mm in length. Tensile properties were submitted by duplicate tests as follows; 0.2% proof stress (σ0.2): 634 MPa, ultimate tensile strength (σB): 765 MPa and elongation (El): 31.7% at 293 K (in ambient air), and σ0.2: 1206 MPa, σB: 1308 MPa and El: 20.7% at 77 K (immersed in liquid nitrogen).
The configuration of fatigue test specimens is shown in Fig. 1. The specimens were machined parallel to the RD. Fatigue testing was carried out at 293 K and 77 K. Using a servohydraulic fatigue machine, load-controlling tests were done. The sinusoidal waveform loading was uniaxial with a minimum-to-maximum stress ratio, R (σmin/σmax), of 0.01. Test frequencies of 20 Hz at 293 K and 15 Hz at 77 K were chosen so that the specimen temperature rise should be as low as possible. Figure 2 shows S–N data of the test material.19) The samples failed at 77 K and in higher cycles at 293 K exhibited subsurface crack initiation (solid plots in Fig. 2). Their maximum cyclic stress was much lower than macro-yield stress.
2.2. Analyses
At low magnification the subsurface crack initiation sites appear flat and are inclined to the principal stress axis, and fatigue crack growth gives an appearance in a radial pattern from the initiation site.2,17,20) According to the previous studies, the subsurface crack initiation site is defined as the whole of the inclined area (stage I crack) which is not placed on the fatigue crack propagating plane (stage II). The initiation site is approximated to an elliptical crack with orthographic projection on the main crack propagating plane, so that the minor axis is almost parallel to the initial crack growth direction as shown in Fig. 3(a). Then the fractured samples19) were cut off near the subsurface crack initiation sites parallel to the initial crack growth direction, and the microstructure around microcracks beneath the crack propagation planes was analyzed in the longitudinal cross section (near TD plane) as shown in Fig. 3(b). The microcracks detected in the cross section may represent the initial stage of subsurface fatigue crack generation to discuss its mechanism as in the previous study.10) The mechanically and electrochemically polished surfaces were examined by scanning electron image (SEI) and electron backscatter diffraction (EBSD) pattern analysis in scanning electron microscopy (SEM). Inverse pole figure (IPF) orientation maps were indicated the orientation normal to analyses plane.

3. Results and Discussion
3.1. Microstructure
The alloy consisted of pancaked α grains and fine β platelets of which were aligned with each other in the microstructure. Each α grain elongates parallel to the RD as well as the TD. In the EBSD image quality (IQ) map, the microstructure is classified into two regions, which are designated as recrystallized α grain region and recovered α grain region as shown in Fig. 4. Since the IQ reflects the perfection of a crystal, strain and defects such as dislocations cause poor quality (i.e. dark in the image quality maps). A recrystallized α grain region thus shows higher quality than a recovered α grain one. In fact, the recovered α grain region is darker gray than the recrystallized α one in Fig. 4. The α grain width in the recovered α grain region is about several microns, compared to about 20 μm in the recrystallized α one. The crystallographic texture of the α phase, measured by EBSD on the RD plane shown in Fig. 4(a), is drawn by (0001), (1010) and (1120) pole figures in Fig. 5. There are virtually no grains oriented with their c axis parallel to the principal stress axis (RD). The recovered α grain region showed a strong texture with (0001)<1120> rotated counterclockwise about 25 degrees around RD where the highest pole density was about 50 (Fig. 5(b)), while the (0001) of recrystallized α grains were (0001)//ND plane (Fig. 5(c)).

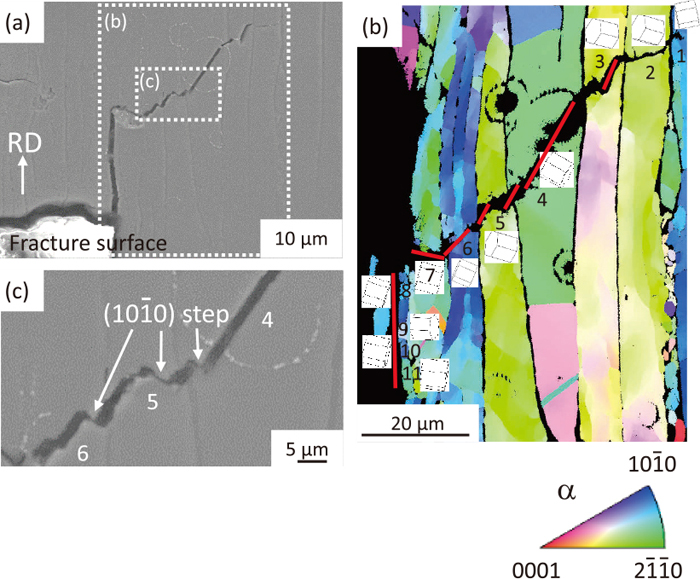
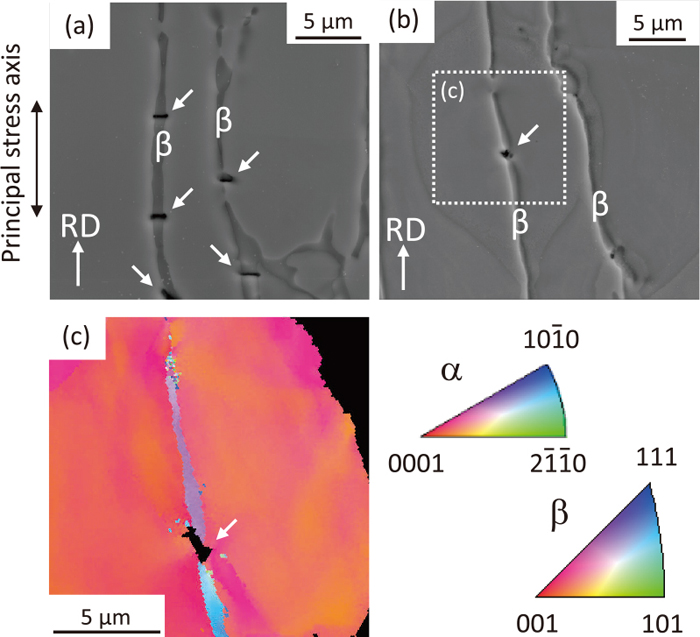
A considerable amount of microcracks were detected near the fracture surface in the cross section of fractured samples at any stress level in both test temperatures. The microcracks lied in β platelets, α grains and α-β interfaces. Most of microcracks or voids were with about 1 μm in length (fitted to thickness of β platelets) and detected at β platelets without propagating into neighboring α grains in the recovery α grain region as shown in Fig. 6(a). According to the orientation analysis shown in Fig. 6(c), the β microcrack initiated at the β grain boundary.
Some microcracks were detected in α grains and were associated with the microcrack in β platelets. The microcracks may be firstly formed in β platelet and then propagate into neighboring α grains as shown in Figs. 7(a) and 7(b). In Fig. 7(a), a microcrack grew across an α grain, and was inclined 20 degrees to the principal stress axis. The crystallographic analysis determined that the trace of microcracks were almost parallel to a basal plane as shown in Fig. 7(c). Since red color lines indicated by arrows represented sub-boundaries in grain 1 (Fig. 7(c)), the grain 1 was in the recovered α grain region. On the other hand, the grain 2 was identified as a recrystallized α grain, because no sub-boundary structure was detected in grain 2 (Fig. 7(c)). Thus the microcrack was formed in β platelet at the boundary between recovered α grain and recrystallized α grain.

Figure 7(b) represents the β microcrack propagated into neighboring recrystallized α grains in both sides, where its growth was arrested in the α grains near the boundaries. The traces of the α microcracks were on {0001} as shown in Fig. 7(d) where the basal planes were twisted each other. Furthermore, {1012} deformation twin which may relaxed the stress along <0001> was detected at the microcrack tip. Then the microcracks may be fitted to the microcracking part in α grains (region A in the reference 10)) which appeared on the crack initiation site of {0001} facet.
A number of microcracks or voids generated at β platelets and the origin of {0001} transgraular microcrackings in α grain was usually associated with the β microcracks. Because the recovered α grains and β platelets behave as ‘softer’ region than the recrystallized α grains under cyclic deformation at very low stress level,18) the strain incompatibility may generate between recrystallized α grain and β grain. The rearrangement of dislocations in the neighbor recovered α grain may enhance the strain incompatibility. Then the strain incompatibility at the triple point of recrystallized α-β-β may produce local deformation to result in the microcrack or void at β grain boundary, and redistribute the concentrated stresses.10,11,13,21) Furthermore, stress concentration around the microcrack or void in β platelets may assist the microcrack initiation on basal plane (transgranular facet) in neighboring α grain due to a multiaxial stress state. Namely a combination of the shear stress and tensile stress normal to the slip plane (i.e. basal plane) at α-β boundary may give a trigger of the {0001} microcracking. The localized slip following slip off on the basal plane must be activated in the recrystallized α grain for the microcrack growth, where the shear stress to the basal plane should act at the microcrack tip.16) Bridier et al.15) suggested that the origin of fatal crack on basal plane required a combination of a high Schmid factor in addition to high elastic stiffness, including a high tensile stress normal to the basal plane, although the detected α grains with microcracks showed the basal Schmid factor in the range of 0.15–0.45.
Therefore, thin β platelets which were aligned between the recrystallized α grain and the recovered α grain were responsible for the microcrack generation to form {0001} tansgranular facet in the recrystallized α grains as follows:
• At first microcrack or void was generated in β platelet between the recovered α grain and the recrystallized α grain.
• The microcrack caused a stress concentration at α-β boundary. A combination of the shear stress and tensile stress normal to the basal plane may give a trigger of the {0001} microcracking in the recrystallized α grain.
• The localized shear stress following slip off on the basal plane was activated at the microcrack tip in the recrystallized α grain, and the microcrack grew into the recrystallized α grain to form {0001} transgranular facet.
3.3. Microcracks at (0001) Twist Boundaries
A few microcracks which were not associate with β grains were detected at the (0001) twist boundaries of α grains as shown in Fig. 8(a). The microcracks were inclined about 10 to 20 degrees to the principal stress axis, where both the tensile stress and the shear stress on the crack plane were relatively low. Figure 8 shows the microcrack formed at (0001) twist boundary with the misorientation of about 14 degrees (line A) in the recovered α grain region but not at the sub-boundary with lower misorientation (line B). The minimum angle of misorientations was 12 degrees among the detected microcracks. The cracked planes on each α grain were with lower basal Schmid factor in the range of 0.23–0.33 and higher prismatic Schmid factor in the range of 0.43–0.47. Thus, the shear stress on {1010} in each α grain is high, and the maximum shear on {1010} are deviated each other. As a simple explanation, the higher shear stress disconformity on the (0001) twist boundary may assist the microcrack initiation and growth along the boundary under a mixture of mode II and mode III stresses. All of microcracks detected α grain boundaries were only at the twist boundary and did not grow into neighbor α grains and/or sub-grains.

Figure 9 represents the microcracks at the α-β interfaces which were from several microns to several ten microns in length. The microcracks can grow along with the interface, but can hardly propagate into α grains. The microcrack may generate at the interface between recovered α grain and β platelet and lied on the basal plane of α grain.
Strain incompatibility at the α-β interface introduces the additional local stresses for decohesion at the interface, which is parallel to a {1010} plane in the α phase.22) Since the α-β interfaces are almost aligned to the loading direction in the CR material, both the tensile and shear stresses along the interface are very low. Then the interfacial stress due to strain incompatibility may not be sufficient to cause the microcracking, and the shear stress on prismatic plane in α grains may play an important role for the microcracking along the interface due to stress inconformity there.
3.5. Microcracks Coalescence
Microcracks were coalesced to be a long or fatal crack as shown in Fig. 10. The microcrack along the α-β interface indicated by the arrow in Fig. 10(a) was connected to the microcracks in α grains. Figure 10(b) shows transgranular microcracks lying on the basal planes in α grains of 3, 4, 5 and 6, and their coalescence where the {1010} steps appear to connect the transgranular microcracks in an individual grain shown in Fig. 10(c). The microcracks at the α-β interface of α grains 8, 9, 10 and 11 were on or near their basal planes. Although different types of microcracks were detected, transgranular microcracks lying on or near {0001} were predominant and the microcrack growth and/or coalescence occurred with the assistance of shear stress on prismatic plane.
4. Conclusions
Subsurface microcracks developed in the Ti–Fe–O cross-rolled material under high-cycle fatigue were characterized. Phenomenological details in microcrack generation, especially trigger and beginning of microcrack, were clarified.
(1) Many microcracks in β platelets were detected. The {0001} transgraular microcracks in α grain were associated with those in neighboring β platelets. The microcracks predominantly generated at the β grain boundary between recovered α grain and recrystallized α grain, and then grew into the recrystallized α grain along the basal plane.
(2) Stress concentration around the microcracks or voids in β platelets may assist the microcrack initiation on basal plane (transgranular facet) in neighboring α grain due to a multiaxial stress state. Namely a combination of the shear stress and tensile stress normal to the basal plane at α-β boundary may give a trigger of the {0001} microcracking, and the shear stress following {0001} slip off must be activated in the recrystallized α grain for the microcrack growth.
(3) The microcracks at the (0001) twist boundary of α grains and at the α-β interface were also detected where the shear stress on either basal or prismatic plane may assist. The {0001} transgraular microcracks growth and/or coalescence occurred with the assistance of shear stress on prismatic plane such as {1010} steps.
Acknowledgement
This work was supported by KAKENHI 16K06769.
References
- 1) W. Li and O. Umezawa: Key Eng. Mater., 741 (2017), 76.
- 2) O. Umezawa and K. Nagai: ISIJ Int., 37 (1997), 1170.
- 3) A. L. Pilchak, R. E. A. Williams and J. C. Williams: Metall. Mater. Trans. A, 41A (2010), 106.
- 4) J. A. Ruppen, D. Eylon and A. J. Mcevily: Metall. Trans. A, 11A (1980), 1072.
- 5) I. Bantounas, D. Dye and T. C. Lindley: Acta Mater., 57 (2009), 3584.
- 6) M. R. Bache, M. Cope, H. M. Davies, W. J. Evans and G. Harrison: Int. J. Fatigue, 19 (Suppl. 1) (1997), S83.
- 7) C. J. Szczepanski, S. K. Jha, J. M. Larsen and J. W. Jones: Metall. Mater. Trans. A, 39A (2008), 2841.
- 8) V. Sinha, M. J. Mills and J. C. Willimas: Metall. Mater. Trans. A, 37A (2006), 2015.
- 9) O. Umezawa, K. Nagai and K. Ishikawa: Mater. Sci. Eng. A, A129 (1990), 223.
- 10) H. Yokoyama, O. Umezawa, K. Nagai, T. Suzuki and K. Kokubo: Metall. Mater. Trans. A, 31A (2000), 2793.
- 11) M. R. Bache: Int. J. Fatigue, 25 (2003), 1079.
- 12) M. Morita and O. Umezawa: Mater. Trans., 52 (2011), 1595.
- 13) A. N. Stroh: Proc. R. Soc. Lond. A, A223 (1954), 404.
- 14) M. R. Bache, W. J. Evans and H. M. Davies: J. Mater. Sci., 32 (1997), 3435.
- 15) F. Brider, P. Villechaise and J. Mendez: Acta Mater., 56 (2008), 3951.
- 16) M. Morita and O. Umezawa: Proc. 12th World Conf. on Titanium, Vol. 2, ed. by L. Zhou, et al., Science Press, Beijing, (2012), 1100.
- 17) O. Umezawa, K. Nagai and K. Ishikawa: Tetsu-to-Hagané, 76 (1990), 924.
- 18) W. Li and O. Umezawa: Proc. 13th World Conf. on Titanium, ed. by V. Venkatesh, et al., TMS, Warrendale, PA, (2016), 843.
- 19) T. Yuasa, O. Umezawa and Y. Ono: CAMP-ISIJ, 24 (2011), 1058, CD-ROM.
- 20) M. Hamada and O. Umezawa: ISIJ Int., 49 (2009), 124.
- 21) M. R. Bache, W. J. Evans and H. M. Davies: J. Mater. Sci., 32 (1997), 3435.
- 22) C. C. Wojcik, K. S. Chan and D. A. Koss: Acta Metall., 36 (1988), 1261.