Abstract
In the steel industry, slabs are manufactured with different amounts of alloying elements according to production purposes or final products. Because slabs have similar shapes, product identification is required to prevent inadequate production processes. In many steel mills, paint marking systems are widely used to inscribe slab identification numbers (SINs). As smart factory technology receives more attention in recent years, automatic recognition of SINs becomes more important for factory automation. The recognition of SINs is a challenging problem due to complex background of factory scenes and low quality of characters in SINs. To address this difficulties, this paper proposes a deep learning algorithm for recognizing SINs in factory scenes. Most existing recognition algorithms conduct text detection and classification using separate modules, and errors in each step are accumulated. The proposed algorithm employs a fully convolutional network (FCN) with deconvolution layers to integrate the recognition processes and improve the performance in processing time and accuracy. The main contribution of this work is on a novel type of ground-truth data (GTD) for the training of a FCN to recognize SINs in factory scenes. The relation between an input image and the corresponding GTD is directly trained in the manner of image-to-image training, and the FCN generates a prediction map that contains categorical information of individual pixels in an input image. Experiments were thoroughly conducted on industrial data collected from a steelworks to demonstrate the effectiveness of the proposed algorithm.
1. Introduction
Steel manufacturing is a fundamental industry in the world, and slab is one of the major steel products. In manufacturing process, individual slabs have similar shapes with different amounts of alloying elements according to production purpose or final product. Therefore, identification of individual slabs is required to prevent an incorrect production process. A widely used method in the steel industry is to inscribe a slab identification number (SIN) by using a paint marking machine, and automatic recognition of SINs is a key technology for factory automation. The objective of this paper is to develop a computer vision algorithm for recognizing SINs in factory scenes.
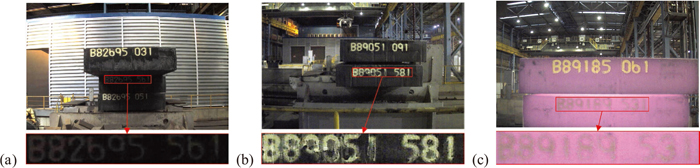
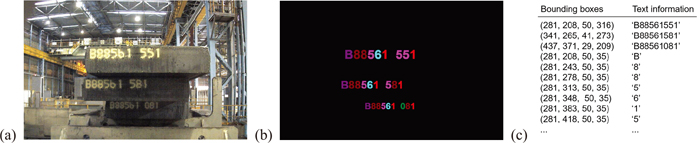
Our automatic recognition system for SINs contains an image acquisition device that was installed at a slab yard in an actual steelworks. A factory scene collected at the slab yard contains unknown number of slabs with different sizes of SINs, and a SIN consists of 9 characters that are horizontally placed with similar distances. The first character is an alphabet that represents a production line, and subsequent characters are numerals that characterize a slab. The recognition of SINs is a challenging problem due to complex background of factory scenes and change of lighting condition during day and night operation. Furthermore, extremely high temperature of slabs is another factor that causes difficulties for recognition. Characters in SINs are deformed or blurred due to the high temperature of slabs, and the quality of characters becomes worse during manufacturing processes. Example factory scenes with enlarged regions of SINs are presented in Fig. 1, and it shows difficulties for recognizing SINs.
The recognition of SINs can be viewed as a text recognition problem. Two typical methodologies for text recognition are stepwise and integrated approaches.1) In stepwise approach, algorithms for text localization, character segmentation, and recognition are separately developed, and these algorithms are sequentially processed in a recognition pipeline. Algorithms based on a sliding window method,2) maximally stable extremal regions,3) and projection profile analysis4) were proposed for text detection or text line segmentation. For text recognition, machine learning techniques with carefully engineered feature representations were used.5,6) On the other hand, integrated approach employs a unified framework for detection and recognition by sharing text information in overall process. After the success of a convolutional neural network (CNN) for image classification7) and object recognition,8) CNNs were used to simultaneously detect and recognize characters in unstructured scenes.9,10,11)
Thesedays, various computer vision algorithms are widely used to assist steel manufacturing processes.12,13,14,15) To extract slab information, rule-based algorithms were proposed to acquire the information of slabs at a reheating furnace16) and slab yard.17) Horizontal projection profile analysis and edge detection algorithm were used as a pre-processing, and carefully engineered score functions were employed to filter out false candidates. However, these previous algorithms should be modified for different target products or change of system environments, and manual tuning is required for many heuristic parameters. Recently, data-driven algorithms were proposed to address the limitations of rule-based methods for the localization18) and recognition19) of SINs. A sliding window method was used to extract patch images, and the patch images were classified to acquire slab information by using a conventional CNN classifier. However, the conventional CNN architecture for classification requires a pre-processing such as a sliding window method to extract character candidates, and it is computationally inefficient.
To address the limitations of the previous algorithms, this paper proposes a novel recognition pipeline for SINs in factory scenes. The proposed algorithm was inspired by a semantic segmentation algorithm that employs a FCN with deconvolution layers.20) FCN is an architecture of a CNN without the use of fully-connected layers to generate a multi-dimensional output prediction map. After the success of FCNs in object detection21) and edge detection,22) it was applied to the scene text localization.23,24,25) In this paper, a novel shape of GTD is proposed to expand the use of a FCN to the recognition problem for a confined scope of texts that contains a known number of equally-spaced characters.
The main contribution of our work is twofold: (1) a simple and powerful recognition pipeline that uses a FCN with deconvolution layers and (2) novel shape of GTD for simultaneous localization and recognition of text information. Although several researches have been conducted to use FCNs for localizing text information, it is the first trial that applies a FCN for the recognition. Because SINs satisfy the sufficient conditions for applying the proposed algorithm, SINs of various numbers and sizes in factory scenes were successfully recognized. Experiments were thoroughly conducted on industrial data collected from an actual steelworks to verify the effectiveness of the proposed algorithm. The remaining sections are organized as follows. Section 2 explains the proposed recognition algorithm, and Section 3 presents experimental results. Section 4 contains a conclusion.
2. Proposed Algorithm
2.1. Ground-truth Data
For scene text recognition, a meaningful segment for a character is regarded as a collection of connected pixels that have consistent color information.26) However, blurred characters have low contrast to background and unclear boundaries. Furthermore, generating GTD with the exact shapes of individual characters as shown in Fig. 2(a) is an expensive and exhausting task. On the other hand, a bounding-box that contains a character or word has been considered as a meaningful region for solving the problem of scene text recognition.27) In this approach, the information of a text is recorded as a 4-tuple of (y-position, x-position, height, width) with corresponding character or word information as presented in Fig. 2(b). Based on these conventions, we propose a novel shape of GTD to train a FCN for the simultaneous localization and recognition of text information.
The shape of the proposed GTD is an image that has identical height and width to the corresponding scene. A GTD for a sample image Xn={
x
ij
(
n
)
: i=1, ···, H, j=1, ···, W} in the training set T={(Xn, Yn): n=1, ···, N} is denoted by Yn={
y
ij
(
n
)
: i=1, ···, H, j=1, ···, W}, where H and W are the height and width of Xn , N is the number of training samples,
y
ij
(
n
)
∈{0, ···, K} indicates the category of
x
ij
(
n
)
, and K is the number of character classes. If Xn is a 24-bit color image,
x
ij
(
n
)
is a three dimensional vector such that
x
ij
(
n
)
∈{(r,g,b): r,g,b=0, ···, 255}, and if Xn is a 8-bit gray image,
x
ij
(
n
)
∈{0, ···, 255}. A value of k∈{1, ···, K} is assigned to
y
ij
(
n
)
if
x
ij
(
n
)
is a pixel located in a bounding-box of a character ck∈C={ck: k=1, ···, K}, where ck is the k-th class of characters and C is the set of character classes. If
x
ij
(
n
)
does not belong to any bounding-box, then such
x
ij
(
n
)
is regarded as background, and the value of 0 is assigned to
y
ij
(
n
)
. Since each image sample is processed independently, the superscripted n is omitted in the subsequent description for notational simplicity.
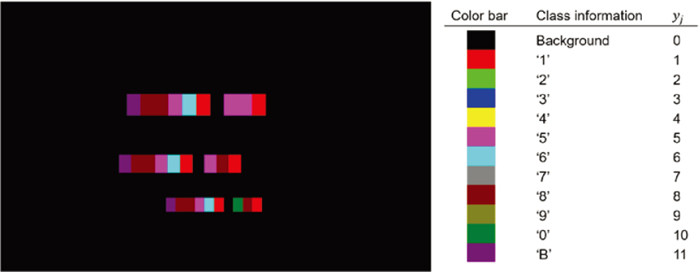
In our industry application, the first character of SINs is an alphabet, and it represents a production line. Because the dataset was collected at a production line which was represented by ‘B’, K was set to 11 for considering a kind of alphabet and 10 classes of numerals. Figure 3 presents the proposed GTD for the factory scene in Fig. 2(a). The color bar in Fig. 3 shows the categorical information of characters for each color.
2.2. GTD Generation Procedure
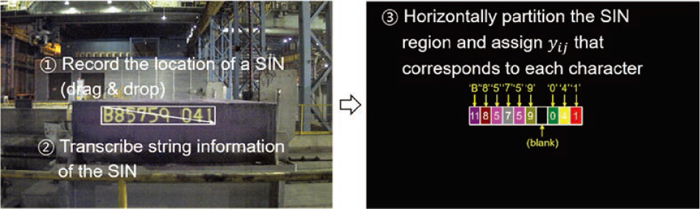
This section presents a procedure for generating the image-shaped GTD. A SIN is composed of 9 characters that are horizontally placed with similar distances, and there is a blank between 6-th and 7-th characters. To efficiently generate GTD, the location of each SIN region was recorded as a 4-tuple of (y-position, x-position, height, width) by conducting a drag and drop operation, and corresponding string information was manually recorded. The SIN region on the GTD image was horizontally partitioned into 10 sub-regions, and 1-st to 6-th and 8-th to 10-th sub-regions were filled with recorded character information as described in Section 2.1. Figure 4 describes the procedure for generating GTD.
2.3. FCN for Text Recognition
For the recognition of SINs, several deep neural networks were developed and analyzed to find an appropriate model. These deep neural networks were constructed in fully convolutional manner to conduct pixel-level classification. In the FCN architectures, stacks of 4 convolutional layers with the small kernel size of 3×3 were used to obtain effective receptive field of 9×9 with reduced number of weight parameters. Deconvolution layers were utilized to upsample the outputs of pooling layers, and responses of deconvolution layers and prior feature maps were combined to jointly use the information of small and large receptive fields.
Figure 5 presents the architecture of the main FCN model. For an input image, the output of the final deconvolution layer (F) has the spatially same size as the input image and the depth of the number of classes. In the training process, cross-entropy loss between the softmax version of F and one-hot encoded version of Y is computed, and the loss is optimized by using Adam optimization.28) The pre-trained parameters of VGG1929) was used to initialize the parameters of convolution layers. The output prediction map of the FCN is denoted by O={oij: i=1, ···, H, j=1, ···, W}, where oij∈{0, ···, K} is the predicted category of xij, and O is obtained by conducting argmax operation for F in depth direction.
2.4. Recognition of SINs
For an output prediction map O, projection profile analysis was applied to transcribe SINs in a factory scene. If oij=0, it implies that xij belongs to a background region. On the other hand, if oij=k∈{1, ···, K}, xij belongs to the character class of ck. The first step for the recognition of SINs is finding vertical positions from a prediction map O. The number of positive elements in the i-th row of O is denoted by PH,i, and it is computed by
P
H,i
=∑
j=1
W
1
o
ij
>0
(
o
ij
)
, where 1A(x) is an indicator function of x such that 1A(x)=1 for x∈A. Vertical positions of SIN candidates can be obtained by analyzing IV ={i: PH,i>η}, where η is a heuristic threshold value. Let
I
V
(
l
)
be the l-th partition with connected elements of IV, then
I
V
(
l
)
represents the set of vertical indexes for the l-th SIN candidate. The sub-region that corresponds to the vertical indexes in
I
V
(
l
)
is extracted from the output prediction map O.
The second step for the recognition is finding horizontal positions of characters in a sub-region of O. Let
O
sub
(
l
)
be the l-th sub-region of O such that
O
sub
(
l
)
={oij: i∈
I
V
(
l
)
, j=1, ···, W}. The number of positive elements in the j-th column of
O
sub
(
l
)
is denoted by
P
V,j
(
l
)
, where
P
V,j
(
l
)
=
∑
i∈
I
V
(
l
)
1
o
ij
>0
(
o
ij
)
. From
P
V,j
(
l
)
, start and end point of the l-th SIN candidate in the horizontal direction is obtained by p1=min
I
H
(
l
)
and p2=max
I
H
(
l
)
, where
I
H
(
l
)
={j:
P
V,j
(
l
)
>0}. The width of a character can be estimated by w=(p2−p1)/10 by using the assumption that a SIN contains 9 equally-spaced characters and a blank between 6-th and 7-th characters.
The string information of the l-th SIN can be obtained by transcribing the elements in S(l) such that S(l)=
{
s
m
(
l
)
: 1≤m≤10, m≠7, m∈ℤ
}
,
s
m
(
l
)
=argmax
i∈
I
V
(
l
)
, j∈
I
H,m
(
l
)
o
ij
, and
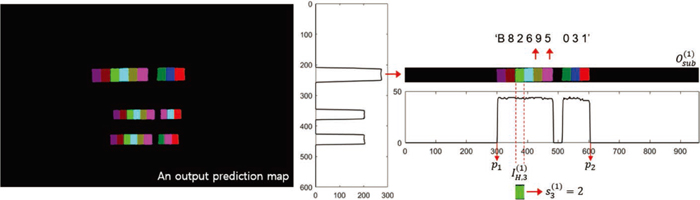
I
H,m
(
l
)
={p1+(m–1)·w, ···, p1+m·w}. Figure 6 depicts the post-processing for transcribing SINs from an output prediction map of the FCN.
3. Experimental Results
3.1. Datasets
Factory scenes were recorded at a slab yard in an actual steelworks during 55 working days, and 4,501 scenes were collected as 24-bit color images with the size of 600 (height)×960 (width). For the training and evaluation of the proposed algorithm, collected data were divided into training, validation, and test sets. The training data consisted of 1,850 scenes that were collected during 30 working days. Each factory scene contained one, two, or three slabs, and the training set contained 3,749 slabs. The validation set was collected during 6 days, and it contained 543 scenes with 1,102 slabs. The test set was collected during 19 days, and it contained 2,108 scenes with 4,275 slabs.
3.2. Experimental Environment and Evaluation Measures
Hardware environment for experiments included Intel core i7–6850 K CPU (3.6 GHz), 32 GB DDR3 RAM, and an NVIDIA TITAN X. Python and Tensorflow were used to implement the proposed algorithm. A SIN is a string of characters that characterize a slab, and correct recognition of entire characters in a SIN is required to identify a slab. Therefore, the recognition accuracy was measured based on the number of correctly recognized SINs. A correct recognition of a SIN means entire characters in the SIN were correctly recognized. Following three statistical measures were utilized to evaluate the proposed algorithm: sensitivity, precision, and f1-score. Sensitivity is the ratio of the number of correct predictions to the total number of SINs in a dataset. Precision is the ratio of the number of correct predictions to the total number of predictions. F1-score is the harmonic mean of sensitivity and precision.
3.3. Training and Validation
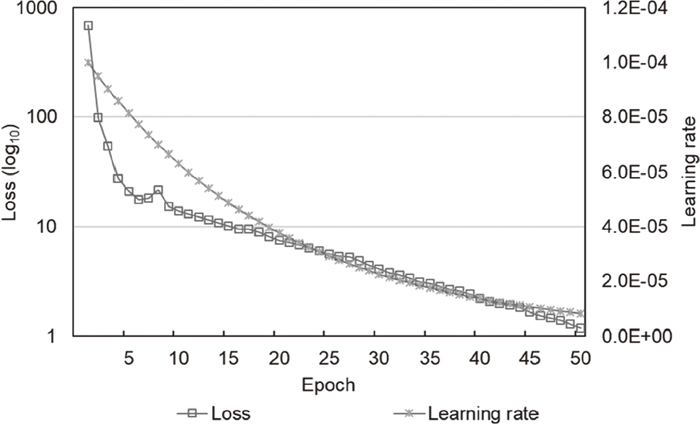
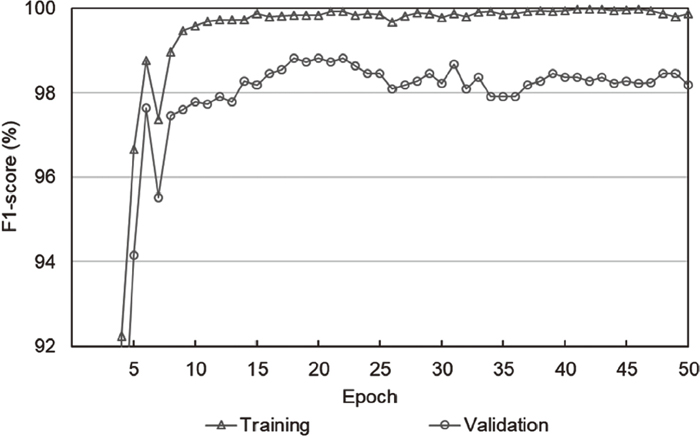
The FCN was trained for 50 epochs using the training data, and 8.71 h was taken for the training process. Adam optimization was used with the initial learning rate of 10–4, and the learning rate was decreased by 5% for each epoch. Figure 7 presents learning rate and training loss during 50 epochs. During the training process, recognition accuracy for the validation set was evaluated to find an optimal training epoch. The heuristic parameter (η) in the post-processing for an output prediction map was set to 20, and this parameter is analyzed in Section 3.7. Figure 8 presents f1-scores for the training and validation sets during the training of 50 epochs. The f1-score for the validation set was maximized at the training of 18 epochs, and further training did not significantly improve the validation accuracy. At the training of 18 epoch, f1-score for the training set was 99.8242%, and f1-score for the validation set was 98.8203%.
3.4. Performance Comparison with Previous Algorithms
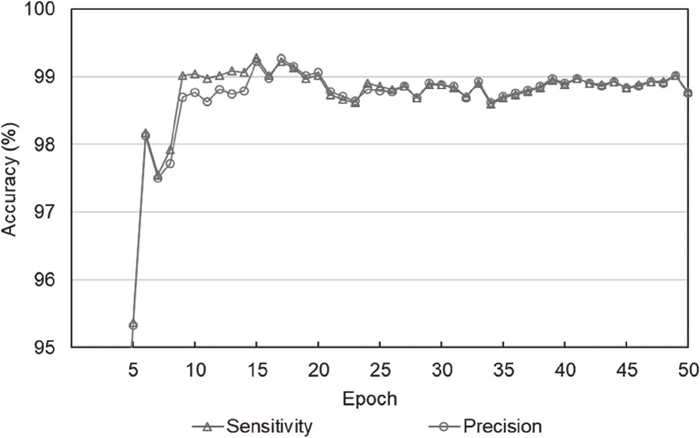
The main FCN model with the training of the optimal epoch was used to evaluate the proposed algorithm. For the test set, the main FCN model recorded the sensitivity of 99.1345% and precision of 99.1577% for the end-to-end recognition of SINs. Figure 9 presents the test accuracy for each epoch. The highest sensitivity and precision were achieved by 99.2749% and 99.2745% at the training of 15 epochs which was close to the optimal epoch obtained by investigating the validation accuracy. With the training of excessively many epochs, the recognition accuracy for the test set was slightly decreased. The averaged processing time for recognizing SINs in a factory scene was 0.0825 s. For a test image, 0.0801 s was taken in the inference procedure for the FCN, and 0.0082 s was taken for transcribing SINs from an output prediction map.
Although the end-to-end recognition includes localization task, the proposed algorithm achieved better results for the end-to-end recognition of SINs compared to the previous localization algorithms.16,18) Furthermore, compared to the recent algorithm,19) about 47% of error in the sensitivity was decreased from 1.64% to 0.8655% for the end-to-end recognition of SINs. Table 1 compares the performance of the proposed algorithm with the previous work for the identical data sets.
Table 1. Performance comparison with previous methods.
| Reference | Choi et al.17) | Lee & Kim18) | Lee et al.19) | Proposed method |
|---|
| Method | Rule-based method | CNN | CNN | FCN |
| Task | Localization | Localization | Recognition | Recognition |
| Sensitivity (%) | 95.41 | 98.56 | 98.36 | 99.1345 |
| Precision (%) | – | 98.70 | 99.13 | 99.1577 |
| Processing time (s) | – | 1.19 | 13.91 | 0.0825 |
Major limitations of the previous algorithm19) are related to a fixed size of receptive field. Because a CNN was trained for classifying patch images of a fixed size, multi-scale analysis was required for recognizing SINs of various sizes. Furthermore, redundant computations for overlapped regions of adjacent sliding windows caused high computational complexity. To address these limitations, the proposed algorithm uses information from various receptive fields by combining mid-level feature maps. The use of a deep architecture with deconvolution layers is another reason for the improvement of recognition accuracy. Furthermore, by using a FCN architecture, the processing speed was remarkably improved by more than 150 times compared to the previous algorithm19) for the identical task.
3.5. Performance Comparison with Other FCN Models
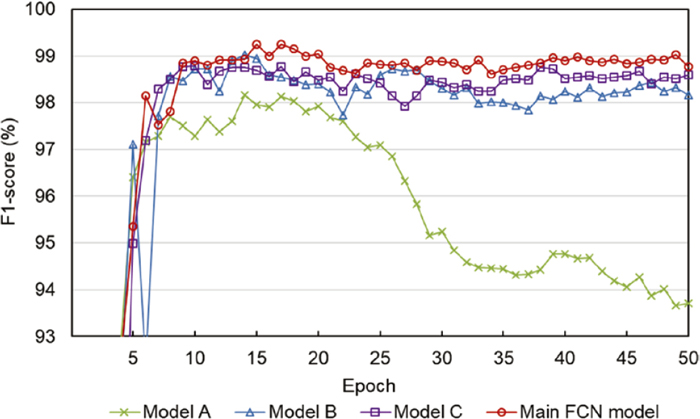
Three other FCN models were designed and analyzed to develop the main FCN model presented in Section 2.3. These auxiliary FCN models are named model A, model B, and model C. Model A and model B are shallower, and model C is deeper than the main FCN model. The architectures of these FCN models are presented in Fig. 10.

These models are trained and evaluated in the same way as the main FCN model. Table 2 summarizes complexity, processing time, and recognition accuracy of the FCN models. The number of weight layers and parameters represents the complexity of FCN models. Training time was measured for the training of 50 epochs, and test time indicates the processing time for recognizing SINs in a test image. For each FCN model, an optimal training epoch was investigated by using the validation set, and the FCN with the training of each optimal epoch was used to evaluate recognition accuracy. F1-scores of model A, B, C for the validation set were maximized at the training of 17, 14, and 12 epochs. For the test set, sensitivity (precision) of model A, B, C, and the main FCN model was 98.3626% (97.9045%), 99.0877% (98.9488%), 98.6433% (98.6895%), and 99.1345% (99.1577%), respectively. Figure 11 presents f1-scores of the four FCN models for the test set at each epoch. Although model C contains more layers and parameters than the main FCN model, recognition accuracy was not significantly improved.
Table 2. Performance analysis for the FCN models.
| FCN model | Model A | Model B | Model C | Main model |
|---|
| Number of weight layers | 9 | 14 | 22 | 19 |
| Number of parameters | 2455490 | 12812482 | 35377348 | 26446018 |
| Training time (h) | 6.06 | 7.87 | 9.40 | 8.71 |
| Test time (s) | 0.0598 | 0.0753 | 0.0883 | 0.0825 |
| Number of correct SINs | 4205 | 4236 | 4217 | 4238 |
| Number of predicted SINs | 4295 | 4281 | 4273 | 4274 |
| Number of total SINs | 4275 | 4275 | 4275 | 4275 |
| Sensitivity (%) | 98.3626 | 99.0877 | 98.6433 | 99.1345 |
| Precision (%) | 97.9045 | 98.9488 | 98.6895 | 99.1577 |
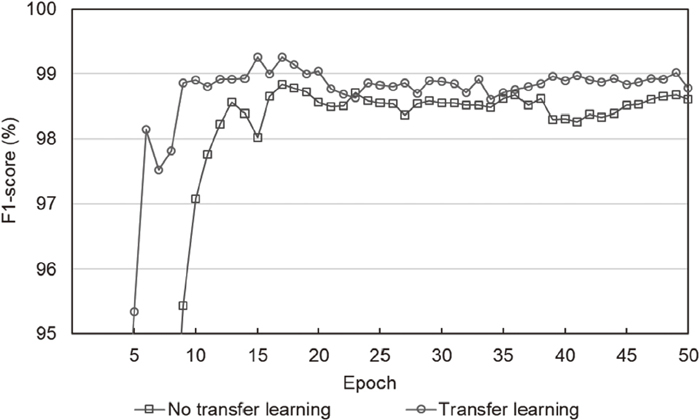
In the training of the FCN model, transfer learning of VGG19 was used to initialize the weights in the convolution layers. This section analyzes the effectiveness of the transfer learning. Figure 12 presents f1-score for the test set using the main FCN model which was trained with or without the use of pre-trained parameters. Without the use of pre-trained parameter, the f1-score for the validation set was maximized at the training of 34 epoch, and corresponding f1-score for the test set was 98.4799%. By using the pre-trained parameters of VGG19, the optimal training epoch was 18, and corresponding f1-score was 99.1461%. The averaged f1-score during the training of 50 epochs was 93.8662% (with transfer learning) and 88.3452% (without transfer learning). These results demonstrate that the use of the transfer learning reduces the training time and increases recognition accuracy, although the pre-trained parameters were trained on other domain.
3.7. Parameter Analysis
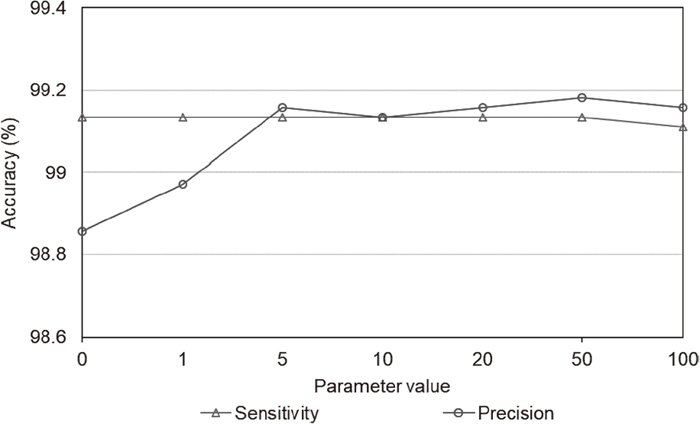
The proposed algorithm contains a heuristic threshold value (η) in the post-processing for finding vertical positions of SINs from an output prediction map. This section analyzes the effect of the heuristic parameter for the recognition accuracy. The major effect of the parameter is related to the number of predicted SINs. If the threshold value is small, many SIN candidates are generated, and it decreases precision rate. Figure 13 presents sensitivity and precision for the test set with various threshold values. Although the value of zero for the parameter caused slightly low precision, almost same sensitivity and precision were recorded for small and large positive values. This little variation on the sensitivity and precision demonstrates that the proposed algorithm is insensitive to the parameter η.
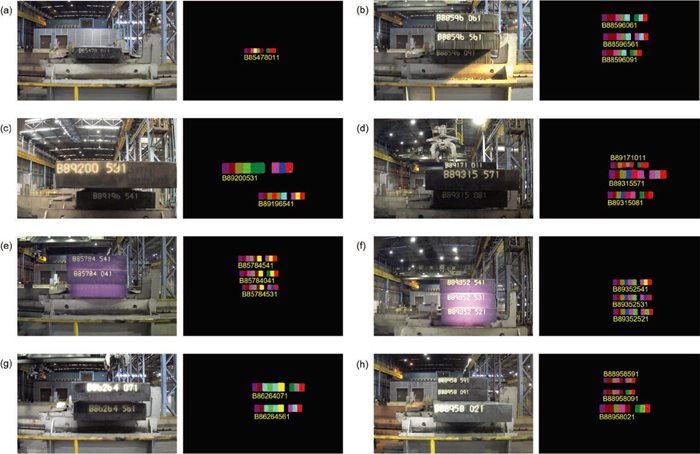
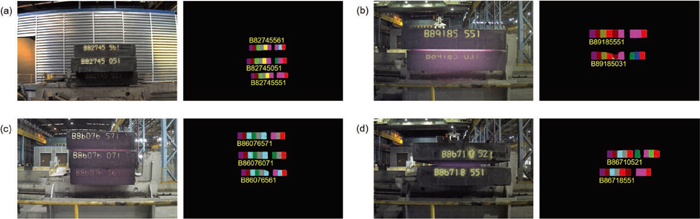
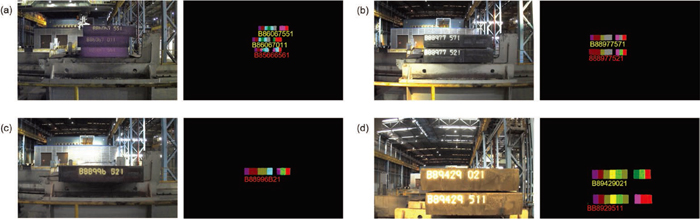
3.8. Result Images
The output of the proposed algorithm is transcribed SINs in an input factory scene. Figure 14 presents input image samples and corresponding output prediction maps of the main FCN model. A correct or incorrect recognition result was transcribed by yellow or red color on each output prediction map. Figure 15 presents correct recognition results that were incorrectly recognized by the previous algorithms.18,19) Figure 16 presents result images that contain incorrectly recognized SINs. These result images show the effectiveness of the proposed algorithm for recognizing SINs in factory scenes.
5. Conclusion
This paper proposes a simple and effective recognition algorithm for a confined scope of texts that contain a known number of equally-spaced characters. An image-typed GTD is proposed for the scene text recognition; a semantic region of a character is considered as a rectangle region that contains the character, and the categorical information of the character is labeled inside the rectangle region. FCN with deconvolution layers was used to conduct image-to-image training of an input scene and its corresponding GTD. Feature maps were upsampled by deconvolution layers to generate an output prediction map with the same size as an input image. By combining mid-level feature maps, the information from various receptive fields was jointly used to recognize texts of various sizes. FCN models with various complexities were designed and analyzed to develop an appropriate FCN architecture for a specific application.
The proposed algorithm was applied to the recognition of SINs in factory scenes. A SIN is constructed with a fixed number of characters that are horizontally placed with similar distances. Therefore, this real industry problem satisfies the sufficient conditions for applying the proposed algorithm. The simple recognition pipeline and improved accuracy with significantly reduced processing time are main advantages of the proposed algorithm. Experiments were thoroughly conducted with actual factory scenes, and the performance was compared with previous algorithms that were carefully engineered for the identical dataset. The proposed algorithm is expected to be used for other industry applications such as license plate recognition and product serial number recognition.
References
- 1) Q. Ye and D. Doermann: IEEE Trans. Pattern Anal. Mach. Intell., 37 (2015), 1480.
- 2) A. Coates, B. Carpenter, C. Case, S. Satheesh, B. Suresh, T. Wang, D. J. Wu and A. Y. Ng: Proc. 2011 Int. Conf. on Document Analysis and Recognition (ICDAR), IEEE Computer Society, Washington, DC, (2011), 440.
- 3) X.-C. Yin, X. Yin, K. Huang and H.-W. Hao: IEEE Trans. Pattern Anal. Mach. Intell., 36 (2014), 970.
- 4) I. Ahmad, X. Wang, R. Li, M. Ahmed and R. Ullah: IEEE Access, 5 (2017), 10924.
- 5) X. Chen, J. Yang, J. Zhang and A. Waibel: IEEE Trans. Image Process., 13 (2004), 87.
- 6) C. Yao, X. Bai, B. Shi and W. Liu: Proc. IEEE Conf. on Computer Vision and Pattern Recognition, IEEE Computer Society, Washington, DC, (2014), 4042.
- 7) A. Krizhevsky, I. Sutskever and G. E. Hinton: Proc. Advances in Neural Information Processing Systems (NIPS 2012), Neural Information Processing Systems Foundation, La Jolla, CA, (2012), 1097.
- 8) C. Szegedy, A. Toshev and D. Erhan: Proc. Advances in Neural Information Processing Systems (NIPS 2013), Neural Information Processing Systems Foundation, La Jolla, CA, (2013), 2553.
- 9) K. Wang, B. Babenko and S. Belongie: 2011 IEEE Int. Conf. on Computer Vision (ICCV), IEEE, Piscataway, NJ, (2011), 1457.
- 10) M. Jaderberg, A. Vedaldi and A. Zisserman: European Conf. on Computer Vision, Springer, Berlin, (2014), 512.
- 11) T. Wang, D. J. Wu, A. Coates and A. Y. Ng: 21st Int. Conf. on Pattern Recognition (ICPR 2012), ICPR 2012 Orgnizing Committee, Tsukuba, (2012), 3304.
- 12) S. G. Ryu, D. C. Choi, Y. J. Jeon, S. J. Lee, J. P. Yun and S. W. Kim: ISIJ Int., 54 (2014), 112.
- 13) G. Shengqi: ISIJ Int., 55 (2015), 1950.
- 14) Y. J. Jeon, D. C. Choi, J. P. Yun and S. W. Kim: ISIJ Int., 55 (2015), 1942.
- 15) M. Chu and G. Rongfen: ISIJ Int., 55 (2015), 1956.
- 16) S. Choi, J. P. Yun, K. Koo and S. W. Kim: Opt. Eng., 48 (2009), 037206.
- 17) S. Choi, J. P. Yun, K. Koo and S. W. Kim: Expert Syst. Appl., 39 (2012), 7621.
- 18) S. J. Lee and S. W. Kim: Expert Syst. Appl., 77 (2017), 34.
- 19) S. J. Lee, J. P. Yun, G. Koo and S. W. Kim: Knowl. Based Syst., 132 (2017), 1.
- 20) E. Shelhamer, J. Long and T. Darrell: IEEE Trans. Pattern Anal. Mach. Intell., 39 (2017), 640.
- 21) S. Ren, K. He, R. Girshick and J. Sun: Proc. Advances in Neural Information Processing Systems (NIPS 2015), Neural Information Processing Systems Foundation, La Jolla, CA, (2015), 91.
- 22) S. Xie and Z. Tu: Int. J. Comput. Vis., 125 (2017), 3.
- 23) S. Zhang, M. Lin, T. Chen, L. Jin and L. Lin: 2016 IEEE Int. Conf. on Acoustics, Speech and Signal Processing (ICASSP), IEEE Signal Processing Society, Piscataway, NJ, (2016), 2633.
- 24) T. He, W. Huang, Y. Qiao and J. Yao: arXiv:1603.09423, (2016), https://arxiv.org/pdf/1603.09423, (accessed 2018-02-02).
- 25) Z. Zhang, C. Zhang, W. Shen, C. Yao, W. Liu and X. Bai: Proc. IEEE Conf. on Computer Vision and Pattern Recognition, IEEE Computer Society, Washington, DC, (2016), 4159.
- 26) S. Calarasanu, J. Fabrizio and S. Dubuisson: European Conf. on Computer Vision, Springer, Berlin, (2016), 378.
- 27) Y. Netzer, T. Wang, A. Coates, A. Bissacco, B. Wu and A. Y. Ng: Advances in Neural Information Processing Systems (NIPS) Workshop on Deep Learning and Unsupervised Feature Learning, Neural Information Processing Systems Foundation, La Jolla, CA, (2011), 5.
- 28) D. Kingma and J. Ba: arXiv:1412.6980, (2014), https://arxiv.org/pdf/1412.6980, (accessed 2018-02-02).
- 29) K. Simonyan and A. Zisserman: arXiv:1409.1556, (2014), https://arxiv.org/pdf/1409.1556, (accessed 2018-02-02).