1. Introduction
High-speed continuous casting is one of key technologies for improvements of steel productivity. Very fast casting, however, brings about surface defects called ‘longitudinal cracking’, especially for medium carbon (MC) peritectic steel.1,2,3) Longitudinal cracking is supposed to be due to thermal stresses in the steel shell resulting from non-uniform solidification shrinkage during the δ–γ transformation occurring at the initial solidification stage.4) To minimise suchlike defects, it is necessary to control the heat transfer across mould flux film ~ 1 mm thick consisting of liquid, partially crystallised and glassy layers, existing between the steel shell and the mould. For example, Kanazawa et al.5) have reported that the steel strand can be cooled uniformly when the extracted heat flux is lower than about 2.0 × 10⁶ Wm−2. The cooling rate depends on the thermo-physical properties of the flux film and, thus, uniform cooling can be achieved by designing mould flux compositions for mild cooling (or moderate cooling). In practice, mould flux is designed to be partially crystallised, and thereby the heat transfer is reduced, leading to improvement in homogeneity of solidification.2,3,6) Thus, it is important to know how crystallisation of mould flux reduces the heat transfer for further improvements of mould flux.
Against this background, understanding of the mechanism of heat transfer reduction by crystallisation of mould flux has been one of the most commonly applied subjects in the research field on continuous casting.7,8) The propositions in the previous studies roughly fall into the following two mechanisms:
(i) Reduction of radiative heat transfer by scattering: the crystal grains introduced by crystallisation scatter the radiation emitted from the steel shell and reduces radiative heat transfer.
(ii) Reduction of conductive heat transfer by an air gap: crystallisation introduces an air gap between the flux and the mould, which increases interfacial thermal resistance and reduces conductive heat transfer.
With respect to the mechanism (i) - radiative heat transfer reduction -, Nakada et al.9) have reported a heat transfer model including the optical process, in which model part of radiative energy emitted from steel shell is assumed to be reflected by crystalline phases in mould flux and returned to the steel again. This model has further been progressed by some of the present authors, who have shown the possibilities of reducing radiative heat flux by (a) increasing the degree of crystallinity,10,11,12,13) (b) decreasing the iron oxide concentration,11) (c) adjusting the crystalline grain sizes in 2–3 μm14) and (d) increasing the concentration ratio of Fe3+/Fe2+ in crystallised mould fluxes.12) In these studies, however, values of radiative heat flux have been estimated on the basis of a simple optical process model using optical characteristic data such as reflectivity and transmissivity measured at room temperature only. It is more important in practice to know how crystallisation of mould flux reduces the total heat flux including conductive heat flux under a temperature gradient as steep as ~ 1200 K/mm formed in actual mould flux film.
In contrast, there have been several studies to attempt to evaluate the apparent thermal conductivity or resistance including both conductive and radiative contributions under steep temperature gradients.15,16,17,18,19,20,21) For example, Yamauchi et al.16) have measured to compare thermal resistances of mould fluxes with different degrees of crystallinity using the parallel plate method. They have reported that radiative heat flux can be reduced by crystallisation, where the discussion has been made on the total heat resistance including the contributions from the air gap and the liquid phase. Accordingly, it is still uncertain whether crystallised mould flux itself reduces the total heat transfer. On the other hand, Watanabe et al.22) have dipped a water-cooled copper sheet in a flux melt to conduct heat transfer analysis and surface observation. They have reported that crystallisation increases surface roughness of mould flux, suggesting that mechanism (ii) - conductive heat transfer reduction - is more predominant. In addition, Tsutsumi et al.23) have measured surface roughnesses of glassy and crystalline flux samples prepared at various cooling rates and shown that more crystallised samples have rougher surfaces, suggesting that crystallisation reduces conductive heat flux due to the air gap on the basis of a model calculation. As mentioned above, the presence of the air gap has been suggested experimentally; on the contrary, there is a report which doubts whether or not the air gap is formed under static pressure exerted onto the mould flux film from the molten steel.3)
As described above, there have been many studies which propose mechanisms (i) and/or (ii); however, further verification should be conducted on each study experimentally as well as theoretically. Hence, it is very important to remind:
- Mould flux film is a very complex system consisting of three layers, i.e., basically liquid, partially crystallised and glassy layers; in addition, an air gap may join.
- The total mould flux system is roughly 1 mm thick and exists under a temperature gradient as steep as ~ 1200 K/mm.
Thus, it is very difficult to examine how crystallisation reduces the total heat flux in experimental conditions which reproduce practical conditions satisfactorily. On the other hand, there is also a fact that the partially crystallised layer comprises the major part of mould flux film.2,4,5,16,18) As a first step, accordingly, it is strongly required to understand how crystallisation reduces the total heat flux across the partially crystallised layer, i.e., a solid flux layer under steep temperature gradients.
Consequently, the present work focuses on the “apparent thermal conductivity” of the solid flux layer only and aims:
- to develop an apparatus measuring the apparent thermal conductivity of solid mould flux under steep temperature gradients,
- to measure the apparent thermal conductivity of solid mould flux as a function of degree of crystallinity, and finally
- to propose a mechanism of how crystallisation reduces the total heat flux across solid mould flux film, from the perspectives of radiative and conductive contributions.
2. Experimental
2.1. Apparatus and Principle
Figure 1 shows a schematic diagram of the apparatus developed in the present work for apparent thermal conductivity measurement based on the parallel plate method. A plate sample is sandwiched between two stainless (SUS304) plates. The lower stainless plate is placed on a Ni-based super alloy (Inconel 600) plate 1 mm thick, which, in turn, is supported by alumina rods (φ 6 mm). There are five rod-type heating elements of SiC placed about 30 mm below the alumina rods. The upper stainless plate has three holes for cooling water, each of which is soldered to a stainless (SUS304) tube for water supply. There are also seven holes (10 mm in depth and 1 mm in diameter) in the two stainless plates as shown in Fig. 1, to measure temperatures at positions 1–7 (T1–T7, respectively) using K type thermocouples of 1 mm in diameter. On both surfaces of the sample, silver paste is applied to decrease the contact thermal resistance.
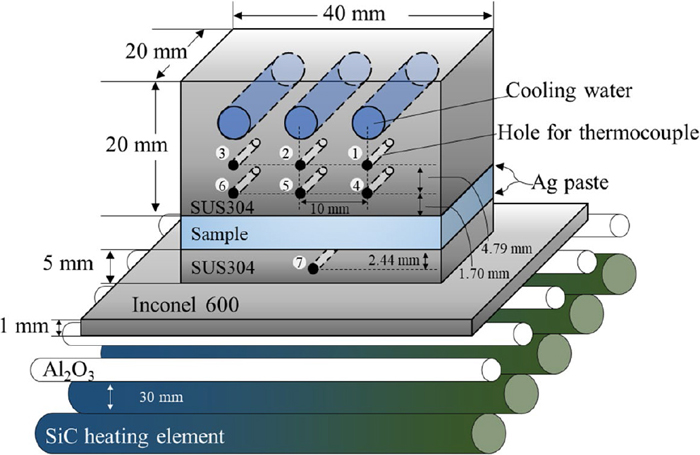
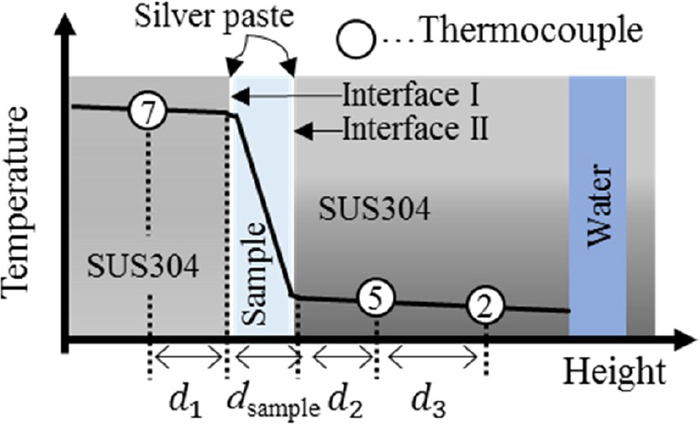
Figure 2 shows a schematic diagram of the temperature distribution along positions 2, 5 and 7. Where the system is in the steady state, the thermal resistance (R) between positions 5 and 7 is described as follows.
|
R =
T
7
-
T
5
q
=
d
1
λ
SUS
+
r
I
+
d
sample
λ
sample
+
r
II
+
d
2
λ
SUS
| (1) |
where
q is the heat flux,
d1 is the distance (2.44 mm) from position 7 to interface I,
dsample is the thickness of the sample,
d2 is the distance (1.70 mm) from position 5 to interface II,
λsample and
λSUS are the thermal conductivities of the sample and the stainless plate, respectively, and
rI and
rII are the contact thermal resistances at interfaces I and II, respectively. In this equation, (
d1/
λsus),
rI,
rII and (
d2/
λsus) are assumed to be constants which depend on the apparatus, the reasonableness of which is discussed later. Thus,
Eq. (1) is simplified as follows.
|
R=
d
sample
λ
sample
+
R
c
| (2) |
where
Rc is the sum of the constant terms. According to
Eq. (2),
R is in linear proportion to
dsample, and the gradient of the linearity is the reciprocal of
λsample. Thus, the value of
λsample can be determined by obtaining
R for the same samples having different thicknesses. The value of
R can be derived from
Eq. (1) in case the value of
q is known. The value of
q can be derived using temperatures
T2 and
T5 measured, on the basis of Fourier’s law in the following.
|
q=
∫
T
2
T
5
λ
SUS
dT
d
3
| (3) |
where
d3 is the distance (4.79 mm) between positions 2 and 5, and
λSUS is considered to be a function of temperature as follows.
|
λ
SUS
=6.699×
10
-6
T
K
2
+2.339×
10
-2
×
T
K
+7.845
| (4) |
Equation (4) is an approximated equation of reported values for SUS304,24) where TK is thermodynamic temperature in K, and can be applied in the temperature range between 60°C and 700°C.
2.2. Samples
Samples used in the present work were Inconel 600, fused silica, glassy mould flux and crystallised mould flux. Inconel 600 samples were used for determining Rc in Eq. (2). The dimension of Inconel samples was 20 × 40 mm2 and the thickness was in the range of 1–5 mm. Fused silica was used to confirm the accuracy of the apparatus as well as the reasonableness of the method because there have been many reports25,26,27,28) for its thermal conductivity and the value is close to that of mould flux. The dimension of fused silica samples was the same as those of Inconel samples.
Mould flux samples were made so as to have the chemical compositions given in Table 1. Reagent powders of Al2O3, MgO, Na2CO3, CaF2, CaO and SiO2 were weighed so as to have desired compositions and mixed in an alumina motor, where CaO was prepared by thermal decomposition of CaCO3 reagent powders at 1050°C for 12 h. The mixed powders were melted in a platinum crucible in air at 1400°C for 300 s. The melt was cast into a brass mould sized 20 × 40 × 5 mm3 to obtain homogeneous glassy samples. Some of the glassy samples were crystallised by heat treatment at 530°C, 550°C, 600°C, 660°C, 700°C, 800°C and 900°C in air for 10 h at Tt ≤ 600°C and 2 h at 660°C ≤ Tt, where Tt represents the heat treatment temperature. The heat treatment time was decided from the progress of crystallisation observed in preliminary experiments. The crystallised samples were analysed by scanning electron microscopy (SEM), and the degree of crystallinity was derived as the ratio of the area of the crystalline part to the total area using SEM images assuming that the sample is macroscopically uniform. The crystalline phases were identified by an electron probe micro analyser (EPMA) and X-ray diffraction (XRD) analysis. Mould flux samples were thinned to desired thicknesses (1–5 mm) by polishing both surfaces of the samples after each measurement was finished.
Table 1. Chemical composition of mould flux sample (mass%).
| Basicity | Contents |
|---|
| CaO/SiO2 | SiO2 | CaO | Al2O3 | MgO | Na2O | F |
| 1.0 | 38 | 38 | 3 | 1 | 10 | 10 |
The surfaces of the stainless plates, Inconel 600 samples and mould flux samples were polished with emery papers up to #2000. The fused silica samples were not polished because the surfaces were smooth enough. Silver paste was applied onto both sides of the samples, and each sample was sandwiched in between the stainless plates. The silver paste was dried at room temperature for more than 2 h, after which thermocouples were inserted into the holes at positions 1–7, and water cooling as well as heating was started. The water flow rate was fixed at 8.33 cm3·s−1 i.e. 29.4 cm·s−1 in each tube. The temperatures were recorded every 5 s by a digital multimeter connected with a PC.
The sample was heated so that T7 reached a desired temperature to obtain a steady state. Table 2 shows the range of T7 applied to each sample. The maximum temperature of T7 for crystallised samples was basically lower than Tt to prevent further crystallisation of the samples during the measurements; however, for the sample with Tt = 660°C as well as the glassy sample, measurements were also taken at T7 = 900°C. After the measurements, values of R were calculated from temperatures T2, T5 and T7 measured to obtain apparent thermal conductivities.
Table 2. Range of
T7 for each sample.
| Sample (Tt/°C) | T7/°C |
|---|
| Inconel 600 | 100–500 |
| Silica glass | 100–900 |
| Glassy flux | 100–500, 900 |
| Crystallised flux (530) | 100–530 |
| Crystallised flux (550) | 100–550 |
| Crystallised flux (660) | 100–660, 900 |
| Crystallised flux (800) | 100–800 |
Additional experiments were also conducted to confirm the effect of silver paste. A fused silica 2 mm thick was used as a sample, and silver paste was applied onto interface I only or onto both interfaces I and II, the latter condition being employed in the present work. The measurements were conducted for T7 = 100°C and the values of R were calculated from the results.
3. Results and Discussion
3.1. Establishment of Experimental Conditions
3.1.1. Confirmation of Steady State and Temperature Distribution in the Apparatus
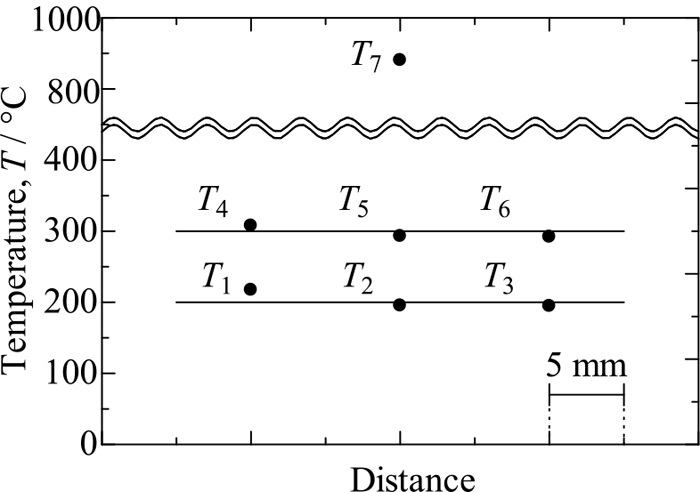
Figure 3 shows the temperature history used in a measurement for a fused silica sample 3 mm thick. Temperatures T1–T7 are roughly constant in the time periods 1800–1900 s and 2700–2900 s, where T7 = 800°C and 900°C were taken as desired temperatures, respectively. This figure confirms that steady states can be achieved in the present experimental apparatus. Figure 4 shows average temperatures of T1–T7 recorded in the time period 2700–2900 s in Fig. 3 against distance. The horizontal temperature distribution is almost uniform although temperatures T1 and T4 are higher by about 16°C than the two corresponding temperatures. This result guarantees at least that there is no heat loss from the central part of the stainless plate to the outer part. In addition, the horizontal temperature gradient is about 1.6 K/mm, whereas the vertical temperature gradient is about 20.4 K/mm in the water-cooled stainless plate. Comparison between these values suggests that the horizontal temperature distribution does not considerably affect the determination of heat flux.
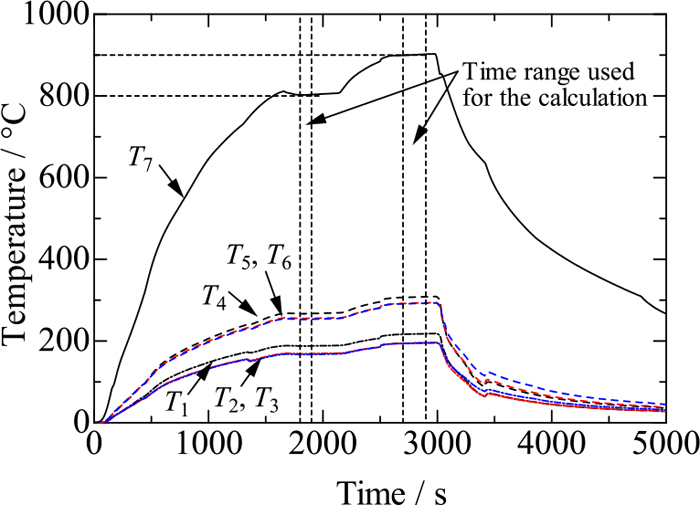
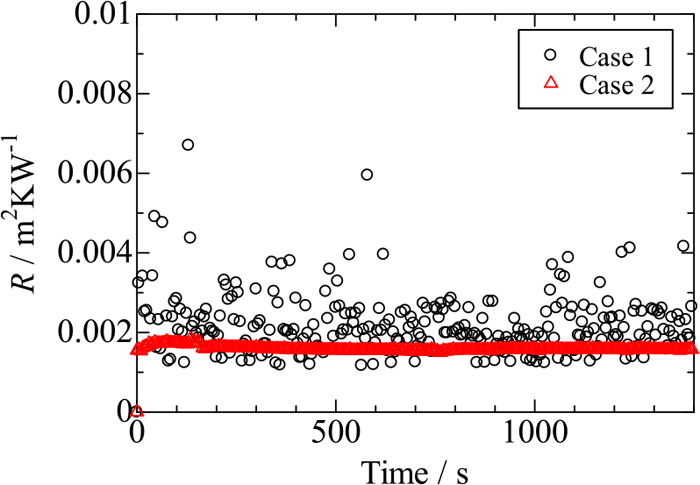
Figure 5 shows changes with time in R measured for two fused silica samples 2 mm thick under the condition of T7 = 100°C: in one sample silver paste was applied only onto interface I (case 1), and in the other onto interfaces I and II (case 2). The average value of R and its standard deviation are derived using the data recorded in the time period 500–1000 s as (2.08 ± 0.65) × 10−3 m2KW−1 for case 1 and (1.56 ± 0.02) × 10−3 m2KW−1 for case 2. The value of R in case 2 becomes smaller and its uncertainty also decreases. The difference of R in these two cases is 5.2 × 10⁻⁴ m2KW−1, which is roughly the same as reported values of contact thermal resistance due to an air gap.15,16,17,18,20) As a consequence of this, silver paste was applied to both interfaces in the present work, except for this section.
3.1.3. Determination of Value of Rc
The value of Rc is derived on the basis of Eq. (2): there is linearity between R and sample thickness, and the slope of the linearity is the reciprocal of thermal conductivity and its intercept is the value of Rc. Accordingly, values of R measured for Inconel samples are plotted against sample thickness (dInconel) to derive thermal conductivity. Now a difficulty is encountered with, that is, the thermal conductivity of Inconel decreases with increasing temperature and thereby is different from position to position in the present sample with a considerable temperature gradient. Thermal conductivity discussed in the present work is apparent thermal conductivity of a sample under a temperature gradient, and thus the representative temperature of the sample is decided to avoid this difficulty. Hence, the temperature at the centre of the sample (Tc) is taken as the representative for convenience and is derived as an average of temperatures at interfaces I and II (TI and TII), which in turn are derived from Eq. (5) using measured temperatures of T5 and T7, heat flux q and λSUS as a function of temperature given by Eq. (4), where the presence of rI and rII is neglected.
|
q=-
∫
T
I
T
7
λ
SUS
dT
d
1
=-
∫
T
5
T
II
λ
SUS
dT
d
2
| (5) |
Figure 6 shows values of R measured for Inconel samples in the range of 100–500°C in T7 against sample thickness, where measured values of T5 were roughly constant and their standard deviations were within ± 5% for each T7, irrespective of sample thickness. The straight lines in this figure have been drawn by the method of least squares so as to have slopes derived from reported thermal conductivity values of Inconel at Tc.29) There seem reasonable agreements between the experimental data and the straight lines, except for a few data. The slope decreases progressively with increasing temperature, which reflects that the thermal conductivity of Inconel has positive temperature coefficients. On the contrary, the intercept has no systematic change with temperature. The average and standard deviation of the intercept (Rc) are derived as (2.27 ± 0.37) ×10−4 m2KW−1.

First, focus on the average value of Rc. The term of Rc consists of terms (d1/λsus), rI, rII and (d2/λsus) from comparison between Eqs. (1) and (2). Here the terms of (d1/λsus) and (d2/λsus) can be calculated using the experimental conditions and reported thermal conductivity values of SUS304,23) and the sum has been derived as (2.29 ± 0.24) ×10−4 m2KW−1. Comparison with the value of Rc indicates that thermal resistance due to the stainless plates dominates the value of Rc within experimental uncertainty, which supports that the neglect of terms rI and rII is reasonable in the above discussion on derivation of Tc. Second, focus on the standard deviation of Rc, 0.37 × 10⁻⁴ m2WK−1. This magnitude may be considerable in the values of R measured for Inconel. As can be seen from Fig. 5, however, the values of R measured for silica are around 2 × 10⁻³ m2WK−1, which is about two orders of magnitude greater than the standard deviation of Rc. In addition, the thermal conductivity of silica is expected to be almost equal or greater than that of mould flux.7,9,10,15,16,17,19,20) Accordingly, the neglect of the uncertainty in Rc would not cause large error in the determination of thermal conductivity of mould flux because it may have greater thermal resistance. As a consequence of this, the value of Rc has been determined to be 2.27 × 10⁻⁴ m2KW−1 in the present work.
3.2. Thermal Conductivity of Fused Silica
Figure 7 shows values of R measured for fused silica samples against sample thickness (dsilica). The values of R increase with increasing sample thickness at each T7. The linearity seems better in data obtained at lower temperatures; in contrast, data at higher temperatures seem to fall on convex curves. Nevertheless, the method of least squares has been applied to these data so as to pass the intercept, Rc = 2.27 × 10⁻⁴ m2KW−1 determined in the above. From the slopes of the straight lines obtained, thermal conductivities of fused silica samples (λsilica) are calculated via Eq. (2).
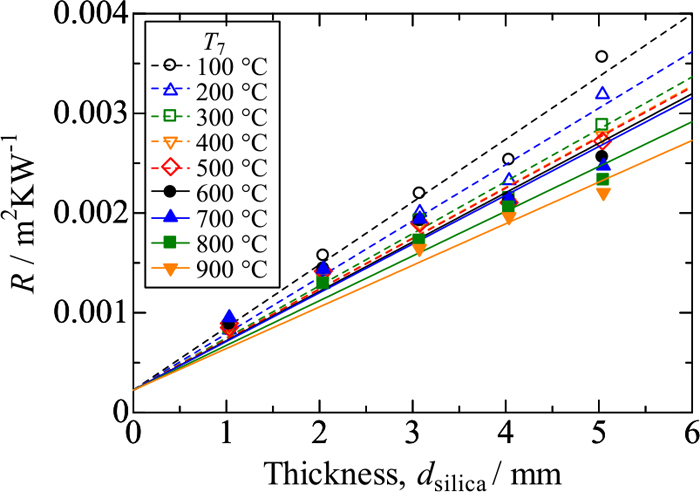
Figure 8 shows the thermal conductivity of fused silica as a function of Tc. The values measured in the present work exhibit almost the same trend as reported values26,27,28) in the temperature range up to 350°C, above which the measured values increase with increasing temperature and show good agreement with values reported by Kingery26) and Sugawara,27) who have given comments that their values contain radiative contribution. Thus, the values of thermal conductivity measured in the present work may also contain radiative contribution, which will be corrected in the following.
Now it is assumed that the value of q derived from Eq. (3) consists of conductive (qconductive) and radiative (qradiative) heat fluxes.
|
q=
q
conductive
+
q
radiative
| (6) |
The radiative heat flux can be estimated from Eq. (7)9,19,30)
|
q
radiative
=
n
2
σ(
T
I
4
-
T
II
4
)
0.75α
d
silica
+
ε
I
-1
+
ε
II
-1
-1
| (7) |
where
n and
α are the refractive index and absorption coefficient of fused silica, respectively,
σ is the Stefan-Boltzmann constant (5.67 × 10
−8 Wm
−2K
−4),
εI and
εII are the emissivities at interfaces I and II. The value of refractive index has been reported to be 1.43
31) for a wavelength range 2.2–3.0
μm and a temperature range 26–828°C, and the value of
α to be higher than ~ 100 m
−1 32) above room temperature for a wavelength of 2.5
μm which corresponds to the wavelength of the strongest radiation at 900°C predicted from Wien’s displacement law. In addition, an emissivity value of silver paste of 0.44
33) is employed as the emissivities at interfaces I and II. This value has been used for temperatures between 300°C and 600°C in the literature.
Figure 9 shows heat fluxes q, qradiative and qconductive across the fused silica samples against sample thickness, where q has been obtained in the measurement for T7 = 900°C (TI = 867–873°C and TII = 280–331°C, depending on dsilica), qradiative has been derived from Eq. (7), and qconductive has been derived from Eq. (6) using q and qradiative. The value of qradiative is roughly 0.50 × 10⁵ Wm2, irrespective of sample thickness, because the value of α for fused silica is as small as 100 m−1. On the other hand, the value of q decreases with increasing sample thickness; as a result, the radiative contribution is relatively greater in thicker samples. This would account for the data at higher temperatures in Fig. 7 falling on convex curves. Now the value of qconductive is used for Eq. (2) to correct thermal conductivity values of the fused silica samples.
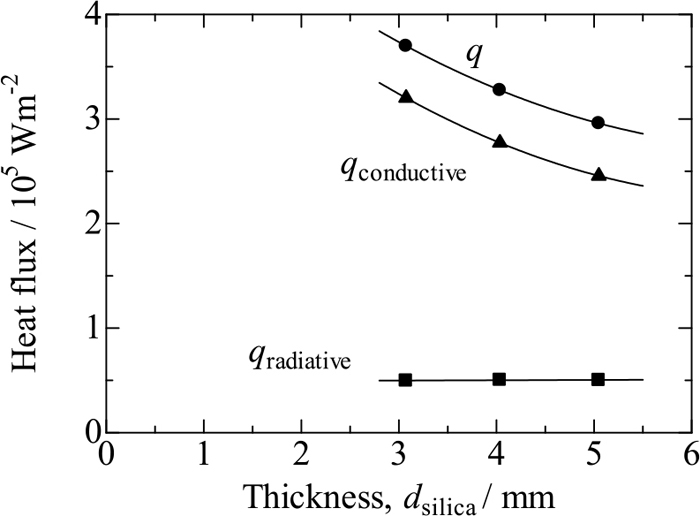
Figure 8 also includes corrected thermal conductivity values of the fused silica samples, which show little temperature dependence at higher temperatures and are in good agreement with reported values without radiative contribution.25) Thus, it has been confirmed that the increase in thermal conductivity of the fused silica samples above 350°C is due to radiative contribution and, in other words, that the present measurement method produces the apparent thermal conductivity including the effect of radiation.
3.3. Characterization of Mould Flux Samples
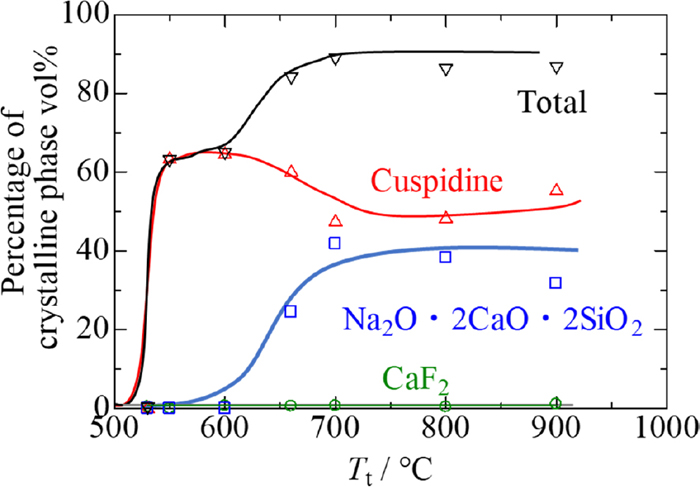
Figure 10 shows backscattered electron (BE) images of crystallised mould flux samples. The types of precipitate vary depending on the heat treatment temperature for crystallisation. Crystal phases were analysed by EPMA and XRD resulting in: at 530°C, only CaF2 precipitates, cuspidine (3CaO·2SiO2·CaF2) also appears at 550°C and 600°C, above which Na2O·2CaO·2SiO2 is also observed. The brightness of the phase in the figure is in the order; CaF2 > Cuspidine > Na2O·2CaO·2SiO2 > glassy phase. The shape and dimension of crystalline phases also depend on temperature. It is noted that the crystalline phases are uniformly dispersed across the sample. Figure 11 shows the percentages of crystalline phases in the mould flux samples. All the samples contain about 1 vol% CaF2. The percentage of cuspidine exceeds 60 vol% at 550°C and 600°C but decreases to 50 vol% at higher temperatures. In contrast, the percentage of Na2O·2CaO·2SiO2 lies around 30–40 vol% above 700°C. The total percentage of all the crystalline phases is called the degree of crystallinity in the present work.
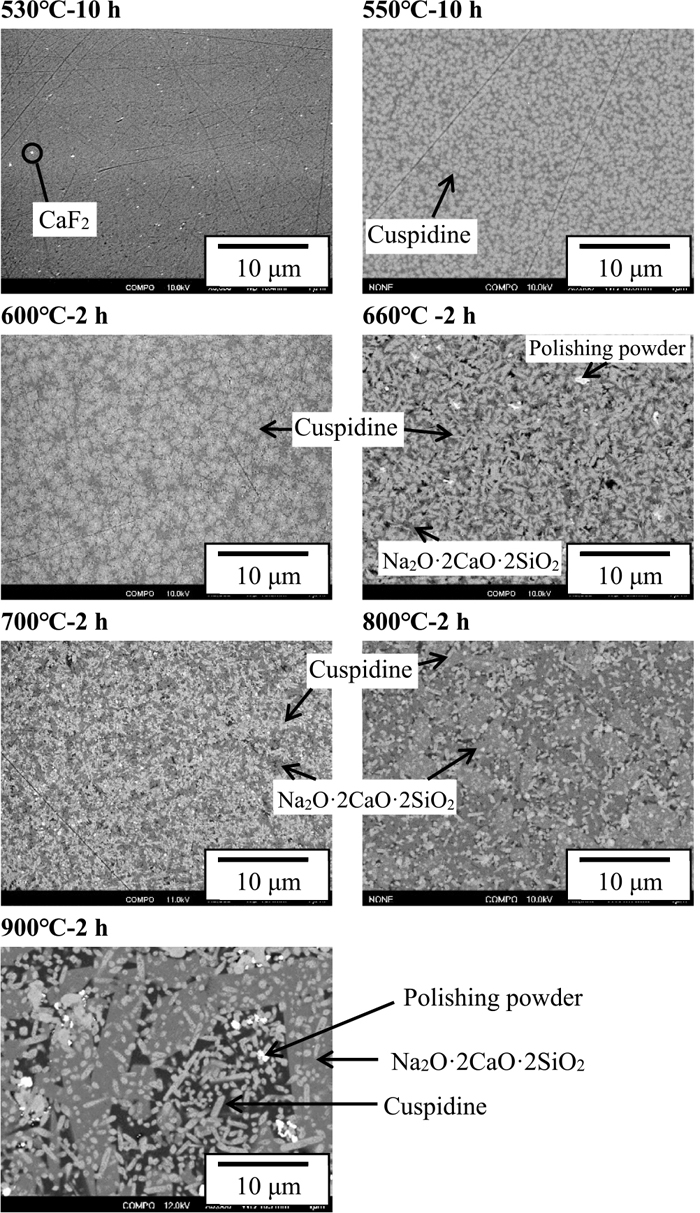
Figure 12 shows values of R measured for glassy and crystallised mould flux samples, for the latter, heat treatment for crystallisation being conducted at Tt = 660°C. The values of R for the glassy sample represented by dashed lines do not depend on temperature T7 very much. In contrast, the values of R for the crystallised samples represented by solid lines increase more remarkably with increasing temperature T7.

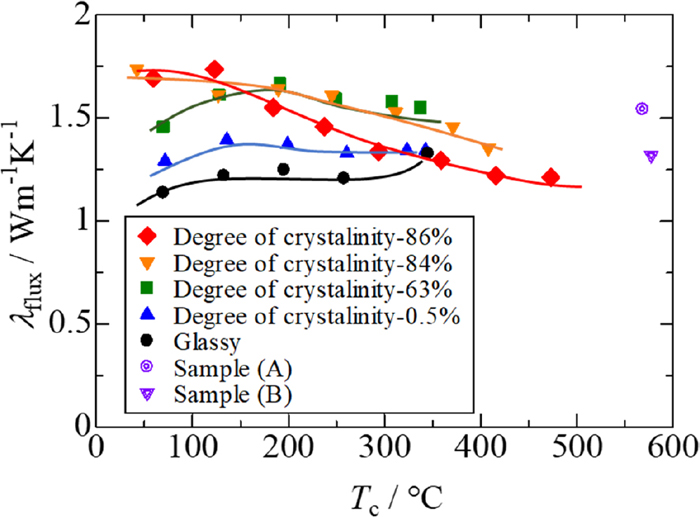
Figure 13 shows apparent thermal conductivity values (λflux) determined for mould flux samples as functions of Tc, where the percentage given represents the degree of crystallinity of each sample. It has been confirmed that there are no changes in microstructure observed in the samples before and after the measurements at temperatures of Tc < 500°C. The thermal conductivity of the glassy sample is 1.25 Wm−1K−1, almost independent of temperature, which is close to the feature of the thermal conductivity of fused silica shown in Fig. 8. The slight increase of thermal conductivity around 350°C would arise from radiative contribution. With increasing degree of crystallinity, the thermal conductivity tends to increase at lower temperatures. In addition, the thermal conductivities of crystallised mould fluxes decrease with increasing temperature. These trends are too complicated to explain at the moment. In simple theory of solid state physics, thermal conductivity of insulating materials (λ) is expressed as
where
C,
v and
l represent the specific heat per unit volume, the speed of sound and the mean free path of phonons, respectively. However, there is no enough information on
C,
v and
l for mould flux for further discussion. Nevertheless, it is supposed that the increase in thermal conductivity with crystallisation is relevant to the increase in
l due to structural ordering. In addition, the value of
l for crystalline insulating materials generally decreases according to a function of
T−1 with increasing temperature due to enhanced phonon scattering. This would be relevant to the decrease in thermal conductivity at higher temperatures observed in the samples with higher degrees of crystallinity.
3.4.2. Thermal Conductivity in the Range of 500°C ≤ Tc < 600°C
Figure 13 also includes data marked by (A) and (B). These samples (A) and (B) used to be, respectively, a glassy sample and a crystallised sample with a degree of crystallinity of 84 vol%, the latter being heat-treated at Tt = 660°C. It should be noted that the thermal conductivity of glassy sample (A) is greater than that of crystallised sample (B). Furthermore, it is also noted that, in the measurements at Tc = 550°C which corresponds to T7 = 900°C, parts of the samples were structurally changed. Figure 14 shows cross-sectional views of samples (A) and (B) after the measurements. Sample (A) is also crystallised in the portion exposed to higher temperatures. Sample (B) looks unchanged before and after the measurement; in actuality, there is a change in microstructure in the portion exposed to higher temperatures, which microstructure corresponds to those shown in Fig. 10. Apparent thermal conductivities of these samples shown in Fig. 13 were determined from the temperatures in steady states and should be equal to values of the samples after the structural changes. Inspection of Fig. 13 indicates that sample (A) has a larger thermal conductivity than sample (B). This result, however, is inconsistent with a common view that thermal conductivity of glassy substance is smaller than that of crystalline substance. This would be because there is radiative contribution to the thermal conductivity values of samples (A) and (B) measured at T7 = 900°C, as seen for fused silica at Tc > 350°C.

To examine the above inconsistency, conductive and radiative contributions to the thermal conductivities of samples (A) and (B) are examined as follows. First, thermal conductivities without the effect of radiation (λconductive) are estimated for samples (A) and (B) on the basis of the temperature dependence described in 3.4.1: thermal conductivity of the glassy sample is roughly constant, irrespective of temperature, whereas thermal conductivity of the crystallised samples decreases with increasing temperature and, in theory, is in proportion to a function of T−1. Figure 15 shows apparent thermal conductivities of the crystallised mould fluxes against T−1, in which the data measured in the range of Tc < 350°C are used where radiative contribution is negligibly small according to the result on fused silica. There is good linearity obtained for each sample, and the slope is greater with increasing degree of crystallinity. This figure is used for the following discussion.
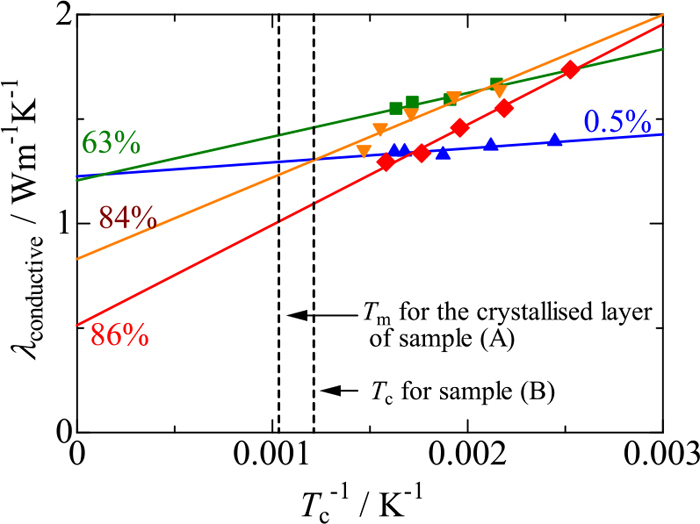
Figure 16 shows estimated temperature distributions in samples (A) and (B). Sample (A) is composed of glassy and crystallised layers which would have different thermal conductivities. The temperature (Tg/c) at the interface between glassy and crystallised layers is assumed to be 540°C because it is the lowest temperature at which cuspidine precipitates in the sample, as shown in Fig. 11. The middle temperatures (Tm) in the glassy and crystallised layers are estimated to be 413°C and 695°C, respectively, by taking the average of TI, Tg/c and TII. The thermal conductivity (λconductive-g) of glassy layer is 1.25 Wm−1K−1 at 413°C, as shown in Fig. 13. On the other hand, the crystallised layer is assumed to have the degree of crystallinity in the range of 80–90% from Fig. 11. Hence, the thermal conductivity (λconductive-c) is estimated to be 1.12 Wm−1K−1 at Tc = 695°C by averaging the values derived from Fig. 15 for crystallised samples with degrees of crystallinity of 84% and 86% at Tc−1 = 0.00103 K−1. Using these values of λconductive-g and λconductive-c, the thermal conductivity (λconductive) of the entire sample (A) is calculated to be 1.19 Wm−1K−1 from Eq. (9).
|
λ
conductive
=
d
flux
λ
conductive-c
λ
conductive-g
d
g
λ
conductive-c
+
d
c
λ
conductive-g
| (9) |
which has been derived from a predictive equation of thermal conductivity for composite material as follows:
|
d
flux
λ
conductive
=
d
c
λ
conductive-c
+
d
g
λ
conductive-g
| (9’) |
On the other hand, Tc of sample (B) is ca. 577°C and its thermal conductivity is estimated to be 1.18 Wm−1K−1 by averaging the values derived from Fig. 15 for crystallised samples with degrees of crystallinity of 84% and 86% at Tc−1 = 0.00118 K−1.
Second, the radiative conductivity (λradiative) is estimated from Eq. (10).
|
λ
radiative
=
q
radiative
d
flux
T
I
-
T
II
| (10) |
where
qradiative is determined from
Eq. (7) assuming that samples (A) and (B) are homogeneous, where
dflux is used instead of
dsilica. The refractive indices for samples (A) and (B) are assumed to be 1.57
7) and 1.59,
9) respectively. In addition, the apparent absorption coefficient of sample B (
αB) is assumed to be 1000 m
−1.
11) For sample (A), the transmissivity of the entire sample is assumed to be determined by the product between the transmissivities of crystallised and glassy layers, on which assumption the apparent absorption coefficient (
αA) is estimated from
Eqs. (11) or
(11’) based on Lambert-Beer’s law.
|
exp(
-
α
A
d
flux
)
=exp(
-
α
c
d
c
)
×exp(
-
α
g
d
g
)
| (11) |
|
α
A
=
α
c
d
c
+
α
g
d
g
d
flux
| (11’) |
where subscripts “c” and “g” represent crystallised and glassy layers, respectively. The apparent absorption coefficient (
αA) is derived as 521 m
−1 using reported values of
αc (1000 m
−1)
11) and
αg (100 m
−1).
11)
Finally, the apparent thermal conductivity (λflux) including both conductive and radiative contributions is calculated from Eq. (12).
|
λ
flux
=
λ
conductive
+
λ
radiative
| (12) |
Figure 17 compares between measured and calculated apparent thermal conductivities for sample (A) and (B) and shows that there is good agreement between them. It can also be seen that λconductive for sample (B) is roughly the same as for sample (A); meanwhile, the value of λradiative for sample (B) is about a half of that of λradiative for sample (A). As a consequence of this, the apparent thermal conductivity of sample (B) is smaller than that of sample (A). This finding suggests that the reduction in radiative heat flux across the mould flux film contributes to mild cooling by crystallisaiton as well as the formation of an air gap.
3.4.3. Estimation of Thermal Conductivities at Practical Temperature
In the present work, the measurement of apparent thermal conductivity was conducted in the temperature range of 0°C < Tc < 600°C which corresponds to 100°C < T7 < 900°C. Mould fluxes, however, are used at higher temperatures in actual operations where radiative contribution is expected to be greater. In this section, apparent thermal conductivities are calculated for mould fluxes at practical temperature above the present measurement temperature, and thereby radiative contribution to the thermal conductivity is examined.
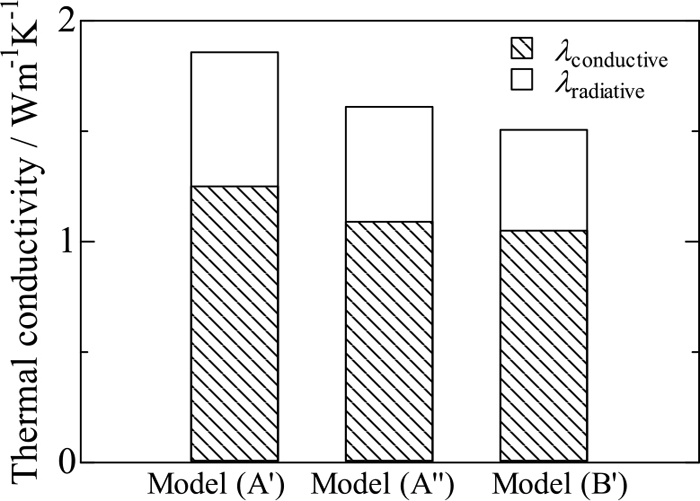
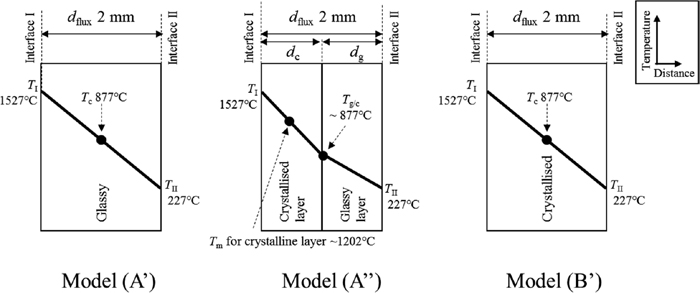
Figure 18 shows schematic diagrams of three types of mould flux model considered here, which are named models (A’), (A”) and (B’). The following assumptions are made:
- Model (A’) is glassy across the entire flux film. Model (A”) consists of glassy and crystallised layers with the same thickness, i.e. dc = dg, similar to sample (A). Model (B’) is crystallised across the entire flux film.
- All the models have the same thicknesses of 2 mm.
- Temperatures (TI and TII) at both surfaces are 1527°C9,10,14) and 227°C,9) respectively.
For these models, values of λconductive and λradiative are estimated as follows.
The value of λconductive of model (A’) is 1.25 Wm−1K−1, irrespective of temperature. For model (A”), Tg/c is estimated to be 877°C assuming linear temperature gradient. Temperature Tm for the crystallised layer of model (A”) is 1202°C. Hence, the value of λconductive-c is estimated to be 0.97 Wm−1K−1 from Fig. 15. In contrast, the value of λconductive-g is 1.25 Wm−1K−1, and thereby the value of λconductive for the entire model (A”) is derived as 1.09 Wm−1K−1 from Eq. (9). In addition, Tc for model (B’) is 877°C, and its value of λconductive is estimated to be 1.05 Wm−1K−1 from Fig. 15.
On the other hand, values of λradiative for models (A’), (A”) and (B’) are estimated from Eq. (10), where radiative heat fluxes are calculated from Eq. (7). The apparent absorption coefficients of models (A’), (A”) and (B’) are assumed to be 100 m−1,11) 550 m−1 and 1000 m−1,11) respectively, where the value for model (A”) has been estimated from Eq. (11) using values of αc = 1000 m−1 and αg = 100 m−1 in the same manner as in 3.4.1. The refractive indices for models (A’), (A”) and (B’) are assumed to be 1.57,7) 1.58 and 1.59,9) respectively. Using these parameters, radiative conductivities for models (A’), (A”) and (B’) are derived as 0.61 Wm−1K−1, 0.52 Wm−1K−1 and 0.46 Wm−1K−1, respectively.
Figure 19 shows the values of λflux consisting of the values of λconductive and λradiative for the three models in the above. Comparison between the values for the three models indicates that the value of λflux is the smallest in model (B’) which has the highest degree of crystallisation. Thus, crystallisation is effective for mild cooling at practical temperature as well. At this temperature, the value of λradiative for model (B’) is the smallest; in addition, the value of λconductive is also the smallest by crystallisation, which is probably due to negative temperature dependence of thermal conductivity for crystalline substance. Thus, also at practical temperature, crystallisation of mould flux would reduce not only radiative but also conductive heat transfer, leading to reduction in the total heat flux across the flux film, apart from the formation of an air gap. On the contrary, there is also a possibility that conductive contribution in glassy flux is reduced to the same level as in crystallised flux at high temperatures. Even in that situation, crystallised flux would be more effective for mild cooling due to less radiative contribution. In addition, it would be unrealistic for glassy mould flux to exist stably at practical temperature such as 1527°C; however, immediately after the mould flux gets into between the mould and the shell to form a film, it is supposed that the film is in such a situation as model (A’) until crystallisation starts. Consequently, mould flux designed to crystallise as shortly as possible would be more effective for mild cooling.