Abstract
Effect of dissolved carbon on the recrystallization texture formation was studied by comparing two electrical steels with the same composition. Both steels have very similar rolling texture. After annealing, the fully recrystallized steel A (0.002 wt% dissolved carbon) showed a stronger Goss intensity and a relatively weaker {111}<112> intensity, as compared to steel B (without dissolved carbon). Detailed analyses indicated that a high Goss intensity already appeared in steel A starting from the early stage of recrystallization. Nevertheless, the {111}<112> intensity of the recrystallized grains exhibited a relatively higher increasing rate in steel B than in steel A in the late stage of recrystallization. The favorable development of {111}<112> grains in steel B is attributed to the enhanced recovery rate.
1. Introduction
The electro-magnetization property of non-oriented electrical steels is strongly influenced by crystallographic texture. Low-carbon steels usually exhibit similar textures after cold rolling regardless their compositions and prior microstructures. In all cases, the cold-rolling textures are mainly concentrated in two families, the partial α-fiber, <110>//RD, which covers from {001}<110> to {111}<110>, and the γ-fiber, <111>//ND.1) The recrystallization textures containing components such as γ-fiber, Goss ({110}<001>) and θ-fiber (<001>//ND), on the other hand, can be very different from one steel to another, which is attributed to the difference in composition and/or the inhomogeneity of cold rolled microstructure.2)
A number of factors affecting the recrystallization of low carbon steel have been studied extensively. For example, the inhomogeneity of cold-rolled microstructure might be affected by the microstructures prior to cold rolling, such as the grain size, precipitation, and segregation of impurities in the steels. Impurities such as carbon and nitrogen in steels have significant effects on the development of recrystallization texture, which determines the magnetic permeability of the electrical steels at high fields.3,4) It is long being recognized that the magnetization is easiest in <100> and hardest in <111> crystallographic directions.5) For non-oriented electrical steels, which are typically applied in rotary machine, in-plane isotropic magnetic properties are important. It is therefore desirable to have fiber texture such as <100>//ND, which would give a uniform and high magnetic flux density. Unlike the formable low carbon or IF steels, the γ-fiber is detrimental for the electrical steels.
It was proposed that the dissolved carbon could play an important role on the microstructure evolution in both cold rolling and recrystallization states. The presence of interstitial carbon could give rise to enhanced shear band formation during rolling. During recrystallization, shear bands are preferential nucleation sites for recrystallization grains, and, therefore, increasing shear bands would cause a weakening of the {111} components which were replaced by widely scattered orientations in recrystallization texture.6) On the other hand, the r-value, or the {111} texture, of low carbon steels was found to decrease significantly by the co-existing of carbon and manganese atoms, and hence the phenomenon was attributed the interaction between carbon and manganese atoms or C–Mn dipole.7) Emren et al.8) suggested that C–Mn dipoles could act as pinning agent to obstruct the dislocation movement, and hindered the recovery prior to the recrystallization process.6,7,8,9)
The objective of this study is to investigate the effect of carbon in ferrite on the formation of recrystallization texture in cold-rolled electrical steel by comparing steels A and B. Steel A contains about 20 ppm carbon in ferrite and steel B is interstitial-free by adding 0.1 wt% Ti. Orientation image mapping (OIM) based on electron backscattered diffraction (EBSD) analysis can provide spatial distribution of crystal orientation over large areas. In this study, partially recrystallized specimens with various recrystallization fractions were analyzed carefully by using EBSD. Quantitative microstructure and texture information were analyzed to reveal the effect of carbon on texture evolution during recrystallization.
2. Experimental
Two silicon-containing electrical steels were used for this study. Steel A contains about 20 ppm carbon in ferrite and steel B is interstitial-free by adding 0.1 wt% Ti. The Ti content is higher than those used in commercially available IF steels to ensure that the TiC particles precipitate at higher temperatures and exhibit larger sizes. The inferior effect of the TiC precipitates on recrystallization can therefore be minimized. The chemical composition of these two steels is shown in Table 1. Both steels were reheated at 1200°C and hot rolled to 12 mm in a reverse mill with the finish temperature of approximately 860°C. The resulting hot bands were annealed at 740°C for 2 hours to ensure the full precipitation of TiC in steel B, which was air-cooled after annealing. On the other hand, steel A was water-cooled to room temperature in order to avoid any possible precipitation. To confirm the dissolved carbon content in both steels, the internal friction test was performed (Sinku-Riko IFM-1500M/L-S) at a frequency of 1 Hz. As shown in Fig. 1, it is clear that no distinguished Snoek peak appears in the curve of steel B, but an apparent peak in the curve of steel A, indicating considerable interstitial atoms (C and/or N) dissolved in steel A but not in steel B. The optical micrographs (OMs) of the annealed hot bands are shown in Fig. 2(a). The average grain size of steel A and steel B are 48 μm and 58 μm, respectively. Figure 2(b) shows the φ2=45° section of the orientation distribution function (ODF) of the annealed hot band for both steels. In general, both materials show similar features, consisting of partial α-fiber, partial γ-fiber and rotated cube. After annealing, the hot bands were pickled and ground on both side to 10 mm thick, and subsequently cold rolled (CR) to 70% reduction. Final annealing of the cold-rolled samples was carried out in an infrared vacuum furnace. The specimen was heated at a rate of 3°C/s to the desired annealing temperature (500–850°C) and hold for 60 s.
Table 1. Chemical composition of steels (wt%).
| Steel | C | S | N | Si | Mn | P | Al | Ti |
|---|
| Steel A | 0.0015 | 0.0050 | 0.0021 | 0.86 | 0.31 | 0.005 | 0.217 | 0.006 |
| Steel B | 0.0014 | 0.0050 | 0.0012 | 0.89 | 0.33 | 0.005 | 0.185 | 0.118 |


Texture measurements were conducted by using a Bruker D8 Discovery X-ray diffractometer with Co-Kα radiation. Three pole figures, (200), (110), and (211), were collected. The orientation distribution functions (ODFs) were calculated from the measured pole figures utilizing TexEval software. The plane perpendicular to the transverse direction (TD) of the specimens were carefully ground and polished. Vickers hardness measurement was carried out to determine the recrystallization temperature of the steels. The microtexture was measured by using EBSD. All the EBSD analyses were performed on TD plane of the specimens on a scanning electron microscope (Zeiss Supra 55 FEG-SEM, 20 kV) equipped with an Oxford Nordlys detector and Aztec HKL software. A step size of 0.25 μm was used for EBSD analysis. For each specimen, 4–6 maps of an area of 40000 μm2 or larger were analyzed. The criteria for defining RX (recrystallized) grains used in this study consist of:
(1) A grain is an area surrounded by boundary having misorientation angle of at least 5°.
(2) A grain, which has internal misorientation less than 1° within the grain interior, is considered as a RX grain.
(3) Considering the step size used in the present EBSD analysis, a minimum size of 3 μm was also adopted for positive identification of a RX grain.
3. Results
3.1. Recrystallization Kinetics and Texture
Figure 3 shows the variation of hardness and average RX fraction, determined using the EBSD technique, versus annealing temperature. Both steels show the same hardness value in the as-rolled state and exhibit a small reduction in hardness (~10%) after annealing at 590°C. The hardness curve of steel A shows a dramatic decrease after annealing at temperatures above 590°C. EBSD analysis confirms that 2% of sampling area has recrystallized for steel A annealed at 610°C, while steel B exhibits merely 0.2% RX after annealing at 660°C. Accordingly, the hardness of steel B drops additional 10% prior to the onset of recrystallization as compared to that of steel A. This indicates that steel B requires longer time to recover before the commencement of recrystallization as compared to steel A. The temperatures for complete recrystallization for steel A and steel B are thus different (710°C for steel A and 750°C for steel B). In the following text, the cold rolled specimens are denoted as A-CR and B-CR, and the annealed specimens are denoted as A-T or B-T, where T is the annealing temperature.

Figure 4 shows the φ2=45° ODF sections of the CR and RX states for both steels. They show little difference in the CR texture, which exhibits high intensity of the partial α-fiber and moderate γ-fiber components. However, the difference in the recrystallization texture between steel A and B is evident. The {111}<112> intensity is stronger in the texture of B-750 than in A-710. On the other hand, steel A has a weak Goss component in the recrystallization texture, while steel B does not.
3.2. Quantitative Assessment of Microstructure and Texture Evolutions
To directly track the recrystallization texture evolution during recrystallization, the recrystallized (RX) grains were separated from the deformed structure in the partially recrystallized specimens in the EBSD analyses. The microstructural characteristics of the RX grains of different texture component at each stage of recrystallization were examined. The microstructural characteristics analyzed include area fraction, grain size and number density of recrystallized grains. Because these two steels have different recrystallization kinetics, they are recrystallized at different temperature. Therefore, the comparison of microstructure and texture will be made on the base of RX fraction instead of annealing temperature.
Based on the EBSD analyses, quantitative assessment of the evolution of major recrystallization texture components in recrystallization is presented in Fig. 5. The texture components concerned here include {111}<112>, {111}<110>, cube and Goss. In the calculation, grains having an orientation within 15° deviation angle from the ideal orientation are included in this texture component. The average area fractions of the RX grains of the four texture components are presented as a function of the recrystallization fraction in Fig. 5. The results revealed in Fig. 5 can be summarized as follows:
(1) The area fractions of the {111}<112> and {111}<110> components in both steels are similar for recrystallization fraction<50%. However the area fraction of {111}<112> in steel B exhibits an significant increase at late stage of recrystallization (>80%).
(2) The area fraction of Goss shows steady increase in steel A. Throughout the recrystallization process, the area fraction of Goss in steel B is relatively low as compared to that of steel A.
(3) Both steels have similar area fraction of cube grains throughout the entire recrystallization process.
(4) In general, both steels exhibit the similar trend of area fraction increasing rate (
R
˙
{hkl}<uvw>
) for these four texture components during recrystallization, that is
R
˙
Goss
≈
R
˙
cube
<
R
˙
{111}<110>
≈
R
˙
{111}<112>
.
Figure 6(a) shows the average grain size of RX grains versus recrystallization fraction. It is interesting to note that no distinguishable difference in grain size for both steels at the same recrystallization fraction, despite different annealing temperatures used for each steel. Figures 6(b) and 6(c) reveal the grain size evolution for different orientations during recrystallization. Similarly, no significant difference could be found regarding the steel composition or the grain orientation, implying that no grains of a specific component could have a size advantage over other texture components during the recrystallization process. The influence of orientation growth in recrystallization of these two steels can be ignored accordingly.

The number fractions of recrystallized grains with the four major texture components are presented as a function of recrystallization fraction in Fig. 7. During the process of recrystallization, one may assume that the number fraction of RX grains for each orientation category may be related to the relative density of the nucleation sites available in the deformed matrix. Therefore, the Goss grains in steel A have a large number fraction (~13%) in the beginning of recrystallization, suggesting that there should be large number of potential recrystallization nuclei (PRN) with Goss orientation in the deformed structure of steel A. On further progress of recrystallization, the number fraction of the Goss grains in steel A decreases dramatically to about 5%, which is still higher than the value of less than 3% for steel B. The number fractions of the cube and {111}<110> grains show little difference between these two steels throughout the recrystallization process. However, the evolution of {111}<112> grains exhibits different trend for these two steels at latter stage of recrystallization (>40%), which increases at a higher rate in steel B than in steel A does.

Figure 8(a) shows variation of the number of RX grains developed in unit area of the annealed sample as recrystallization proceeds. Generally speaking, the number of RX grains increases as the recrystallization proceeds until about 40% recrystallization, and it saturates at 40–80% recrystallization and then decreases slightly until full recrystallization. However, the most significant feature in Fig. 8(b) is that the number density of {111}<112> grains in steel B keep increasing during the period of 40–80% recrystallization. The above statistical results of the number density of RX grains show three important features.
(1) The number fraction of Goss grains in steel A is higher than that in steel B.
(2) The number fractions of {111}<110> and cube grains are similar for both steels throughout recrystallization.
(3) In steel B, the number of {111}<112> grains still maintains a significant increasing trend during 40–80% recrystallization.
4. Discussion
Based upon the experimental results and the mechanisms proposed in the literature, one may attribute the effect of dissolved carbon on the recrystallization texture to three possible causes.
(1) The higher recrystallization temperature for steel B;
(2) Enhanced recovery in steel B prior to recrystallization. It is a result of the absence of dissolved carbon in steel B which can facilitate dislocation movement;
(3) Different distribution of inhomogenities in deformed structure in steel B as compared with that in steel A.
The first two causes are interrelated, which affect the recrystallization kinetics in steels containing different amount of dissolved carbon in ferrite during annealing. By using the same heating rate, the higher recrystallization temperature for steel B means a longer thermal exposure time before reaching the recrystallization temperature as compared to steel A. This could give us a hint that the longer time recovery prior to the onset of recrystallization might facilitate a strong {111}<112> texture developed in steel B during recrystallization process. Similar results have been reported for low-carbon and IF steels.6,10) Accordingly, the higher recrystallization temperature of steel B should be a result of the combination effect of solute and precipitation drag on cell and grain boundaries.10,11) The third cause implies that the effect of dissolved carbon on recrystallization texture is a consequence of its influence on the deformed structure, which determines the recrystallization texture.
In the present study, the main differences in the recrystallization texture for these two steels are:
(1) A higher Goss intensity in steel A, which is mainly formed in the early stage of recrystallization;
(2) A higher intensity of {111}<112> in steel B, which only becomes evident in the late stage of recrystallization.
Apparently, these two characteristic differences in recrystallization texture evolution must be due to different causes. It is interesting to understand the stage of the annealing process at which dissolved carbon atoms are influential in changing the texture.
4.1. Higher Goss Intensity in the Recrystallization Texture of Steel A
The experimental results of recrystallization texture evolution in steel A indicate that RX grains of Goss orientation are mainly formed in the early stage of recrystallization. The stronger Goss texture of steel A after recrystallization might be attributed to a higher population of PRN of Goss orientation in the deformed state. The high population of PRN having Goss orientation in steel A should be related to the influence of interstitial carbon on dislocation motion and dynamic recovery during cold rolling. After cold rolling, solute carbon atoms are expected to segregate to dislocations; this will inhibit recovery in the early stages of annealing. Since the mobility of carbon atoms is so high at the annealing temperatures involved, they are expected to have only a negligibly direct effect on the movement of dislocations, subboundaries, and grain boundaries.
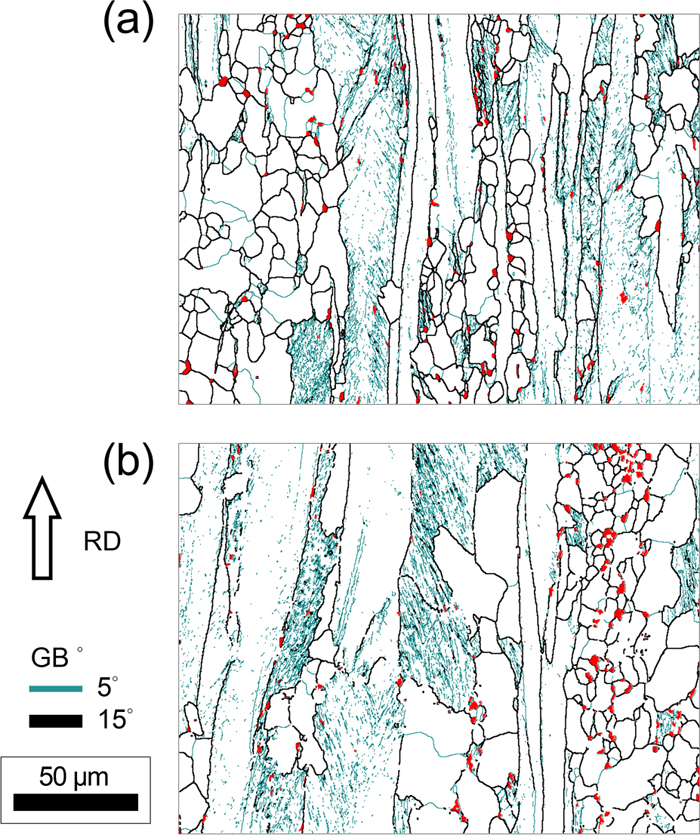
Steels with high solute C contents are prone to dynamic strain aging and shear banding during cold rolling.12,13) It has long been recognized that the presence of interstitial carbon in ferrite enhances the formation of shear bands during rolling. The shear bands are frequently the preferential nucleation sites in recrystallization. In cold-rolled steel, the major texture components are α-fiber and γ-fiber, and crystallites of Goss orientation are often found in shear bands formed in γ-fiber grains. An example is given in Fig. 9, which shows the EBSD texture components and boundary maps of steel A after cold rolling and with 17% RX, respectively. At the cold-rolled stage, it is evident that shear bands are present in the deformed {111}<112> grains as indicated by arrows in Fig. 9(a). A displacement of the high-angle grain boundary as large as 10 μm can be found. In Fig. 9(b), a Goss RX grain (see arrow) which appears in the shear band having the highest localized deformation is observed. Hence, high density of shear bands in cold-rolled steel often results in a reduced γ-fiber and enhanced Goss in recrystallization texture.6,12,14)

Despite the different Goss intensity, the ODF of RX grains in partially recrystallized states of both steels exhibit similar characteristic feature until about 40% recrystallization, which is close to the saturation of recrystallization nucleation. The difference in the orientation intensity of {111}<112> between these two steels only becomes more evident after 40% recrystallization. Similar observation has been reported by other authors.10) Therefore, the difference of {111}<112> intensity in the recrystallization texture could not be directly attributed to a difference in PRN sites available in the cold rolled sample. It must be related to the mechanisms governing the microstructure evolution operated in the late stage of recrystallization.
We examined the samples having 40% recrystallization. It was noticed that there were numerous grains, which fulfilled the misorientation criterion of RX grain but were smaller than 3 μm in size, which were not considered as RX grains because of the criterion adopted here. In other words, they are too small to be treated as “successfully grown” RX grains. However, these grains still have a great chance to grow on subsequent annealing. Figure 10 shows that steel B has a much higher number density of the “small RX grains” (240 μm−2) than steel A does (153 μm−2). Among them, the number density of the “small RX grains” having the {111}<112> orientation in steel B is 85% higher than that of steel A (37 μm−2 vs. 20 μm−2). The number densities of Goss and cube grains are, nevertheless, nearly the same for both steels. As a summary, the high number densities of “small RX grains” having {111}<112> orientation in steel B of 40% recrystallization might provide a clue to the reason why the intensity of {111}<112> orientation in RX grains keep increasing considerably after 40% recrystallization. The high number density of the small RX grains observed in steel B may be the result of a long annealing time the sample experienced in isochronal annealing, since steel B has a higher recrystallization temperature (Fig. 3). As shown in Fig. 10, many small RX grains in steel A are surrounded all by large RX grains and are expected to be coalesced by their neighbors. On the other hand, the small RX grains in steel B tend to aggregate with each other and also with the RX grains which are only slightly larger than them. A certain fraction of these small RX grains therefore have chances to grow on the subsequent annealing. In addition, the coalescence of subgrains may be responsible for the formation of the small RX grains in steel B after a long-time annealing. The coalescence results in a relative rotation of the two subgrains and the resultant RX grain can have a larger misorientation to its neighbors in addition to its size advantage. These small RX grains mostly form in the deformed γ-fiber grains and therefore have a high probability of being the {111}<112> orientation. The higher number density of the small {111}<112> nuclei in steel B, as compared to that in steel A, is therefore the main reason causing the increase of the intensity of {111}<112> orientation in RX grains.
5. Conclusion
In this study, the effect of dissolved carbon on the formation of recrystallization texture was investigated by comparing, containing 20 ppm dissolved carbon, and steel B in which 0.1 wt% Ti is added to ensure that all carbon atoms are precipitated as carbides. Partially recrystallized specimens with various recrystallization fractions were analyzed by EBSD. The conclusions have been drawn as follow.
(1) The cold-rolled macrotextures of steels A and B are the very similar, but the recrystallization textures are different. The fully recrystallized A-710 sample shows a stronger Goss texture and a weaker {111}<112> one, as compared to those of B-750.
(2) There is no distinguishable difference in grain size for both steels at the same recrystallization fraction. Similarly, no significant difference could be found regarding the steel composition or the grain orientation if the grains size is compared at the same recrystallization fraction. These results imply that the influence of orientation growth in recrystallization of these two steels can be ignored accordingly.
(3) With no discrimination in grain sizes, the area and number fractions show the same trend with the recrystallization fraction. The area fraction of the {111}<112> and {111}<110> components in both steels are similar for the recrystallization fraction is less than 50%, however the fraction of {111}<112> in steel B exhibits an significant increase at late stage of recrystallization (>80%). The fraction of Goss shows steady increase in steel A. Throughout the recrystallization process, the area fraction of Goss in steel B is relatively low as compared to that of steel A. Both steels have similar area fraction of cube grains throughout the entire recrystallization process.
(4) Dissolved carbon in ferrite promotes the formation of Goss shear bands in rolling. A higher number of Goss nuclei are therefore formed at shear bands on recrystallization. The removal of carbon atoms from the ferrite lattice results in a higher recrystallization temperature which allows a high degree of recovery. The formation of high number density of the {111}<112> RX grains correlates with the higher degree of recovery in steel B.
Acknowledgement
The NSYSU team acknowledges China Steel Corporation for supporting this research under grant RE102030.
References
- 1) D. Schläfer and H. J. Bunge: Texture, 1 (1974), 157.
- 2) M. Hölsche, D. Raabe and K. Lücke: Steel Res., 62 (1991), 567.
- 3) L. Kestens and S. Jacobs: Texture Stress Microstruct., 2008 (2008), Article ID 173083, 1.
- 4) K. Verbeken, E. Gomes, J. Schneider and Y. Houbaert: Solid State Phenom., 160 (2010), 189.
- 5) K. Honda and S. Kaya: Sci. Rep. Tohoku Univ., 15 (1926), 721.
- 6) K. Ushioda, U. von Schlippenbach and W. B. Hutchinson: Texture Microstruct., 7 (1987), 11.
- 7) H. Abe, T. Suzuki and S. Okada: Tetsu-to-Hagané, 69 (1983), S1415.
- 8) F. Emren, U. von Schlippenbach and K. Lücke: Acta Metall., 34 (1986), 2105.
- 9) K. Osawa, T. Suzuki, K. Matsudo and K. Kurihara: Tetsu-to-Hagané, 72 (1986), 1728.
- 10) J. L. Bocos, E. Novillo, M. M. Petite, A. Iza-Mendia and I. Gutierrez: Metall. Mater. Trans. A, 34 (2003), 827.
- 11) K. Mukunthan and E. B. Hawbolt: Metall. Mater. Trans. A, 27 (1996), 3410.
- 12) T. Haratani, W. B. Hutchinson, I. L. Dillamore and P. Bate: Met. Sci., 18 (1984), 57.
- 13) M. D. Nave, M. R. Barnett and H. Beladi: ISIJ Int., 44 (2004), 1072.
- 14) W. B. Hutchinson: Mater. Sci. Forum, 157–162 (1994), 1917.


