Abstract
In the field of ironmaking, there are few in situ non-destructive techniques for systematically evaluating the reduction behaviors of blast furnace (BF) burden materials. The standard method for the evaluation of the reduction disintegration index (RDI) includes low temperature reduction with a constant gas composition at a constant temperature followed by a cold strength test after cooling. During the reduction of iron ore burden in the BF, reduction disintegration proceeds in the course of increasing temperature through crack generation and propagation caused by volume expansion due to the reduction from hematite to magnetite. Acoustic emission (AE) method is an in situ non-destructive technique to evaluate the crack generation and propagation phenomena in various fields. In this study, we first attempted to apply AE method for a detailed in situ observation of BF burden materials by a combinational experiment of reduction disintegration. In the case of single-particle reduction, it was possible to detect AEs without friction between the sample and the waveguide giving rise to noise. Although a large number of AEs were measured during cooling of both sinter and pellet, the AE energy of the sinter was larger than that of the pellet. Furthermore, a significant number of AEs were also detected during heating of lump ore containing larger amount of combined water indicating possibility to evaluate the decrepitation behavior of such ores.
By the packed bed reduction tests, which could evaluate average properties of iron ore burden, it was found that the AE energy attributed to thermal stress observed during cooling was higher than that to reduction degradation. These results suggest that it will be possible to eliminate the influence of crack generation within the iron ore burdens in the cooling stage by applying the in-situ non-destructive evaluation method developed in this study. It is also expected to apply for the quantitative estimation of the reduction disintegration behavior of burdens in the working BF.
1. Introduction
During the low temperature reduction of iron ore burden in the blast furnace (BF), disintegration proceeds due to crack formation caused by volume expansion through the reduction of hematite to magnetite.1) The iron burden also receives a series of impacts during descending in the BF.2) In contrast, the standard method, e.g. ISO 4694-2, for the evaluation of the reduction disintegration index (RDI) is consisted of low temperature reduction with a constant gas composition at a constant temperature followed by a cold strength test after cooling. Hence, there seems to be a significant difference between above two conditions.
From such viewpoints, we applied alternative tests with the addition of impacts and/or loads to the samples during reduction. The Linder test is well known as a hot tumbling test during reduction.3) Jomoto et al. suggested a reduction test with the application of load analogized in the shaft region of the BF.4) Machida et al. developed a simulator with compression and agitation functions for estimating sinter degradation in the BF.5) However, each of these methods involves a cooling process, and it is not possible to evaluate crack generation during cooling by thermal stress. Therefore, it is necessary to establish an in situ evaluation method to clarify the mechanism underlying the reduction disintegration behavior under high H2 conditions. A few studies have reported the in situ observation of the reduction of iron oxide. Kim et al. investigated the crack formation behavior of a sinter during reduction by using synchrotron X-rays,6) although it was difficult to observe cracks and pores in particles smaller than 100 μm. In addition, the use of a laser microscope7) is not suitable to detect inner cracks. Furthermore, it is difficult to evaluate the crack formation and propagation behavior of bulk samples of actual sinters, pellets, and lump ores, which show large variations in quality, by X-ray and/or laser microscopy methods.
On the other hand, the Japanese steel industry is responsible for approximately 14% of the total anthropogenic CO2 emissions8) and the BF ironmaking process accounts for 70% of this value.9) For reducing such emissions, attempts have been made to decrease the reducing agents rate (RAR) and to apply the utilization technologies of H2.10,11,12,13,14,15,16,17) However, the furnace temperature decreases due to the decreasing supply of thermal energy per unit production in the former case and an increased endothermic reaction in the latter case. Both tend to promote the reduction disintegration of sinters, pellets, and lumpy ores by expanding the low-temperature region at around 550°C and it leads to decrease the permeability of the upper part of BF through decreases in particle size and bulk density, resulting in a decrease in productivity. However, disintegration behavior of iron ore agglomerates during H2 reduction has not been well understood, although there are numerous studies on CO reduction.1,2,18) Therefore, there is still some debate about the influence of H2 on the reduction disintegration behavior. The authors previously reported that the reduction disintegration behavior under high H2 atmosphere strongly depends on the reaction mode induced by the reduction conditions, and evaluated the relationship between fine generation and calculated crack area during the reduction of sinters and pellets.19) However, there is a difference in the reduction conditions between the BF and laboratory tests. The fine generation behavior of lump ores in the actual furnace is affected by thermal decrepitation as well as reduction disintegration behavior.20,21,22) Nevertheless, there are few reports on the quantitative evaluation of the effects of decrepitation and reduction disintegration under a H2 atmosphere.
Recently, the acoustic emission (AE) method has been applied to analyze the crack formation and fracture process in many kinds of materials in the laboratory.23,24,25,26) AE refers to the radiation of elastic waves in solids that occur with crack formation and propagation. The AE method is a unique nondestructive tool in that it detects the crack and defect growth in real time. The AE technology was first introduced in the 1950’s, following which many studies have been performed. In recent years, the remarkable improvement in computer performance, in terms of processing speed and data storage, has triggered the development of analytical software with various processing abilities. Thus, analysis that was previously considered difficult can be performed in a short time, and hence, AE is attracting attention as a useful measurement technique. Furthermore, with the improvement of measurement technology, the AE method has been extended to applied fields that have not existed before.26) This has motivated us to perform in situ evaluation of the disintegration behavior of iron ore burden during reduction by using the AE method.
2. Experimental Procedure
Figure 1 shows a schematic of the apparatus for the reduction furnace with the AE measurement system. This furnace has an AE sensor, AE measurement system and computer system for data acquisition and analysis, in addition to the general electrical furnace. In general, it is necessary to attach the sensor directly to the sample during the measurement of AE.23) However, the Curie temperature (TC) of the piezoelectric element of lead zirconate titanate (PZT) of the AE sensor is approximately 350°C, and the function of the AE sensor is lost at a temperature higher than one-half of TC. Thus, an alumina round bar was used as the waveguide to transmit the AE signals.27)

The combinational experiment of reduction disintegration test according to ISO4969-2 and AE measurement was conducted. The chemical compositions of the samples used in this study are listed in Table 1. The samples were two types of iron ore sinters with different compositions, three types of pellets with different basicities, and two types of lump ores with high and low combined water contents.
Table 1. Chemical composition of samples.
| Sample | T.Fe (mass%) | FeO (mass%) | SiO2 (mass%) | Al2O3 (mass%) | CaO (mass%) | MgO (mass%) | CW (mass%) | C/S (−) |
|---|
| Sinter A | 57.62 | 8.74 | 5.41 | 1.60 | 10.39 | 1.01 | – | 1.92 |
| Sinter B | 58.01 | 6.08 | 5.23 | 1.82 | 9.36 | 0.93 | – | 1.96 |
| Pellet A | 63.88 | 1.62 | 6.43 | 0.38 | 0.48 | 0.66 | – | 0.07 |
| Pellet B | 63.39 | 0.57 | 3.45 | 0.39 | 1.10 | 1.15 | – | 0.32 |
| Pellet C | 65.93 | 0.66 | 2.36 | 0.54 | 2.62 | 0.01 | – | 1.11 |
| Lump A | 57.37 | 0.10 | 4.54 | 2.52 | 0.30 | 0.04 | 10.23 | 0.07 |
| Lump B | 61.17 | 0.18 | 8.62 | 2.73 | 0.10 | 0.03 | 0.43 | 0.01 |
The samples were sieved to be grain sizes ranging between 10.0 and 15.0 mm before reduction. In this experiment, AE measurements with reduction of single particles and packed beds with a total weight of 500 ± 1 g were carried out. In order to improve the contact between the waveguide and the sample, the upper and lower surfaces of the sample were polished so that the height of the sample was 10 mm for reduction tests of single particles. In the case of packed beds, samples were randomly chosen and charged in the electrical furnace so that the bulk density of the sinter, pellet, lump A, and lump B was at least 1750, 2000, 1750, and 2750 kg/m3, respectively.
The sample was heated to 823 K in a N2 gas stream at a flow rate of 15 NL/min and kept at this temperature for 10 min. The gas was then changed to a CO/CO2/H2/N2 mixture with the same flow rate, and the reduction experiment was carried out for 30 min. After that, gas was changed again to N2 and cooled below 373 K.
At the same time, the AE was measured to evaluate the relationship between reduction disintegration behavior and AE generation behavior. AE waveforms were detected using the AE sensor attached to the waveguide. As a hit definition of AE, a threshold amplitude of 40 dB (77.5 V), rearm time of 400 μs, and duration discrete time of 200 μs were set. The frequency spectra were acquired by fast Fourier transform (FFT). The window function and averaging method were adopted with hamming and root mean square (RMS), respectively. Characteristic AE parameters such as number of counts C, duration time td, amplitude A, AE energy E, and center of gravity (CoG) of frequency F,28) as shown in Fig. 2, were recorded by the AE measurement system. The AE energy is the peak area in the frequency spectrum. The CoG of frequency is correlated with the matrix properties, and the AE energy is correlated with the crack area.

In the case of reduction of packed beds, disintegration tests were conducted for the reduced samples on the basis of ISO 4696-2 using a tumbling drum with an inner diameter of 130 mm at a rotation speed of 30 rpm for 30 min. The sample was then sieved using a 3 mm mesh to determine the proportion of the sample with particle sizes greater than 3 mm. The RDI was then calculated using the following equation:
|
RDI=(
1-
m
1
m
0
)
×100
| (1) |
where,
m0 is the weight of the sample after the reduction experiment and
m1 is the weight of the particles larger than 3 mm.
3. Results and Discussion
3.1. Reduction Test with AE Measurement for a Single Sample
Figure 3 shows examples of the AE measurement results obtained during the reduction of each single sample at 773 K, for 3.6 ks with CO gas. Since AE was hardly detected in the blank test, it was confirmed that AE corresponding to noise due to vibration and friction was not detected in this test system. In addition, AE was measured during the low-temperature reduction of the sinter, pellet and lump ores, but the frequency bands were different: sinter, 50–120 kHz; pellet, 80–140 kHz; lump ore A, 75–100 kHz; and lump ore B, 80–120 kHz. On the other hand, a large number of AEs were measured during the cooling of the sinter, and the AE energy of the sinter was higher than that of the pellet. Furthermore, a large number of AEs were detected at the time of the temperature rising of lump ore A with high combined water, and its frequency band at 70–120 kHz was higher than that detected during reduction. It is generally known that iron hydroxide in lump ores is decomposed during heating, and the generated water vapor acts as the force necessary for breaking, which is interpreted as a cause of thermal decrepitation of the lump ore. Thus, it is known that high-density lump ores with high combined water have a high decrepitation index.20,22) The test result indicated that this method can be applied not only to the evaluation of iron ore burden for reduction disintegration, but also for the evaluation of thermal decrepitation.

In the field of fracture mechanics, a similarity rule (fractal) is established for the development of large and small cracks in substances during destruction.29) Fractals have also been confirmed in general crack generation behavior associated with earthquakes, and there are many reports on the fracture mechanisms and fractal properties of crack generation.30,31,32) A correlation exists between the fractal properties of crack distribution during rock breaking and the amplitude distribution of AE.33) From these observations, the amplitude distribution of AE can be expressed by the power-law expression in the following equations:
|
log
10
(
A
)
=-m
log
10
A+
log
10
C
| (3) |
where, A is the amplitude (V) of AE,
m is the fractal dimension (−), and C is the coefficient.
In the double logarithmic graph, a linear relationship of the slope m is obtained, as in Eq. (3), and higher fractal dimensions imply a wider crack size wider distribution. The fractal dimension is known to increase with high strength and non-uniform materials.35)
Figure 4 shows the AE wave amplitude distribution represented by the double logarithmic graph. This test also revealed a linear relationship for the logarithm of the amplitude distribution. These results suggested that cracks caused by the low-temperature reduction of sinters and pellets have fractal properties similar to those of AE.

Figure 5 shows the AE energy and fractal dimension of the sinters, pellets, and lump ores during CO and H2 reduction. The AE generated in the sinters during reduction had a lower fractal dimension and higher energy than that generated in the pellets. Coarse cracks are known to tend to generate AE with low fractal dimensions and high energy. In addition, the AE generated in the sinters and pellets with H2 reduction had higher energy and fractal dimension than did that with CO reduction. This suggested the generation and propagation of many large and small cracks with different sizes during H2 reduction. In a previous study, structural observations of sinters and pellets18) revealed that the amount of cracks generated during H2 reduction was larger than that during CO reduction, and that the crack shape was more complex. A similar trend was observed for the crack generation behavior by analogy to the AE generation behavior. Thus, it was suggested that the crack generation mechanism in iron ore agglomerate with low-temperature reduction can be inferred by AE measurements. The fractal dimension of lump B with a low porosity of approximately 10% was the lowest among all the samples used in this study. Since the number and volume of pores suppressing the crack propagation are small in lump B, it is estimated that coarse cracks were easily generated and that the fractal dimension was low.

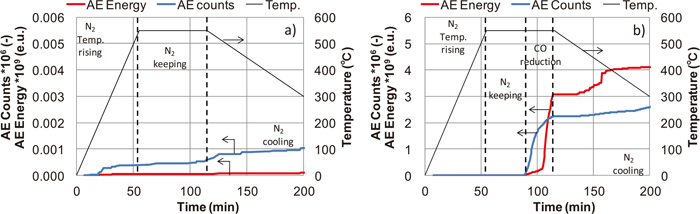
Figure 6 shows the trends of AE counts, C, and AE energy, E , during the reduction disintegration tests. In the case of N2 keeping (Fig. 6(a)), fewer AEs than 100 were detected, with low energy values. Conversely, in the case of CO reduction (Fig. 6(b)), many AEs were detected when switching from N2 gas to CO gas at 550°C, and the AE energy was more than 100 times higher than that in the case of N2 keeping. Large numbers of AEs were also detected during the cooling process after CO reduction.
Figure 7 shows examples of the AE frequency spectrum generated during CO reduction (Fig. 7(a)) and during N2 cooling after reduction (Fig. 7(b)). It was observed that AEs having a frequency band of about 100 kHz were generated when the iron ore agglomerates were reduced. On the contrary, AEs with frequencies lower than 60 kHz AEs were detected after reduction.

An example of the measurement result of the CoG of frequency of AE generated during the test is shown in Fig. 8. Three types of AEs having frequency bands in the range 65–95 kHz, higher than 95 kHz, and less than 65 kHz were detected. Since AE in the 65–95 kHz frequency band was detected throughout the experiment, it was estimated that this AE is caused by friction between the sample and the waveguide due to thermal expansion (friction AE). The main AE higher than 95 kHz generated during reduction is defined as “reduction degradation AE” due to volume expansion of the phase caused by the reduction from hematite to magnetite. On the other hand, it is presumed that AE with low frequency in the cooling stage is due to crack formation caused by the thermal stress during cooling (thermal stress AE).

The different frequency bands of AE during reduction and cooling can be attributed to the difference in the crack generation mode. Otsu et al. classified the fracture mode by using the average frequency and the RA value, which is the ratio of the rise time and the maximum amplitude, and reported that the tensile crack is of high frequency and the shear crack is of low frequency.33) This suggests that tensile cracks are generated by volume expansion during reduction and shear cracks are generated by volume shrinkage during cooling.
Figure 9 shows the relation between the AE energy of the reduction degree and thermal stress. Thermal stress is a phenomenon peculiar to laboratory tests and is presumed to not occur for reduction disintegration in the actual furnace, although its energy is higher than that of reduction degradation. In addition, the ratio of the AE energy of thermal stress in the sinters is higher than that in the pellets. These results suggest that the conventional RDI, which measures the strength of the reduced sample after cooling, is affected by crack formation and propagation during cooling.

Figure 10 shows the relation between the RDI values of the iron ore sinter and pellet, and the sum of the AE energy due to reaction degradation and thermal stress. It can be confirmed that the increase in AE energy increases the RDI. These results suggest that our developed in-situ evaluation method can be used to quantitatively evaluate the reduction disintegration behavior in accordance with the BF, excluding the influence of cracks generated during the cooling process.
The above results reveal that the AE associated with the friction between the sample and the waveguide corresponding to noise can minimize in single-particle reduction; thus, this method is superior in improving the analysis accuracy of AE and the mechanism elucidation of reduction disintegration. On the other hand, there is a large variation in the quality of sinter and pellets used in BFs. For this reason, reduction tests on packed beds, which can deduce the average sinter properties, are also important.
4. Conclusion
In this study, an in situ AE method was applied to the evaluation of crack generation and propagation behavior of iron ore burden during low-temperature reduction. A large number of AEs was detected during the reduction of iron ore burden by propagating it using a waveguide. The in situ AE method is expected to be useful for elucidating the mechanism underlying the reduction disintegration behavior of sinters and pellets under a high H2 atmosphere. Furthermore, it was identified that the characteristic AE parameter quantitatively reflected the reduction disintegration behavior. The results are summarized as follows:
(1) In single-particle reduction, it was possible to detect the AEs without noise corresponding to the friction between the sample and the waveguide. A large number of AEs, which is considered to be caused of the thermal stress were measured in the course of cooling of the sinter. And that AE energy of the sinter was higher than that of the pellet.
(2) A large number of AEs were detected at the time of temperature rising of the lump ore containing high combined water. This result indicates that our method can be applied for the evaluation of the decrepitation of lump ore.
(3) It was revealed that the AE generated during the low-temperature reduction of sinters, pellets, and lump ores had fractal properties. The sinters and lump ores had a lower fractal dimension than the pellets, and the sinter with lower fractal dimension produced more coarse cracks than did the pellets. Furthermore, the fractal dimension and AE energy with H2 reduction were higher than those with CO, and these results reflected the difference in crack generation and propagation behaviors with H2 and CO reduction.
(4) In the packed bed test, AEs due to friction, reduction degradation, and thermal stress were detected individually in response to their frequency bands. And the frequency band of the AE for the sinter during reduction was lower than that for the pellet. From this viewpoint, the disintegration behavior at each stage of reduction and cooling can be quantified by frequency analysis.
(5) The AE energy due to reaction deterioration and thermal stress was correlated with the RDI values. These results suggest that it will be possible to exclude the influence of cracks generation in the reduced iron ore sinter, pellet and lump ore during cooling stage by applying the in situ evaluation method developed in this study. It is also expected to apply for the quantitatively evaluation of the reduction disintegration behavior of burdens in the working BF.
References
- 1) T. Inazumi, K. Shinada and M. Kawabe: Tetsu-to-Hagané, 68 (1982), 2207.
- 2) Y. Iwanaga: Tetsu-to-Hagané, 68 (1982), 740.
- 3) R. Linder: J. Iron Steel Inst., 189 (1958), No. 7, 233.
- 4) Y. Jomoto, Y. Kanayama, Y. Okuno and M. Isoyama: Tetsu-to-Hagané, 57 (1971), 1606.
- 5) S. Machida, K. Yoshida, Y. Sawa, M. Sato and N. Ishiwata: CAMP-ISIJ, 26 (2013), 201, CD-ROM.
- 6) J. R. Kim, J. H. Je and S. K. Jeong: Iron and Steel Society Int. Technology Conf. (ISSTech 2003), Iron and Steel Society, Warrendale, PA, (2003), 175.
- 7) Y. Kashiwaya, Y. Yamaguchi, H. Kinoshita and K. Ishii: ISIJ Int., 47 (2007), 226.
- 8) Greenhouse Gas Inventory Office of Japan, The GHG Emissions Data of Japan (2015-4-23), http://www-gio.nies.go.jp/aboutghg/nir/nir-j.html, (accessed 2017-09-21).
- 9) M. Sato, T. Yamamoto and M. Sakurai: JFE Tech. Rep., 19 (2014), 103.
- 10) T. Miwa and H. Okuda: J. Jpn. Inst. Energy, 89 (2010), 28.
- 11) T. Akiyama, H. Sato, A. Muramatsu and J. Yagi: ISIJ Int., 33 (1993), 1136.
- 12) H. Nogami, Y. Kashiwaya and D. Yamada: ISIJ Int., 52 (2012), 1523.
- 13) T. Murakami, Y. Kamiya, T. Kodaira and E. Kasai: ISIJ Int., 52 (2012), 1447.
- 14) T. Murakami, T. Kodaira and E. Kasai: ISIJ Int., 55 (2015), 1181.
- 15) T. Murakami, T. Kodaira and E. Kasai: ISIJ Int., 55 (2015), 1197.
- 16) N. Takeuchi, Y. Iwami, T. Higuchi, K. Nushiro, N. Oyama and M. Sato: Tetsu-to-Hagané, 99 (2013), 448.
- 17) S. Watakabe, K. Miyagawa, S. Matsuzaki, T. Inada, Y. Tomita, K. Saito, M. Osame, P. Sikström, L. S. Ökvist and J. O. Wikstrom: ISIJ Int., 53 (2013), 2065.
- 18) J. Haruna and S. Suzuki: Tetsu-to-Hagané, 71 (1985), S875.
- 19) M. Mizutani, T. Nishimura, T. Orimoto, K. Higuchi, S. Nomura, K. Saito and E. Kasai: ISIJ Int., 57 (2017), 1499.
- 20) A. Ishimitsu, H. Adachi, Y. Yamada, T. Koyama, Y. Izeki, T. Yonezawa, T. Nagai, M. Nozaki and S. Suzuki: Tetsu-to-Hagané, 53 (1967), 406.
- 21) M. Naito, K. Ono, Y. Hayashi, A. Okamoto and K. Nakamura: Tetsu-to-Hagané, 72 (1986), S901.
- 22) V. Strezov, T. J. Evans, V. Zymla and L. Strezov: Int. J. Miner. Process., 100 (2011), 27.
- 23) M. Enoki, S. Fujikawa and T. Kishi: J. Jpn. Inst. Met., 58 (1994), 418.
- 24) M. Ohtsu: Res. Nondestruct. Eval., 6 (1995), 169.
- 25) K. Ito, H. Kuriki, M. Watanabe, S. Kuroda and M. Enoki: Mater. Trans., 53 (2012), 671.
- 26) H. Nakamura: J. Jpn. Soc. Non-Destruct. Inspect., 62 (2013), 267.
- 27) G. Briche, N. Tessier-Doyen, M. Huger and T. Chotard: J. Eur. Ceram. Soc., 28 (2008), 2835.
- 28) Y. Farnam, M. R. Geiker, D. Bentz and J. Weiss: Cem. Concr. Compos., 60 (2015), 135.
- 29) K. Shimazaki and H. Nagahama: Kagaku (Science), 65 (1995), 241.
- 30) H. Takayasu: Phys. Rev. Lett., 54 (1985), 1099.
- 31) C. H. Scholz: The Mechanics of Earthquakes and Faulting, 2nd ed., Cambridge University Press, Cambridge, (2002), 9.
- 32) K. Mogi: Bull. Earthq. Res. Inst. Univ. Tokyo, 40 (1962), 125.
- 33) T. Imai, F. Sugimoto, N. Kamoshida, S. Yamashita and M. Furuzumi: J. Jpn. Soc. Eng. Geol., 43 (2002), 14.
- 34) M. Onoue: Acoustic Emission - Bases and Applications, Corona Publishing, Tokyo, (1976), 1.
- 35) M. Ohtsu and Y. Tomoda: Mater. Trans., 48 (2007), 1184.