Fundamentals of High Temperature Processes
Effect of Coordination Structure of Iron Ions on Iron Oxide Activities in Na2O–SiO2–FeO–Fe2O3 Melts
2019 Volume 59 Issue 10 Pages 1744-1751

Details
2019 Volume 59 Issue 10 Pages 1744-1751
Activities of FeO and FeO1.5 in Na2O–SiO2–FeO–Fe2O3 melts have been investigated in terms of the coordination structure of iron ions. The melts were placed in Pt containers at 1573 K and equilibrated at partial pressures of oxygen in the range between 10−9 atm and 10−6 atm, and the activities were derived from Fe concentrations in the Pt containers using the activity coefficient of Fe in Pt–Fe alloys reported as a function of molar fraction of Fe. At the same time, the percentages of Fe2+, Fe3+ in octahedral symmetry (Fe3+(oct)) and Fe3+ in tetrahedral symmetry (Fe3+(tetr)) were also measured by Mössbauer spectroscopy. It has been found that the activity coefficients of FeO (γFeO) are larger than those of FeO1.5 (γFeO1.5), suggesting that FeO is prone to liberate from the silicate network more than FeO1.5. It has also been found that the values of γFeO monotonically increase with increasing Fe2+/Fetotal ratio; in contrast, the values of γFeO1.5 seem relevant to neither Fe3+(oct)/Fetotal nor Fe3+(tetr)/Fetotal ratio. The activity coefficients have been discussed from the perspective of the coordination structure via the effective ionic radii of Fe2+, Fe3+(oct) and Fe3+(tetr). The magnitude of effective ionic radii is in the hierarchy of Fe2+ > Fe3+(oct) > Fe3+(tetr), and thereby the bond strength between iron ion and oxide ion is in the hierarchy of Fe3+(tetr) > Fe3+(oct) > Fe2+. This suggests that Fe2+ ions are more loosely bound to the silicate skeleton than Fe3+(tetr) and Fe3+(oct) ions, which situation would be reflected in the magnitude of the activity coefficients and their dependencies on Fe2+/Fetotal, Fe3+(oct)/Fetotal and Fe3+(tetr)/Fetotal ratios.
Thermodynamic and thermophysical property data of slags are indispensable for designing iron and steel making processes because these properties affect the rates of chemical reaction and mass and heat transfer. Parts of these properties are relevant to the structure of slags including the coordination structure. The feature of slag structure is the network structure of silicate, the fundamental unit of which is a tetrahedron consisting of SiO44−. These tetrahedra join together to form chain and ring structures due to covalent bonding between bridging oxygen ions and Si4+ ions, developing into the network structure due to ionic bonding between non-bridging oxygen ions and metal cations such as Na+ and Ca2+ 1) mostly in octahedral symmetry.2,3) It should be understood that cations in tetrahedral symmetry form network skeletons, which are loosely bound to each other via cations in octahedral symmetry. In addition, it is worth noting that ironmaking and steelmaking slags contain iron oxides to provide Fe2+ and Fe3+ ions, where Fe2+ ions take octahedral symmetry, whilst tetrahedral and octahedral symmetries are equally probable for Fe3+ ions. Throughout the present paper, these Fe3+ ions are denoted by Fe3+(tetr) and Fe3+(oct), respectively,1,4) the former joining to form network skeletons.
So far thermophysical properties of slags containing iron oxides have often been studied from the perspective of the coordination structure of iron irons. For example, Sukenaga et al.5) have reported that viscosities for calcium ferrite based slags decrease with melting time, which reflects an increase in the Fe3+(oct) fraction and a decrease in the Fe3+(tetr) fraction with time, based upon a finding by two of the authors.6) In general, the viscosity of slags decreases with increasing concentrations of Fe2+ and Fe3+(oct), and increases with increasing concentration of Fe3+(tetr),7,8,9) which can finally be understood in terms of bond strength between iron ions and oxide ions.
On the contrary, there has been no enough discussion on thermodynamic data such as activities of iron oxides from the perspective of the coordination structure of iron ions. For example, Sano10) has measured activities of FeO in Na2O–SiO2–FeO–Fe2O3 melts saturated with solid iron, and has found that the activity coefficients of FeO have the maxima at the line joining the compositions of FeO and Na2O·SiO2, which has been supported by Goto et al.11) and Takeda and Yazawa.12) Sano has also applied Richardson’s model13) and drawn a conclusion that the activity coefficients of FeO are affected by excess molar Gibbs energies due to strong, attractive interaction between Na2O and SiO2 in the Na2O–SiO2 binary system.10) However, there is no discussion from the perspective of the coordination structure. Ban-ya et al.14,15,16,17,18) have measured the activities of slag components including iron oxides for many slag systems, and have applied the regular solution model19) to the data. In this model it is assumed that metal cations are randomly distributed in a matrix of oxide ions and that the activity coefficient (γi) of an oxide consisting of cation i and oxide ion is derived based upon the following:
| (1) |
To enable such discussion to be made, it is required to employ slag samples containing a sufficient amount of Fe3+ ions. Consequently, the present work employs Na2O–SiO2–FeO–Fe2O3 melts at oxygen partial pressures higher than that in the condition where slag is saturated with iron and aims:
· to obtain information of valence and coordination of iron ions
· to measure the activities of FeO and FeO1.5, and
· to clarify factors affecting the activity coefficients of FeO and FeO1.5 from the perspective of the coordination structure of iron ions.
Consider a system where a silicate melt containing iron oxides is placed in a Pt container, and assume that some iron is dissolved into the Pt container and that the following reactions are equilibrated:
| (2) |
| (3) |
The standard Gibbs energies of formation for liquid FeO (Δ G0FeO) and solid FeO1.5 (Δ G0FeO1.5) have been reported,20) and the following equations obtain:
| (4) |
| (5) |
Table 1 gives the nominal compositions of the master glass samples where N/S denotes the molar ratio of Na2O/SiO2. The concentration of Na2O was fixed at around 20 mol% because samples containing Na2O more than 36 mol% were too volatile to be equilibrated at 1573 K in preliminary experiments; on the other hand, the Fe2O3 concentration was changed with maintaining N/S = 0.300. Two types of master sample were prepared from reagent grade Fe2O3, SiO2 and Na2CO3 powders. The reagents were weighed to the desired compositions and mixed in an alumina mortar. The mixtures were contained in a Pt crucible, melted at 1573 K for 5 min in air and then poured onto a copper plate to obtain glassy samples. These samples were crushed for equilibrium experiments as well as chemical composition analyses. The chemical compositions of master samples were analyzed by X-ray fluorescence (XRF), the results of which are also given in Table 1. It can be seen that the analyzed N/S ratios are smaller than the nominal ones, which indicates that Na2O inevitably vaporized during the melting process.
| No. | Nominal compositions/mol% | N/S | Analyzed compositions/mol% | N/S | ||||
|---|---|---|---|---|---|---|---|---|
| Fe2O3 | Na2O | SiO2 | Fe2O3 | Na2O | SiO2 | |||
| 1 | 7.2 | 21.4 | 71.4 | 0.300 | 8.6 | 20.1 | 71.4 | 0.282 |
| 2 | 15.0 | 19.6 | 65.4 | 0.300 | 17.3 | 16.4 | 66.3 | 0.247 |
About 0.3 g of master samples were contained in Pt containers which were made by folding Pt foil (12 mm × 35 mm × 0.02 mm), and then suspended by a Pt wire within the uniform temperature zone of a SiC resistance furnace for equilibrium experiments. In the experiments temperature was fixed at 1573 ± 2 K. Partial pressure of oxygen (PO2) was controlled to be 1.0×10⁻⁹ atm, 1.0×10⁻⁸ atm, 1.0×10⁻⁷ atm and 1.0×10⁻⁶ atm by gas mixtures of CO–CO2 where the total flow rate was 100 ml/min; in addition, a gas mixture of Ar–O2 was also used to obtain PO2 of 1.3×10⁻⁶ atm. These values of PO2 were confirmed by an oxygen sensor. Equilibration time was decided to be 24 h on the basis of the preliminary experiment results21) as well as the concentration change of Fe in Pt foil estimated from the inter-diffusion coefficient of Pt–Fe alloy.22,23) The samples after equilibration were quenched into iced water. The phases of the samples were identified by X-ray diffraction (XRD) analyses, and the chemical compositions of slag and Pt phases were analyzed by XRF and electron probe microanalysis (EPMA), respectively; for the latter, ZAF correction was made. Furthermore, 57Fe Mössbauer measurements were carried out at room temperature using 57Co in Rh as the γ-ray source to determine the molar percentages of Fe2+/Fetotal, Fe3+(oct)/Fetotal and Fe3+(tetr)/Fetotal, where Fetotal represents all the iron ions. The Doppler velocity scale for the measurements was calibrated at room temperature using the spectrum of α-Fe foil.
Figures 1(a) and 1(b) show Mössbauer spectra of the samples made from master glasses 1 and 2 where samples A1, B1, C1, D1 and E1were made from master glass 1 in Table 1 and samples A2, B2, C2 and D2 from master glass 2. On the basis of Lorentzian function, these spectra have been deconvoluted into three symmetrical quadrupole doublets due to Fe2+, Fe3+(oct) and Fe3+(tetr). As a result, the Mössbauer parameters (isomer shifts (IS) and quadrupole splittings (QS)) obtained range as follows:
Fe2+: ISFe2+ = 0.65–0.84 mm/s, QSFe2+ = 1.82–2.43 mm/s
Fe3+(oct): ISFe3+(oct) = 0.11–0.17 mm/s, QSFe3+(oct) = 0.39–0.78 mm/s,
Fe3+(tetr): ISFe3+(tetr) = 0.14–0.27 mm/s, QSFe3+(tetr) = 0.95–1.26 mm/s

Mössbauer spectra of the samples made from master glasses (a) 1 and (b) 2 where samples A1, B1, C1, D1 and E1were made from master glass 1 and samples A2, B2, C2 and D2 from master glass 2.
These Mössbauer parameters are in agreement with the reported values.6,24,25,26) The Mössbauer parameters have the following physical meanings: The isomer shift is the reflection of difference between electron densities at the nuclei of the source and the absorber. In case of 57Fe Mössbauer measurements, the isomer shift strongly depends on the oxidation state of iron ions and less strongly depends on the nature of ligand anions.24) On the other hand, the quadrupole splitting is sensitive to coordination symmetry and ligands of iron ions.24) Thus, the quadrupole doublets with the largest IS values have been assigned to Fe2+, and the quadrupole doublets with larger QS values in the two remainders have been assigned to Fe3+(tetr).6,27) The molar percentages (pct.) of Fe2+, Fe3+(oct) and Fe3+(tetr) to Fetotal have been calculated from the relative absorption area of the subspectra, as given in Table 2(a).
| (a) | (b) | (c) | (d) | (e) | ||||||||||
|---|---|---|---|---|---|---|---|---|---|---|---|---|---|---|
| PO2/atm | pct. | Compositions/mol% | N/S | CFe(Pt) | aFeO | aFeO1.5 | γFeO | γFeO1.5 | ||||||
| Fe2+ | Fe3+(oct) | Fe3+(tetr) | FeO | FeO1.5 | Na2O | SiO2 | mass% | |||||||
| A1 | 1.0×10⁻⁶ | 25.0 | 52.8 | 22.2 | 3.9 | 11.7 | 18.2 | 66.2 | 0.27 | 0.979 | 0.0173 | 0.010 | 0.444 | 0.088 |
| A2 | 1.0×10⁻⁶ | 19.0 | 45.0 | 36.0 | 6.2 | 26.5 | 13.3 | 54.0 | 0.25 | 1.59 | 0.0336 | 0.020 | 0.541 | 0.075 |
| B1 | 1.3×10⁻⁶ | 8.8 | 66.5 | 24.7 | 1.5 | 15.4 | 16.5 | 66.6 | 0.25 | 0.467 | 0.0082 | 0.005 | 0.545 | 0.034 |
| B2 | 1.3×10⁻⁶ | 18.8 | 74.1 | 7.1 | 6.6 | 28.4 | 12.8 | 52.2 | 0.25 | 1.34 | 0.0301 | 0.019 | 0.457 | 0.067 |
| C1 | 1.0×10⁻⁷ | 8.6 | 81.7 | 9.7 | 1.5 | 16.7 | 17.6 | 64.2 | 0.27 | 1.49 | 0.0097 | 0.003 | 0.607 | 0.019 |
| C2 | 1.0×10⁻⁷ | 28.3 | 60.1 | 11.5 | 8.4 | 21.3 | 16.6 | 53.7 | 0.31 | 1.49 | 0.0097 | 0.003 | 0.115 | 0.015 |
| D1 | 1.0×10⁻⁸ | 75.4 | 18.7 | 5.9 | 10.6 | 3.5 | 14.1 | 71.9 | 0.20 | 6.81 | 0.0762 | 0.014 | 0.718 | 0.408 |
| D2 | 1.0×10⁻⁸ | 76.8 | 12.4 | 10.8 | 18.5 | 5.6 | 12.2 | 63.7 | 0.19 | 9.56 | 0.237 | 0.044 | 1.28 | 0.795 |
| E1 | 1.0×10⁻⁹ | 64.7 | 23.0 | 12.3 | 10.7 | 5.8 | 18.6 | 64.8 | 0.29 | 4.11 | 0.0061 | 0.0006 | 0.057 | 0.011 |
Figures 2(a) and 2(b) show the pct. of Fe2+, Fe3+(oct) and Fe3+(tetr) to Fetotal as a function of logarithm of PO2 for the samples made from master glasses 1 and 2, respectively. With increasing PO2, the Fe2+ pct. decreases while the Fe3+(oct) pct. increases and the Fe3+(tetr) pct. moderately increases. The same tendency has been found by Morinaga and his coworkers,4) who have revealed that the ratio of Fe3+(oct)/Fe3+(tetr) increases with decreasing fraction of Fe2+ for both Na2O–SiO2–FeO–Fe2O3 slags and CaO–SiO2–FeO–Fe2O3 slags with constant ratios of Na2O/SiO2 and CaO/SiO2, respectively.

Pct. of Fe2+, Fe3+(oct) and Fe3+(tetr) to Fetotal as a function of logarithm of PO2 for the samples made from master glasses (a) 1 and (b) 2.
Table 2(b) gives the chemical compositions of slag phases in all the samples along with N/S ratios determined from XRF and Mössbauer spectroscopy analyses. The N/S ratios are in agreement with those of the master glasses within analytical error except for samples D1 and D2, in which the N/S ratios become smaller during the equilibrium experiments.
3.2. Activity of Fe in PtFigure 3 shows a back-scattered electron (BE) image of a sample heated at 1573 K for 24 h (a) along with the line profiles of Fe and Pt measured by EPMA for the same sample (b). It can be seen from Fig. 3(a) that Pt coexists with a slag phase which was liquid in the equilibrium experiment: this situation has applied for all the other samples. Inspection of Fig. 3(b) indicates that Fe distributes almost uniformly in the Pt phase although the slag/Pt interface is not very clear. The Fe concentration in mass% (CFe(Pt)) in the Pt phase has been calculated using the X-ray intensities (IFe(Pt) and IFe(slag)) of Fe, respectively, in the Pt and slag phases, which are corrected by the background intensity (IFe(resin)), according to the following equation.
| (6) |

BE image of a sample heated at 1573 K for 24 h (a) along with the line profiles of Fe and Pt measured by EPMA for the same sample (b). (Online version in color.)
The value of aFe has been determined as γFexFe(Pt), where xFe(Pt) is the molar fraction of Fe in the Pt phase and is derived from the value of CFe(Pt), and γFe is the activity coefficient of Fe in the Fe–Pt alloy. The value of γFe for Fe–Pt alloys has been investigated by several researchers. Reported data available have carefully been compared by Fredriksson and Seetharaman,28) who have proposed the following relationship between γFe and xFe(Pt).
| (7) |
This equation has been employed to determine the activity of Fe in the Pt phase, which is subject to determination of the activities of FeO and FeO1.5 in the slag phase via Eqs. (4) and (5).
3.3. Activities of FeO and FeO1.5 in SlagTable 2(d) gives the activities of FeO and FeO1.5 (aFeO and aFeO1.5, respectively) derived for each sample. Figure 4 shows the value of aFeO as a function of molar fraction of FeO in the slag phase. This figure also includes data reported by Sano,10) Ban-ya et al.17) and Takeda and Yazawa12) for Na2O–SiO2–FeO–Fe2O3 slags saturated with solid iron, respectively, with N/S ratios of 0.25, 0.2–0.3 and 0.2. The respective measurement temperatures were 1573 K, 1673 K and 1523 K. As mentioned in 2.3, in the present work, both CO–CO2 and Ar–O2 mixtures were employed to obtain PO2 ~ 1×10⁻⁶ atm. Inspection of Fig. 4 indicates that the difference in atmosphere does not affect the value of aFeO, which suggests that there is no possibility of CO2 gas dissolving into the slag, although such possibility was pointed out by Ban-ya et al.17) In fact, the pct. of Fe2+, Fe3+(oct) and Fe3+(tetr) to Fetotal are not identical between the samples equilibrated in the CO–CO2 and Ar–O2 mixtures, as shown in Fig. 2. This may stem from the analytical errors of Mössbauer spectra. It can also be seen from Fig. 4 that the value of aFeO in the present work exhibits negative deviation from ideality except for the sample with the largest xFeO value. On the contrary, the values reported by Sano,10) Ban-ya et al.17) and Takeda and Yazawa12) exhibit positive deviation over the concentration range measured on the slags with roughly the same N/S ratios. Takeda and Yazawa have also reported that the value of aFeO exhibits negative deviation from ideality for the slags with the lower xFeO regions when the N/S ratios are higher than 0.45.12) Thus, it is supposed that the deviation of the activity from ideality would be relevant to the FeO concentration, suggesting the interaction between FeO and silicate matrix also depends on the concentration.

Figure 5 shows the value of aFeO1.5 as a function of molar fraction (xFeO1.5) of FeO1.5 in the slag phase. Two of the activity values seem to obey Raoult’s law; however, these samples have low concentrations of FeO1.5, which are supposed to contain large uncertainty in chemical composition analysis. Thus, the activity and concentration data for FeO1.5 of three samples (D1, D2 and E1) with low concentrations of FeO1.5 including the above two are neglected in discussion in this paper. Another inspection of Fig. 5 indicates that the value of aFeO1.5 shows remarkable negative deviation over the range measured, which suggests that FeO1.5 has attractive interaction with the silicate matrix. The negative deviation for the activity of Fe2O3 has also been reported by Basu et al.29,30)

Values of aFeO1.5 as a function of xFeO1.5 in the slag phase.
Table 2(e) gives the activity coefficients of FeO and FeO1.5 (γFeO and γFeO1.5, respectively); for example, the value of γFeO has been derived from aFeO = γFeOxFeO, where xFeO is the molar fraction of FeO. Figures 6(a) and 6(b) show the value of γFeO as a function of xFeO and the value of γFeO1.5 as a function of xFeO1.5, respectively, for the samples made from master glasses 1 (Samples 1) and 2 (Samples 2). The straight line in Fig. 6(a) is the line fitted to the data by the least-squares method. It can be seen that both γFeO and γFeO1.5 are smaller than unity except for one γFeO value; accordingly, both FeO and FeO1.5 have attractive interaction with the silicate matrix. In addition, the interaction of FeO1.5 with the silicate matrix is much stronger due to the relation γFeO1.5 « γFeO.

Values of γFeO as a function of xFeO (a) and γFeO1.5 values as a function of xFeO1.5 (b).
One of the authors have previously reported that, for 35(mass%)FeOx-CaO-SiO2 slags, the normalized FeO1.33 activity value, i.e., the FeO1.33 activity divided by the molar ratio of iron ions to all the cations is the largest where the ratio of Fe3+(oct)/Fe3+(tetr) is in the range between 0.5 and 1.0, and have supposed that iron ions in these slags take a coordination structure which promotes the formation of nanoclusters close to Fe3O4 and/or Ca2Fe2O5 in chemical composition.31,32) Now examine this supposition based upon the data in the present work.
Figure 7 shows the values of γFeO as a function of ratio of Fe2+/Fetotal (a), and the values of γFeO1.5 as a function of ratios of Fe3+(oct)/Fetotal (b) and Fe3+(tetr)/Fetotal (c). Possible nanoclusters in the present system may be Fe3O4, Fe2O3 and NaFeO2, in which the ratios of Fe2+/Fetotal, Fe3+(oct)/Fetotal and Fe3+(tetr)/Fetotal are 0.25, 0.25 and 0.5 for Fe3O4, 0, 1 and 0 for Fe2O3 and 0, 0 and 1 for NaFeO2.33) However, there are no remarkable increases in γFeO and γFeO1.5 at the above ratios in Fig. 7. As a consequence, the values of γFeO and γFeO1.5 would not be relevant to the formation of nanoclusters of Fe3O4, Fe2O3 and NaFeO2.
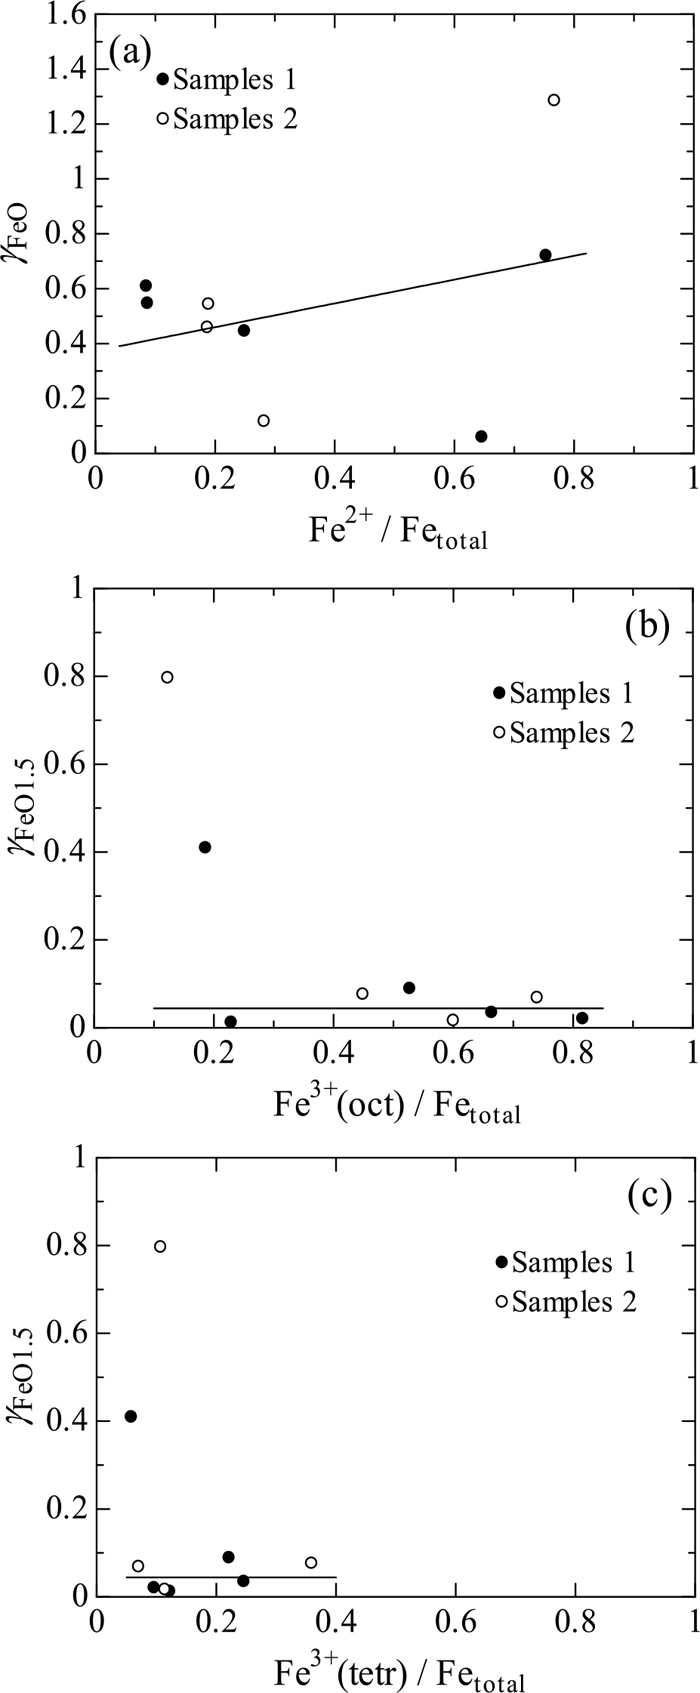
Values of γFeO as a function of the Fe2+/Fetotal (a), and values of γFeO1.5 as a function of the Fe3+(oct)/Fetotal (b) and Fe3+(tetr)/Fetotal ratios (c).
Another inspection of Fig. 7 indicates that the values of γFeO monotonically increase with increasing Fe2+/Fetotal ratio; in contrast, the values of γFeO1.5 seem relevant to neither Fe3+(oct)/Fetotal nor Fe3+(tetr)/Fetotal ratio where the three samples with low concentrations of FeO1.5 are neglected.
The values of γFeO and γFeO1.5 are discussed from the perspective of the coordination structure via the effective ionic radii of Fe2+, Fe3+(oct) and Fe3+(tetr). The effective ionic radii of Fe2+, Fe3+(oct) and Fe3+(tetr) have been reported to be 0.61–0.780 Å (0.061–0.0780 nm), 0.55–0.645 Å (0.055–0.0645 nm) and 0.49 Å (0.049 nm), respectively,34) where Fe2+ and Fe3+(oct) can take both low spin and high spin conditions, resultantly producing the range in the ionic radii, whilst Fe3+(tetr) can take only a high spin condition. Thus, the magnitude of effective ionic radii is in the hierarchy of Fe2+ > Fe3+(oct) > Fe3+(tetr), and thereby the field strength, i.e., bond strength between iron ion and oxide ion is in the hierarchy of Fe3+(tetr) > Fe3+(oct) > Fe2+, suggesting that Fe2+ ions are most loosely and Fe3+(tetr) ions are most rigidly bound to the silicate skeleton. In other words, FeO would be more agglomerated each other with increasing FeO concentration; on the contrary, FeO1.5 would be prone to be bound to the silicate skeleton, irrespective of FeO and FeO1.5 concentrations. These tendencies would be reflected in Fig. 7.
The above discussion on the relation between the effective ionic radii and the activity coefficients is supported by the reported data of aAlO1.5 in the CaO–SiO2–AlO1.5 slags.35,36) Figure 8 shows the value of γAlO1.5 as a function of xAlO1.5 for the samples with CaO/SiO2 = 0.5, 2 and 4 on a mole basis, where the position of CaO/AlO1.5 = 0.5 is marked by the arrow. Al3+ ions take tetrahedral symmetry to form network skeletons where there is a sufficient amount of Ca2+ as charge compensator in slags.1) Theoretically, all Al3+ ions take tetrahedral symmetry at CaO/AlO1.5 > 0.5, which situation occurs at lower concentrations of AlO1.5 in the figure. In actuality, as Neuville et al. have reported, a small amount of Al3+ also exits in fivefold symmetry and its fraction increases with increasing AlO1.5 and SiO2 concentrations.37) The effective ionic radius of Al3+ ion in fivefold symmetry is 0.48 Å (0.048 nm) whilst the radius of Al3+(tetr) is 0.39 Å (0.039 nm),34) suggesting that Al3+ ions in fivefold symmetry are more loosely bound to alumino-silicate skeletons than Al3+(tetr) ions. This tendency would be reflected in Fig. 8, showing that the value of γAlO1.5 increases with increasing AlO1.5 concentration and with decreasing CaO/SiO2 ratio, i.e., increasing SiO2 concentration. Fe3+(tetr) and Al3+ have a similar structural role; both FeO45− and AlO45− tetrahedra fit into the SiO44− network and the associated cations (e.g. Na+ and Ca2+) which are required to maintain the electrical charge balance. Nevertheless, inspection of Fig. 8 shows that the values of γAlO1.5 are much larger than those of γFeO1.5. Such difference in activity coefficient may stem from the difference in valence of cation maintaining electrical neutrality. In fact, one Ca2+ ion requires two AlO45− tetrahdera nearby, accordingly, resulting in the agglomeration of AlO45−.

Values of γFeO are calculated on the basis of the regular solution model19) according to the method reported by Ban-ya et al.16,17) and Matsuzaki et al.38) First, the value of γFeO(R.S.) is calculated from Eq. (12)17) and then is converted to the value of γFeO via Eq. (13).16,38)
| (12) |
| (13) |
Activities of FeO and FeO1.5 in Na2O–SiO2–FeO–Fe2O3 melts at 1573 K and at partial pressures of oxygen in the range between 10−9 atm and 10−6 atm have been investigated in terms of the coordination structure of iron ions. The followings have been obtained:
• With increasing PO2, the Fe2+ pct. decreases while the Fe3+(oct) pct. increases and the Fe3+(tetr) pct. moderately increases.
• Both values of γFeO and γFeO1.5 are smaller than unity, and the values of γFeO are greater than those of γFeO1.5, which suggests that FeO is prone to liberate from the silicate network more than FeO1.5.
• The values of γFeO monotonically increase with increasing Fe2+/Fetotal ratio; in contrast, the values of γFeO1.5 seem relevant to neither Fe3+(oct)/Fetotal nor Fe3+(tetr)/Fetotal ratio.
• The magnitude of effective ionic radii is in the hierarchy of Fe2+ > Fe3+(oct) > Fe3+(tetr), and thereby the bond strength between iron ion and oxide ion is in the hierarchy of Fe3+(tetr) > Fe3+(oct) > Fe2+. This suggests that Fe2+ ions are more loosely bound to the silicate skeleton than Fe3+(oct) ions as well as Fe3+(tetr) ions, which situation would be reflected in the magnitude of the activity coefficients and their dependencies on Fe2+/Fetotal, Fe3+(oct)/Fetotal and Fe3+(tetr)/Fetotal ratios.
