1. Introduction
Grain refinement strengthening is one of the most attractive methods to increase the strength of polycrystalline materials. The yield strength (σy) measured by tensile tests is usually expressed by the well-known Hall-Petch relationship as a function of average grain size (d), as shown below:1,2,3)
|
σ
y
=
σ
0
+
k
y
d
-1/2
| (1) |
where
σ0 is the friction stress within metal matrix,
ky is the parameter presenting the efficiency of grain refinement strengthening,
i.e. Hall-Petch coefficient. In the dislocation pile-up models,
1,2) Hall-Petch coefficient (
ky) can be expressed as a function of the critical grain boundary (GB) shear stress (
τ*) as follows:
1,2,3,4)
where
M is Taylor factor,
G is shear modulus,
b is the Burgers vector, and
k is a constant depending on the character of dislocation (edge/screw). Recently, the key parameter
ky was indicated to be strongly influenced by the addition of interstitial elements (
i.e., C and N) in ferritic steels.
3,5,6,7)
On the other hand, the effects of substitutional element additions on ky have not been widely studied and well understood yet, though there are a few reports on the effects of Ni, Cr and P.8,9,10,11,12) In this work, the effects of individual addition of substitutional elements (Si, Al, Mn, Ni and Cr) on Hall-Petch relationship were investigated in IF ferritic steel to evaluate their effects systematically by combining experimental examinations, the dislocation pile-up model and the GB segregation theory by McLean.13) The quantitative correlation between critical GB shear stress (τ*) and GB segregation magnitude was then established to interpret the mechanisms of ky increment due to alloying elements.
3. Experimental Results and Discussions
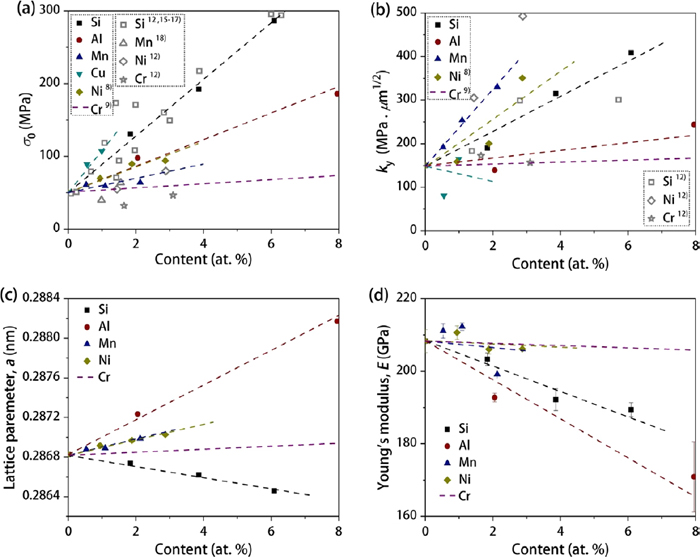
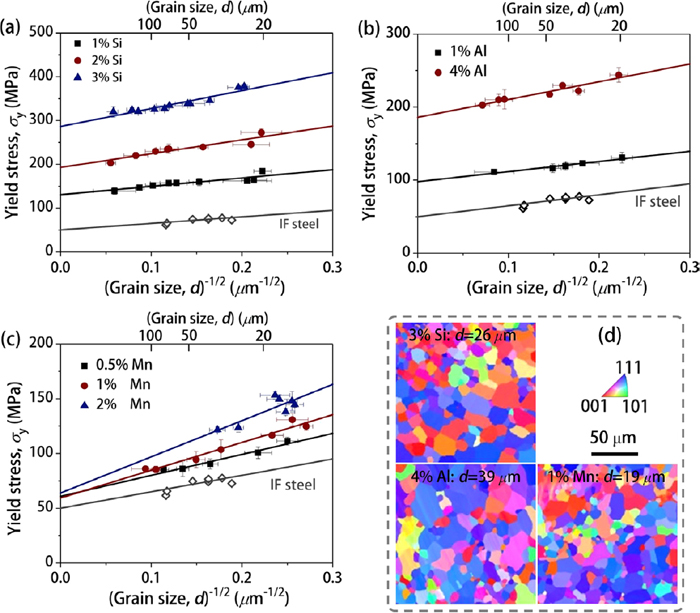
Figures 1(a)–1(c) show the Hall-Petch plots of IF ferritic steels with various Si, Al and Mn contents. It is observed that the addition of alloying elements significantly varies both the intercept with vertical axis (σ0) and the slope of the lines (ky). In Fig. 1(d), EBSD micrographs of selected samples with different substitutional element additions indicate full recrystallization grains and little difference on texture. Figures 2(a) and 2(b) summarize the plots of σ0 and ky values with various Si, Al, Mn, Ni8) and Cr9) contents (at.%). The obtained values of σ0 are the combined contributions of friction stress of pure iron and solid solution strengthening of each element, in which the GB strengthening function is not included.8) Hence, the solid solution strengthening ability of various substitutional elements exhibits the following sequence: Si > Al ≈ Ni > Mn > Cr. The present results generally coincide with previous works in IF steels.12,15,16,17,18) The slight differences could be the included GB strengthening in some works,9,15,18) the presences of different impurities,17) few interstitial elements12) and experimental factors.8,9,17) As shown in Fig. 2(b), complicated effects of various substitutional elements on the values of ky are observed. Mn, Si and Ni additions significantly increase ky, while 4% Al steel gives a slight increase of ky. In addition, Cr has little influence on ky.
By utilizing the Nelson-Riley refinement from XRD results,19) the estimated lattice parameter, a, of the present steels are summarized in Fig. 2(c). Si is found to decrease lattice parameter while other substitutional elements increase it. The change of lattice parameter with Al additions is the most remarkable. In Fig. 2(d), the measured Young’s modulus (E) values of the present steels are exhibited. Si and Al additions significantly decrease Young’s modulus, while the additions of Ni, Mn and Cr display little effect on it. The obtained values of a and E will also be used to calculate τ* (Eq. (2)) subsequently.
According to Langmuir-McLean approach,13,20) equilibrium GB segregation level (
X
i
GB
) in Fe-i binary alloy can be given by:
|
X
i
GB
X
i
GB*
-
X
i
GB
=
X
i
1-
X
i
exp(
-
Δ
G
i,T
RT
)
| (3) |
where
X
i
GB*
is the GB interface saturation,
Xi is the atomic fraction of solute
i in host matrix, Δ
Gi,T is the Gibbs energy of segregation of solute
i at GB,
R is the universal gas constant and
T is the given temperature. This equation is generally believed to be well accorcadance with the GB segregation levels in sufficiently annealed steels since the validity has been experimentally demonstrated.
20,21,22) However,
Eq. (3) solely gives the equilibrium concentration of solute
i at GB, and thus, the kinetics of the experimental segregation process is not included.
13,20) In practical annealing situations, the alloy atoms rarely have sufficient time to reach full equilibrium GB segregation level (
i.e., unsaturated state), because of the limited diffusion rate of solute
i. To consider the transport of solute
i by volume diffusion from the neighbored grain volume toward the GB, McLean
13) proposed the following equation to describe the GB segregation kinetics:
|
X
i, t
GB
-
X
i, t=0
GB
X
i, t=∞
GB
-
X
i, t=0
GB
=1-exp(
-
D
i
t
β
i
2
δ
2
)
erfc(
D
i
t
β
i
δ
)
| (4) |
where
X
i, t=∞
GB
is the equilibrium GB segregation level at given annealing temperature (
T),
X
i, t
GB
is the actual GB segregation magnitude under annealing time (
t).
X
i, t=0
GB
is the initial GB segregation magnitude before annealing,
βi is the enrichment coefficient,
δ is the width of the grain boundary and
Di is the volume diffusion coefficient of the solute
i. It is found from
Eqs. (3) and
(4) that the practical segregation level at given annealing conditions (
T and
t) is dominated by the potential GB segregation level (
X
i
GB
) and diffusion coefficient (
Di).
13,20)
To calculate the practical GB segregation magnitude, the following assumptions were made first: (a) There is little effect from impurities and the present specimens were treated as Fe-i binary alloys; (b) Little segregation during recrystallization treatment is formed (i.e.,
X
i, t=0
GB
≅ Xi); (c) Little non-equilibrium GB segregation is resulted during quenching owing to lower Di of current substitutional elements.20,21) The values of the parameters for calculating practical GB segregation magnitudes are summarized in Table 2. In order to demonstrate the validity of this calculation, the GB segregation level estimated by utilizing Eq. (4) was compared with the experimentally measured values8,23) for representative alloys. The red and black curves of Fig. 3(a) show the calculated GB segregation levels in 3% Ni steel and 1.5% Si steel with increased annealing time (t), respectively. Simultaneously, the experimentally measured values are plotted in Fig. 3(a). This figure reveals calculated results and experimental ones coincide very well, which demonstrates the reliability of current calculations. In Fig. 3(b), increased Si contents are observed to increase equilibrium GB segregation levels and accelerate segregation processes.
Table 2. Summarized values of the parameters for calculating practical GB segregation magnitudes in the present work. Δ
G0 is the estimated Gibbs energy of segregation at particular experimental conditions in which the equilibrium GB segregation was examined experimentally.
20) Di is estimated by the equation
D
i
=
D
0
exp(
-
Q
RT
)
.
25,26,27) | β | δ (nm) | ΔG0 (kJ/mol) | ΔGi,T (kJ/mol) | D0 (cm2/s) | Q (kJ/mol) |
|---|
| Si | 3×10⁴ | 1 | −9 | ΔG0+0.012ΔT | 1.47 | 233 |
| Al | 3×10⁴ | 1 | −12 | ΔG0+0.008ΔT | 5.31 | 196.5 |
| Mn | 3×10⁴ | 1 | −11 | ΔG0+0.025ΔT | 1.49 | 233.6 |
| Ni | 3×10⁴ | 1 | −14.4 | ΔG0+0.016ΔT | 1.4 | 245.8 |
| Cr | 3×10⁴ | 1 | −4.9 | ΔG0+0.009ΔT | 0.44 | 253.3 |
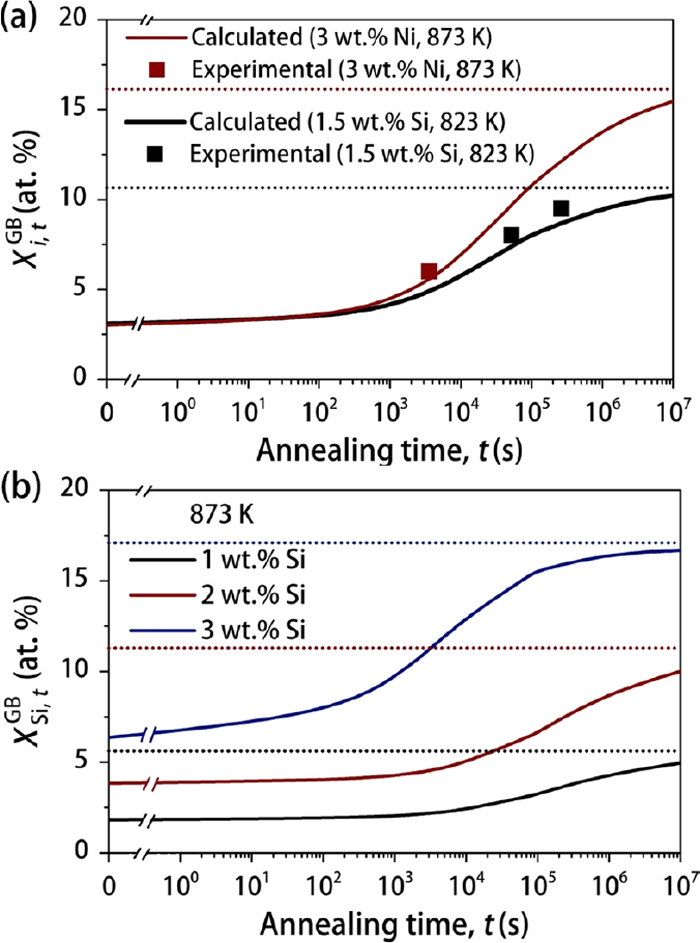
Figure 4(a) summarizes the calculated GB segregation levels under the experimental conditions in which Hall-Petch relationship is determined (Fig. 1). The deviations from the initial alloy contents (
X
i, t=0
GB
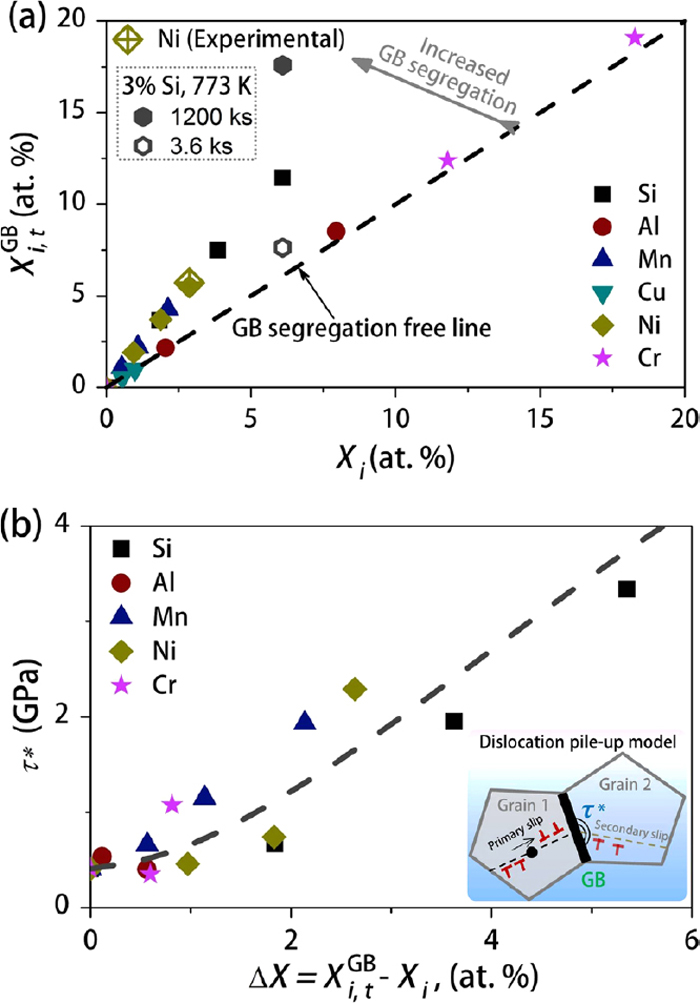
, dashed line) reflect the magnitudes of GB segregation. It is indicated that Si, Mn and Ni additions show clear GB segregation, which also enlarge the values of ky (Fig. 2(b)). While Al and Cr additions have little effects on both GB segregation (Fig. 4(a)) and ky (Fig. 2(b)). It should be noted that experimental examinations20,21,22,23) have demonstrated the remarkable and complex effects of GB misorientation/types on GB segregation of solutes. Therefore, the calculated GB segregation levels reflect the (nominal) average magnitude of all GBs.13,20,21,22,23) In Fig. 4(b), the values of τ*, estimated from the Eq. (2) with the experimental results of ky (Fig. 2(b), lattice parameter (Fig. 2(c)) and Young’s modulus (Fig. 2(d)), is now plotted as a function of the exceeded levels of GB segregation (
ΔX=
X
i, t
GB
-
X
i
). Here, the value of k in Eq. (2) was estimated to be 0.945 based on the experimental evaluation of edge and screw dislocation fraction obtained by XRD line profile analysis.3,24) The τ* values are found to be increased gradually with increased ΔX. It is revealed that the all plots are almost on the single line, which indicates that substitutional alloying elements have a similar effect on the GB strength though they might have different tendency to segregate to GB. Although the physical meaning of this phenomenon is unclear so far, we need more experimental plots and additional simulations to confirm this result and clarify the mechanism of atomic-scale yielding phenomenon at GB in the future. Such outcomes are of vital importance for modern GB segregation engineering, e.g., interfaces design, alloys and processing developments.28,29,30)