Surface Treatment and Corrosion
Roles of Inclusion, Texture and Grain Boundary in Corrosion Resistance of Low-Nickel Austenite Stainless Steel Containing Ce
2019 Volume 59 Issue 12 Pages 2302-2310
Details
2019 Volume 59 Issue 12 Pages 2302-2310
The roles of inclusion, texture and grain boundary in corrosion resistance of low-nickel austenite stainless steel containing Ce was investigated by using SEM, TEM, EBSD, XRD and testing technology of electrochemistry. The results revealed that the variation in corrosion resistance of 205 stainless steels containing Ce was higher than specimen without Ce, which depended on ∑3n boundaries and Ce modifying inclusion treatment. Ce addition to steels was prone to forming fine and dispersive Ce multi-phase inclusions containing CeAlO3, CeS and Ce2O2S. When addition of Ce was up to 0.016 wt.%, its textures were characterized by pronounced γ-fiber textures comprising {111} <110> and {111} <112> components, as well as the frequency of ∑3n boundaries related to {111} <112>, {111} <110> and {112} <110> components was significantly improved, which was in favor of corrosion resistance improvement. While adding 0.023 wt.%Ce element was detrimental to corrosion resistance of stainless steel.
AISI 205 austenite stainless steels with low Ni, high Mn and N elements have become a promising candidate to replace traditional 304 stainless steels because of relatively low cost, which are widely used in anti-corrosion materials for kitchen utensils, building materials, transport equipment and other fields.1) Currently, the corrosion resistance is a serious problems for 205 stainless steels in comparison with 304 stainless steels due to the characteristic of low-nickel,2) which has severely restricted their application in seriously corrosive environment. For austenitic stainless steels (ASS), the addition of rare earth Ce has recently been employed as an effective way to reduce the content of harmful impurity elements and inclusions, which improves the corrosion resistance of steels.3,4) Torkamani et al.5) found that rare earth elements could change the interaction between the inclusions and matrix during the solidification process, affecting the microstructural features. Kwon et al.6) reviewed that a decrease in Ce content was attributable to the formation of oxide inclusions, and the inclusion-steel interfacial area could be acted as the preferential site for initiation of pitting corrosion. Arenas et al.7) reported that not only the control of composition, size and morphology of Ce-containing inclusions in steel but also the high segregation of Ce element along grain boundaries were highly important for the corrosion behavior of steels.
Presently, studies on grain boundaries in austenite stainless steels have become a hot research subject based on controlling the frequency of ∑3n (twin) grain boundaries.8) According to the misorientation between adjacent two grains, the grain boundaries have been divided into three types, viz. low angle grain boundaries (LAB), random high angle grain boundaries (HAB), special coincidence site lattice (CSL) boundaries.9,10) The CSL boundaries had been used to the grain-boundary-related properties of materials, which was proposed by Watanabe over two decades.11) Sakaguchi et al.12) studied that twin boundaries (∑3) and ∑9 CSL boundaries were endowed with the highest resistance to cracking because of their low boundary energies. Nevertheless, few literatures have been focused on the effect of Ce contents on CSL boundaries related to the corrosion resistance of stainless steel.
In the present study, we designed four types of 205 stainless steels containing different Ce contents to investigate the influence of rare earth Ce on the inclusions, textures, grain boundaries and corrosion performance. In 3.5 wt.% NaCl solution, the potentiodynamic polarization tests were discussed in details to provide fundamental understanding of Ce element on improving the corrosion resistance of 205 stainless steel.
In a high frequency vacuum induction furnace, 205 stainless steels containing various Ce contents were manufactured. The chemical compositions of experimental steels were presented in Table 1, and rare earth Ce residue in experimental steels was determined by inductively coupled plasma-mass spectrometry (ICP-MS) analysis.
| Sample | C | Si | Mn | P | S | Cr | Ni | Al | N | O | Ce | Fe |
|---|---|---|---|---|---|---|---|---|---|---|---|---|
| A1 | 0.18 | 0.58 | 15.2 | 0.009 | 0.006 | 17.51 | 1.29 | 0.022 | 0.33 | 0.0023 | 0 | Blance |
| A2 | 0.18 | 0.56 | 15.4 | 0.008 | 0.005 | 17.53 | 1.27 | 0.025 | 0.33 | 0.0019 | 0.007 | Blance |
| A3 | 0.18 | 0.57 | 15.1 | 0.007 | 0.005 | 17.51 | 1.28 | 0.026 | 0.33 | 0.0011 | 0.016 | Blance |
| A4 | 0.18 | 0.58 | 15.2 | 0.008 | 0.005 | 17.54 | 1.27 | 0.021 | 0.33 | 0.0015 | 0.023 | Blance |
Each ingot was forged into the sheets with 50 mm thickness at 1250°C, hot-rolled to 4 mm in 1050-850°C temperature range by nine passes. After annealed at 1050°C for 2 h in a Nitrogen atmosphere, they were cooled in water in order to obtain a single austenite microstructure without precipitates.
A square area of 1 mm2 was selected randomly from the observation surface of annealed samples to examine the morphology, size and number of inclusions by means of FEI Quanta 600 scanning electron microscope (SEM). The element distribution of inclusions in annealed samples was observed in Electron probe micro-analysis (EPMA) with a current of 1.05×10⁻⁸ A and voltage of 20 kV. OIM 4000 electron backscatter diffraction (EBSD) detector was conducted to investigate the microstructures of annealed samples along the longitudinal section as defined by the rolling direction (RD) and normal direction (ND). In center layer, the orientation distribution functions (ODFs) were performed to measure and calculate using X-ray diffraction.
All samples were processed into the sizes of 10 mm× 10 mm×4 mm horizontal standard specimens. A copper wire was welded in one of its experimental non-work surface, and they were polished before washed with anhydrous ethanol, the samples with an exposed area of 1 cm2 as the working electrode. The corrosion rate of samples was assessed with Streicher tests, studied in 5 wt.% sulfuric acid environment for 240 h, and the corrosion morphologies of different degrees in sulfuric acid environment were observed by means of SEM. The potentiodynamic polarization tests were performed at Electrochemical Workstation in a conventional three-electrode electrochemical cell, as well as the coupon working electrode (WE) with an exposure surface of 10 mm×10 mm, and the platinum counter electrode (CE) and saturated calomel reference electrode (SCE) were used. The substrates of annealed sheets containing various Ce content were allowed to stabilize in the corrosive test solution for 30 min prior to measuring the anodic polarization and impedance measurements. Tafel polarization curves were measured from −0.25 to +0.5 V at a constant voltage scan rate of 0.2 mV/s. After the annealed sheets with varying Ce contents were soaked in 3.5 wt.% NaCl solution for 15 days, they were performed using Solartron company’s 1280B electrochemical station. Impedance measurements were carried out at open circuit potential with the ac amplitude of 5 mV within the frequency range of 1×10⁵ Hz–1×10⁻² Hz at room temperature.
The morphologies of inclusions in annealed samples with different mass fractions of Ce are shown in Fig. 1. The inclusions in sample A1 mainly consisted of long strip MnS, irregular angular MnS–Al2O3 and Al2O3 inclusions. There was an about 3 μm Ce multi-phase inclusion containing Al, O, S, Mn and Ce elements, and a deep groove occurred on the grain boundaries of sample A2. When the mass fraction of Ce in steel was up to 0.016 wt.%, the globular and small-sized inclusion (less than 2 μm) with Al, O, S and Ce elements was transferred from the grain boundaries to grain inner. With increased addition of Ce (0.023 wt.%) in steel, a large irregular Ce multi-phase inclusion with the high S and low Al contents occurred in the vicinities of grain boundaries.

Morphologies of inclusions in annealed samples: (a) sample A1, (b) sample A2, (c) sample A3 and (d) sample A4. (Online version in color.)
Figure 2 reveals the EPMA elemental mapping analysis of inclusions in annealed samples, as well as the mass concentration of each element can be distinguished by means of various colors and degree contrast. A mass of globular Al2O3 inclusions cluster in sample A1 (without Ce addition) severely wrecked continuity of steel matrix and accelerated the forming and expanding of corrosion pits in the corrosive medium. It was deduced from the results of EPMA that the size of Ce multi-phase inclusion composed of CeAlO3, CeS and Ce2O2S inclusions in sample A3 (with 0.016 wt.% Ce addition) was approximately 1.8 μm, identified by the distribution of Al, O, S and Ce elements with a higher content in central area of inclusion.

EPMA elemental mapping analysis of inclusions in annealed samples: (a)–(d) Al2O3 in sample A1, (e)–(i) multi-phase inclusion containing CeAlO3, CeS and Ce2O2S in sample A3. (Online version in color.)
Figure 3 reveals the variation tendency of inclusion size and number per unit area (1 mm2) in the steels with different Ce addition. With increasing addition amounts of Ce from 0 to 0.023 wt.%, the average inclusion size gradually decreased from 5.6 to 2.1 μm, and then rose to 4.1 μm, as well as the number of inclusions reduced from 240 to 60, then up to 80. When addition of Ce was risen to 0.023 wt.%, the average inclusion size of sample A4 was nearly two times greater than that of sample A3, while the number of inclusions increased from 60 to 80 because a large number of Ce multi-phase inclusions gathering together reduced the core of heterogeneous nucleation.
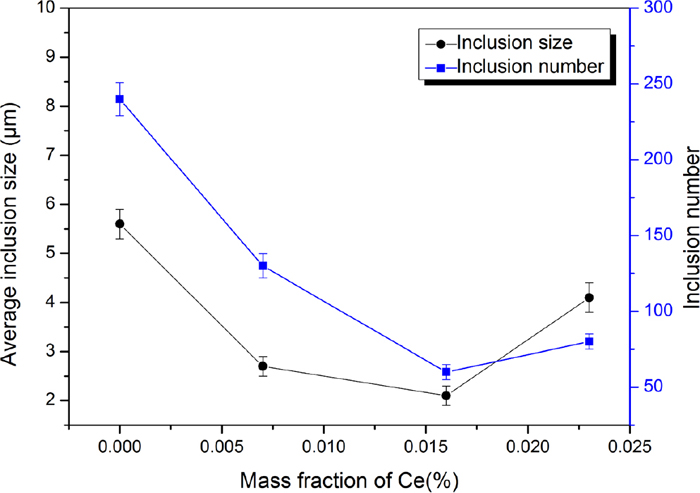
Variation tendency of inclusion size and number per unit area (1 mm2) in the steels with different Ce addition. (Online version in color.)
Previous reports have confirmed that some reactions in process of Ce treatment depending on Gibbs free energy, and the corresponding Standard Gibbs free energy of reactions can be presented in Table 2.13)
| Reaction | ΔG°/J mol−1 |
|---|---|
| [Ce]+(3/2) [O]=(1/2) Ce2O3 | −714380+179.74 T |
| [Ce]+[O]+(1/2) [S]=(1/2) Ce2O2S | −675700+165.50 T |
| Ce2O3+[S]=Ce2O2S+[O] | 77360−28.48 T |
| [Ce]+(3/2) [S]=(1/2) Ce2S3 | −536420+163.86 T |
| [Ce]+[S]=CeS | −422100+120.38 T |
| Ce2S3=2 CeS+[S] | 228640−86.96 T |
The direct reactions among Ce, O and S elements in steel can be represented as:
| (1) |
| (2) |
| (3) |
According to Gibbs free energy, Ce2O2S and CeS inclusions are more likely to occur after adding Ce, calculated as follows:
| (4) |
| (5) |
Then, Ce2O3 can be transformed into Ce2O2S according to the relevant calculations. Similarly, CeS is calculated as follows:
| (6) |
| (7) |
After adding a small number of Ce element (0.007 wt.%), MnS and Ce multi-phase inclusions containing CeAlO3, Ce2O2S, CeS existed in steel depending on the composition of elements (Fig. 1(b)). With increased Ce addition continuously, relatively stable CeAlO3, Ce2O2S and CeS multi-phase inclusions (Fig. 1(c)) were transferred from the grain boundaries to the grain inner, decreasing the occurrence of pitting corrosion. The CeAlO3 phase in Ce multi-phase inclusions was stable at Ce content lower than about 0.023 wt.%, after which CeS was the most stable phase, identified by the high S and low Al contents (Fig. 1(d)).
3.2. Texture EvolutionThe textures in center layer of annealed samples are indicated in Fig. 4. After annealing, the textures of sample A1 were mainly composed of weaker rotated cube {001} <110> and {111} <112> textures (Fig. 4(a)), by contrast, the intensities of α-fiber (<110>∥RD) and γ-fiber textures (<111>∥ND) in sample A2 were significantly enhanced (Fig. 4(b)). When addition of Ce was up to 0.016 wt.%, its textures were characterized by pronounced α-fiber texture and γ-fiber texture comprising {111} <110> and {111} <112> components (Fig. 4(c)). Further increasing Ce addition, for the sample A4 containing excessive Ce element, the whole intensities of α-fiber and γ-fiber textures were on the decline in contrast to sample A3 (Fig. 4(d)).

Textures (φ2=45° section of ODFs) in center layer of annealed samples: (a) sample A1, (b) sample A2, (c) sample A3 and (d) sample A4. (Online version in color.)
Li et al.14) found that a composite addition of Ce and Al could remarkably reduce the intensities of {001} cube texture depending on the mass fraction of impurity elements and composition of inclusions, and the modification of Ce-inclusions could suppress the nucleation of recrystallized grains along {001} orientation characterized by low corrosion resistance, which indicated that the decline on number and size of inclusions was favorable for improving intensities of {111} orientation. It should be emphasised here, that the {111} plane regarded as the closest packing crystal plane in FCC structure is endowed with superior corrosion resistance.15) From the aforementioned results, rare earth Ce affected the number and size of inclusions in the matrix, and the orientations between recrystallized nucleus and matrix was changed due to Ce addition.16,17) Thus, adding 0.016 wt.% Ce content suppressed the nucleation and growth {001} orientation grains, and changed {001}<110> orientation into {111}<110> orientation, while excessive Ce addition (0.023 wt.%) reduced the intensities of {111} <110> and {111} <112> textures.
3.3. Grain BoundaryFigure 5 presents the grain boundary maps of annealed samples with different mass fractions of Ce analyzed by EBSD, as well as the corresponding relationship of Ce addition and grain size is shown in Table 3. It was seen that sample A1 was composed of typical austenite microstructure and a certain amount of annealing twins with ∑3 (twin) boundaries, and the average size of austenite grains was ~58.4 μm (Fig. 5(a)). By contrast, the fraction of ∑3, ∑9 and ∑27 grain boundaries was much higher in sample A2, and the austenite grains exhibited a low level at about 43.6 μm (Fig. 5(b)). After adding 0.016 wt.% Ce content, the average size of austenite grains was reduced up to 36.7 μm, and the number of multiple twins in accord with ∑3n (n=1, 2, 3) CSL relation were gradually improved (Fig. 5(c)). When addition of Ce was risen to 0.023 wt.%, the number of annealing twins reduced and the average size of austenite grains measured as 41.8 μm was on the increase as compared to sample A3 (Fig. 5(d)).
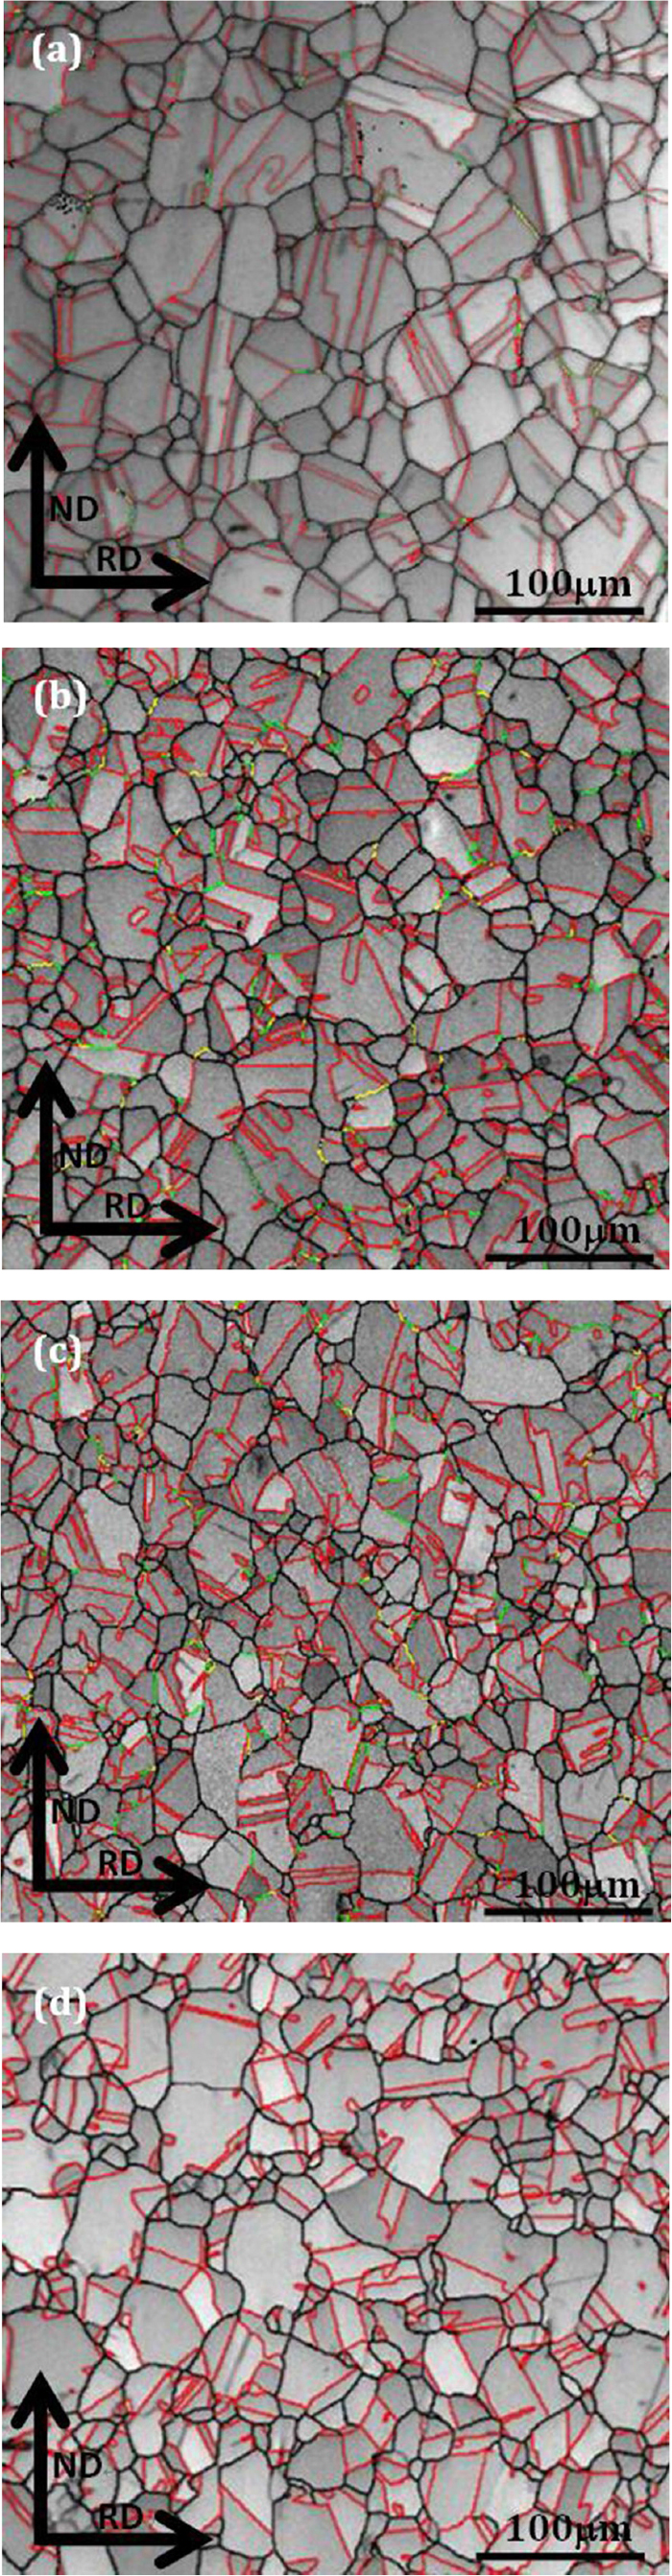
Grain boundary maps of annealed samples: (a) sample A1, (b) sample A2, (c) sample A3 and (d) sample A4 (grain boundary map: red line—∑3 grain boundaries, green line—∑9 grain boundaries, yellow line—∑27 grain boundaries). (Online version in color.)
| Sample | Ce addition/wt.% | Maximum grain size/μm | Average grain size/μm |
|---|---|---|---|
| A1 | 0 | 78.1 | 58.4 |
| A2 | 0.007 | 73.2 | 43.6 |
| A3 | 0.016 | 57.6 | 36.7 |
| A4 | 0.023 | 68.5 | 41.8 |
As is well known, based on vacancy diffusion mechanism, rare earth Ce acted as a resistance for the interfacial tension of liquid-solid two-phase interface can hinder the corresponding atoms from the liquid phase to solid phase, which significantly decrease the nucleation energy and increase nucleation rate of austenite grains.18) The relation between average grain size and grain growth velocity can be expressed in the following equation:19)
| (8) |
The frequency distribution of misorientations for annealed samples is shown in Fig. 6. According to the results of Fig. 5, the CSL boundaries (3≤∑≤29) mainly consisting of ∑3, ∑9, ∑27a and ∑27b types, increased sharply up to the maximum value and then declined to the lower value with the increase of Ce contents, which was in good agreement with texture evolution after Ce addition. Distinctly, the fraction of ∑3 CSL boundaries was much higher than that of other CSL boundaries satisfying the Brandon’s criterion of maximum angular deviation (Δθ=15°∑−1/2).

Frequency distribution of misorientations for annealed samples: (a) sample A1, (b) sample A2, (c) sample A3 and (d) sample A4. (Online version in color.)
Figure 7 presents the grain boundary character distributions of annealed samples. In addition to the decreasing number of HAB, the number of CSL boundaries and LAB increased gradually with increasing addition amounts of Ce from 0 to 0.016 wt.%, and the fraction of CSL boundaries and LAB was reduced after adding 0.023 wt.% Ce element.

Bar chart showing the grain boundary character distributions of annealed samples. (Online version in color.)
From the aforementioned results and analyses, it was demonstrated that the number of inclusion gradually increased with increasing addition amounts of Ce from 0 to 0.016 wt.%, and these Ce multi-phase inclusions had a remarkable influence on the frequency of ∑3n CSL boundaries. The causes of degradation and disappearance of ∑3n CSL boundaries mainly include two aspects: (1) The adjacent subcrystals gradually absorb the deformation twins according to the protruding mechanism.20) (2) The number of twin laths decreases based on the merging mechanism, and the twin interface of wide laths disappears because of the dislocation slip.21)
Generally, the nucleus of annealing twins can be attributable to the result of grain boundary redistribution, and the interfacial migration leads to the growth of annealing twins. The growth driving force of annealing twins related to stacking fault energy is the reduction of total surface energy. Annealing twins nucleate at the grain boundaries during the initial stage of recrystallization. The stacking fault can be firstly formed in the annealing process, then grow continuously, and finally transformed into the nucleus of annealing twins. Owing to the large atomic radius, rare earth Ce exists in the crystal defects, such as the grain boundaries, dislocations and so on. On the one hand, trace rare earth Ce segregation on grain boundary has an effect on the migration rate of grain boundaries, which affects and inhibits the growth of recrystallized grains. On the other hand, Ce inclusions can reduce the stacking fault energy of austenite and pin the dislocations, which is not conducive to dislocation slip. Therefore, the number of twin interface and ∑3n CSL boundaries increases with the increasing of the number of Ce inclusions.
It is widely reported that austenitic stainless steels belonging to typical materials with low-level stacking fault energy, are easy to form the multiple annealing twins in the process of recrystallization.22) As a special low-energy boundary, twin boundaries (∑3n boundaries) occupying a larger area fraction in austenitic stainless steel are active interfaces relative to the regular crystal structure.23,24) When the multiple twins meet together, ∑3 boundaries can grow up and form between them due to the effect of interface migration. A twin relationship (60°<111>) of {111} <110> and {111} <112> orientations constitutes twin boundaries, endowed with high migration rate due to low energy, which is beneficial to the nucleation of {111} <110> and {111} <112> components.25) As such, improving the whole intensities of α-fiber and γ-fiber textures is conducive to high proportion of ∑3n boundaries.26)
3.4. Corrosion ResistanceThe weight loss rate results for annealed samples are presented in Fig. 8. Sample A1 without Ce addition suffered from the highest average corrosion rate in contrast to other samples, which was analyzed using weight loss test in 5 wt.% sulfuric acid solution for 240 h. As expected, the weight loss result for sample A3 was at the minimum rate, while the average corrosion rate increased from 26.7 to 39.6 gmm−2d−1 after adding 0.023 wt.% Ce content, which was attributed to a change in ∑3n CSL boundaries and Ce multi-phase inclusions.

Weight loss rate results for annealed samples. (Online version in color.)
Figure 9 presents SEM morphologies of 205 stainless steels in 5 wt.% sulfuric acid solution after 240 h. It was visible that relatively severe corrosion was observed on the surface of sample A1, and the corrosion pits propagated towards around Ce-inclusions as nucleation sites for micro-region corrosion, finally resulting in a deep longitudinal crack. From the observation of corrosion morphologies in sample A2, the corrosion products in the matrix were not compact, and the number of large grooves obviously decreased in contrast to sample A1. The general corrosion degree of sample A3 was on the decrease, and the characteristics of slight corrosion fully demonstrated that the proper amount of Ce effectively reduced the impact of corrosive ions, resulting in the improvement of corrosion resistance. And apparently, a large number of corrosive pits and grooves occurring on the surface of sample A4 exhibited poor corrosion resistance of steels.

SEM morphologies of 205 stainless steel in 5 wt.% sulfuric acid solution: (a) sample A1, (b) sample A2, (c) sample A3 and (d) sample A4.
Sakaguchi et al.27) studied the relation between the CSL frequency and intergranular corrosion of austenitic stainless steels in a ferric sulfate–sulfuric acid, and it was verified that the CSL frequency of over 82% ensured very low percolation probability of random boundary networks in per-threshold and a remarkable suppression of intergranular deterioration. In this paper, the excellent resistance to general corrosion was obtained in 5 wt.% sulfuric acid solution when the total CSL grain boundaries reached more than 54% in sample A3 containing 0.016 wt.% Ce, which played a key role in corrosion resistance of 205 stainless steel.
The polarization curves of 205 stainless steel in 3.5 wt.% NaCl solution are indicated in Fig. 10. By comparing the polarization curves, the open circuit potentials of stainless steels with a complete passive region were found to shift slightly towards negative direction with the increase of Ce addition. As was the present case, sample A1 without Ce exhibited the lowest pitting potential (Epit), and the Epit value of sample A3 was higher than that of sample A4, indicating that appropriate Ce (0.016 wt.%) in steel obtained excellent corrosion resistance in contrast to 0.023 wt.% Ce addition.

Polarization curves of 205 stainless steel corroded 15 days. (Online version in color.)
The type and number of grain boundaries are related to the corrosion resistance of stainless steels. The∑CSL grain boundaries are oriented close to low Miller {hkl} index planes among their adjacent grains, which is regarded as immune or very susceptive to the corrosion resistance of stainless steels.28) Takehara et al.29) reviewed that ∑3 boundaries associated with the intensities of {111} orientation were induced by annealing twins in FCC structure, and this type of CSL boundaries with good lattice matching and low energy could improve the corrosion resistance of steels. Arafin et al.30) reported that not only ∑3, ∑9 and ∑27 boundaries were “special”, but also they were resistant to the pitting corrosion.
In terms of grain boundary structure, as reported elsewhere, most of LAB with low interfacial energy existing on the grain boundary network of HAB plays an active role in blocking and inhibiting the intergranular corrosion.31) According to the previous analysis, the {111} crystal face related with the frequency of ∑CSL grain boundaries can be identified as the closest packing crystal plane of FCC structure, the ∑3n boundaries have the characteristics of high corrosion resistance.32) Therefore, in contrast to the other samples, sample A3 obtained excellent corrosion resistance because of a larger fraction of CSL boundaries and LAB.
Based on the corrosion morphologies and polarization curves, the reasons for excellent corrosion resistance in sample A3 can be explained as follows. Firstly, rare earth Ce modified the number, composition, size and morphologies of inclusions, and the fine spherical Ce multi-phase inclusions as cathode caused the anodic passivation and made Cl− penetration resistance of passive film enhanced, which was favorable for a decrease on the micro-region corrosion of inclusions.31) Moreover, with increased Ce addition, the high adjacent probability of {111} <112>, {111} <110> and {112} <110>components obtained the higher frequency of ∑3n boundaries, enhancing corrosion resistance of low-nickel austenite stainless steel. Conversely, the corrosion resistance of sample A4 was lower than that of sample A3, which was associated with inclusion, texture type and ∑3n boundaries as well. The larger-sized MnS–Al2O3 and Al2O3 inclusions in sample A4 were prone to cracking tendency to separate the matrix, exerting an adverse effect on corrosion resistance of stainless steel. Other reasons were also explained by the lower frequency of ∑CSL boundaries and texture types in steel.
The roles of Ce on inclusions, texture evolution, grain boundaries and corrosion resistance of 205 stainless steel were studied in this paper. Based on the analysis above, it can be concluded that:
(1) With increasing addition amounts of Ce from 0 to 0.023 wt.%, the average inclusion size gradually decreases from 5.6 to 2.1 μm, and then rises to 4.1 μm, as well as the number of inclusions reduces from 240 to 60, then up to 80. Meanwhile, the composition of inclusions was changed from larger-sized MnS–Al2O3 and Al2O3 to small Ce multi-phase inclusions CeAlO3, CeS and Ce2O2S after Ce addition.
(2) The frequency of ∑3n boundaries strongly influenced by the intensities of {111} <110> and {111} <112> components increased with increasing Ce contents, while the fraction of ∑3n boundaries identified as the high corrosion resistance was reduced after adding 0.023 wt.% Ce element.
(3) The results of electrochemical tests indicated that the variation in corrosion resistance of steels was attributable to a contribution combining ∑3n boundaries with Ce modifying inclusion treatment, and the corrosion resistance of steel was gradually improved as Ce content increased, as well as excessive Ce addition (0.023 wt.%) was detrimental to corrosion resistance of 205 stainless steel.
The authors gratefully acknowledge the financial support from the Foundation of the Education Department of Liaoning province (Grant no. L2019029), the Young Scientists Fund of the National Natural Science Foundation of China (Grant no. 11404154), and Research Initiation Funds for Liaoning Shihua University (No. 2019XJJ-001).