Fundamentals of High Temperature Processes
Effects of Coke Ash on Erosion of Carbon Composite Brick
2019 Volume 59 Issue 3 Pages 412-420

Details
2019 Volume 59 Issue 3 Pages 412-420
Carbon composite brick has attracted increased attention because it is widely used on the hot face of blast furnace hearth. In order to reduce the erosion rate of carbon composite brick and investigate effects of coke ash on the erosion of carbon composite brick, the minerals CaO·Al2O3, CaO·2Al2O3, and CaO·6Al2O3 (CA, CA2, and CA6), which were considered to be the main components of coke ash in hearth, were prepared by heating a mixture of CaCO3 and Al2O3. Experiments of the minerals coupled with carbon composite brick were carried out at different temperatures in a high temperature tube furnace. The mass change fraction of the experimental assembly was calculated using mass measurements before and after the experiment. The reaction products at different temperatures were predicted on the basis of ternary phase diagrams, and the thickness of the reaction layer was measured using scanning electron microscopy (SEM). The results show that the reaction rate of carbon composite brick with the minerals increased with an increase of the Ca content in the minerals. The results of reaction interface analysis show that the diffusion of Ca2+ was the dominant process during reaction. Cation diffusion was considered to be the rate determining step, and this was in agreement with experimental results. Therefore, reducing the ash content of coke, especially the CaO in ash, is the key to reduce the erosion rate of carbon composite bricks below the centerline of taphole.
For the modern blast furnace (BF), the safety of the hearth is the foundational factor for long service life of the BF.1,2,3,4,5) The products of reaction at the interface of the hearth are considered to be the primary reason for refractory erosion. Recently, carbon composite brick has attracted increased attention, the combination of carbon composite brick and ceramic cup is applied on the hot face of hearth. Namely, the combination of carbon composite brick and ceramic cup is applied on the hot face of hearth. As a result, the performance of refractory in hearth can be obviously improved.6,7) Meanwhile, slag phase which derived from coke ash is found below the centerline of taphole, the erosion of refractory below the centerline of taphole may be related to this. The interfacial reaction between coke ash and carbon composite brick may explain the mechanism of erosion.
There have been studies regarding carbon composite brick. The composition and microstructure of carbon composite brick were detected by Jiao.8) The oxidation resistance of carbon composite brick in air was analyzed over the temperature range of 800~1500 K, the oxidation of carbon was carried out at 800~1100 K, and the oxidation of SiC and graphite was found in the range of 1100~1500 K.9) Oxidation behaviors under different atmospheres, gas flow rates, and steam content were studied by Liu.10) Effects of slag composition on erosion of carbon composite brick were investigated.11) While, the skeleton function of coke in BF was irreplaceable, and the deterioration of coke occurred through various chemical reactions.12) A large number of dissection investigations of BF hearths indicated that carbon in coke was picked up by molten iron when coke was in contact with molten iron, and the slag phase formed by coke ash was found in hearth.13,14) A viscous layer formed by coke ash around the interface between molten iron and coke was found at high temperature, and the dissolution rate of coke was affected significantly by ash content.15) The composition at the interface between ash and molten iron was reported by Wu,16) the first product was Al2O3, and the proportion of CaO increased with longer reaction time, SiO2 was not found at the interface because SiO2 was directly reduced to SiO vapor. Chapman17) found that the coke ash layer consisted mainly of large amount of calcium aluminates such as CaO·Al2O3, CaO·2Al2O3, and CaO·6Al2O3 (CA, CA2 and CA6). These minerals attached on the hot face and could result in the erosion of carbon composite brick. However, effects of coke ash on erosion of carbon composite brick have not been reported in depth, and the change mechanism of products at the interface is far from clear.
Therefore, in order to reduce the erosion rate of carbon composite brick, experiments of coke ash coupled with carbon composite brick were carried out at different temperatures in a high temperature tube furnace. The formation mechanism of the reaction products was discussed, the rate determining step was analyzed.
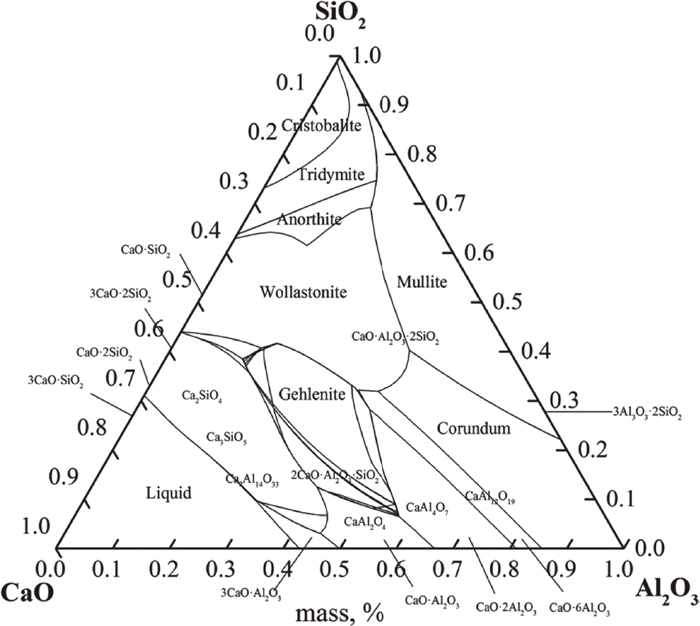
The minerals CA, CA2, and CA6 were produced using the method reported by Chapman.18) The minerals were prepared using pure reagents to ensure the accuracy of the experiment, the process was mainly affected by the mass of raw materials and the calcination temperature. The mass of CaCO3 and Al2O3 needed to generate 1 mol CA, CA2 and CA6 was calculated as presented in Table 1. CaCO3 was used instead of CaO because CaO easily absorbed water. The reaction phase diagram of CaO and Al2O3 was drawn using Factsage and is shown in Fig. 1; the calcination temperature was set at 1673 K according to the formation temperatures of CA, CA2, and CA6 in the phase diagram. The mixture of CaCO3 and Al2O3 was heated from room temperature to 1173 K; after CaCO3 was completely decomposed into CaO, the mixture was heated to 1673 K. The heating process is presented in Fig. 2.
| Raw materials | CaO, g | CaCO3, g | Al2O3, g |
|---|---|---|---|
| CA | 56 | 100 | 102 |
| CA2 | 56 | 100 | 204 |
| CA6 | 56 | 100 | 612 |

Phase diagram of CaO and Al2O3. (Online version in color.)
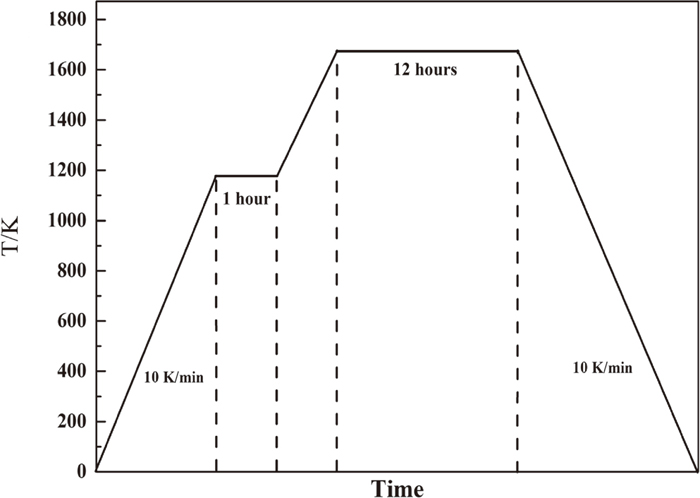
Heating process of raw materials.
New carbon composite brick whose quality was the same as the brick used in the actual operation was cut into discs (diameter of 25 mm and thickness of 10 mm). The discs were polished by abrasive paper to make them smooth on the upper and lower surfaces. Then, the discs were dried at 378 K for 12 hours. The main composition and properties of carbon composite brick are presented in Table 2.
| Composition | Al2O3, % | C, % | SiO2, % | SiC, % |
| Value | 73.05 | 10.2 | 8.18 | 6.0 |
| Properties | Apparent stomatal rate, % | Molten iron corrosion index, % | Slag corrosion index, % | Average pore size, μm |
| Value | 12.9 | 1.3 | 2.8 | 0.225 |
Well-prepared CA, CA2, and CA6 were placed on the carbon composite brick discs for experiments. Before the experiments, CA, CA2, CA6 and carbon composite brick discs were dried in a desiccator. CA, CA2, and CA6 were placed on the carbon composite brick discs to form experimental assemblies. The experimental assemblies were weighed and recorded using the electronic balance. The weight of the sample CA, CA2 and CA6 was 5 g, the weight of carbon composite brick was 13.6 g.
The experimental assemblies were placed in a crucible, the crucible was placed in a high temperature tube furnace to carry out the experiments (Fig. 3). Experimental conditions are shown in Table 3, the experimental temperatures were set to 1723 K, 1773 K, 1803 K, and 1823 K, respectively according to the hot surface temperature of the BF hearth. The temperatures were kept for 4 hours to investigate the composition change of experimental assemblies at different reaction temperatures. The temperature 1773 K was kept for 4 hours, 8 hours, and 12 hours to investigate the effect of reaction time on the experimental assemblies.

Schematic diagram of experimental apparatus. (Online version in color.)
| Temperature, K | holding time, h | Experimental assembly | ||
|---|---|---|---|---|
| 1723 | 4 | Carbon composite brick+CA | Carbon composite brick+CA2 | Carbon composite brick+CA6 |
| 1773 | 4 | Carbon composite brick+CA | Carbon composite brick+CA2 | Carbon composite brick+CA6 |
| 1803 | 4 | Carbon composite brick+CA | Carbon composite brick+CA2 | Carbon composite brick+CA6 |
| 1823 | 4 | Carbon composite brick+CA | Carbon composite brick+CA2 | Carbon composite brick+CA6 |
| 1773 | 8 | Carbon composite brick+CA | Carbon composite brick+CA2 | Carbon composite brick+CA6 |
| 1773 | 12 | Carbon composite brick+CA | Carbon composite brick+CA2 | Carbon composite brick+CA6 |
The high purity argon gas was pumped into the furnace at the flow rate of 3 L/min before the heating. The crucible was heated from room temperature to the desired temperature at a rate of 5 K/min. The temperature was kept for scheduled time to carry out the reaction, then cooled at a rate of 5 K/min. The experimental assemblies were taken out of the crucible and weighed after the experiments. The mass change fraction of each experimental assembly was calculated, scanning electron microscopy-energy dispersive spectrometry (SEM-EDS) analysis of each experimental assembly was carried out after the experiment.
The ternary phase diagrams (Fig. 4) was calculated with Factsage, the possible products of different assemblies at different temperatures could be predicted based on the ternary phase diagrams and the EDS results. The products after 4 hours experiments at different temperatures were predicted in Table 4, the main products of CA assembly were CA2 and Al2O3, the main products of CA2 assembly were CA6 and Al2O3, the main product of CA6 assembly was Al2O3. The macroscopic morphology could be directly compared to show the effects of reaction. The macroscopic morphologies of experimental assemblies at different temperatures are presented in Fig. 5. The surface of experimental assemblies before the reaction was smooth and compact. The white colour phase showed CA, grey area meant carbon composite brick with scattered Al2O3, the upper calcium aluminates and the lower carbon composite bricks were separated.
Ternary phase diagrams.
| Assembly | 1723, K | 1773, K | 1803, K | 1823, K |
|---|---|---|---|---|
| Carbon composite brick+CA | CA2, Al2O3 | CA2, Al2O3 | CA, CA2, Al2O3 | CA, CA2, Al2O3 |
| Carbon composite brick+CA2 | Al2O3 | CA6 | CA6, Al2O3 | CA6, Al2O3 |
| Carbon composite brick+CA6 | CA6, Al2O3 | CA6, Al2O3 | CA6, Al2O3 | CA6, Al2O3 |

The macroscopic morphologies of experimental assemblies at different temperatures. (a) CA+brick. (b) CA2+brick. (c) CA6+brick. (Online version in color.)
Figure 5(a) shows the macroscopic morphology of CA assembly after the reaction. The main reaction of CA assembly can be expressed as follows:
| (1) |
After high temperature interfacial reaction, some tiny holes appeared on the surface of CA. The surface color changed from white to yellow and then to black, the possible products of the reaction were white, the surface layer could be grind off, so the color changed at high temperature might be caused by the contamination of the sample surface in the oven during the drying process. The size of holes increased with the increase of temperature. CA and carbon composite bricks were closely combined except 1803 K after the reaction. Figure 5(b) shows the macroscopic morphology of CA2 assembly after the reaction. The main reaction of CA2 assembly can be expressed as follows:
| (2) |
The outer edge of carbon composite brick was presented with a white layer at 1723 K. The gray edge of CA2 appeared only at 1723 K compared with CA assembly, the surface of CA2 remained white in other three experiments, the surface of the CA2 was still smooth and small holes were not observed, CA2 and carbon composite bricks were still combined. Figure 5(c) shows the macroscopic morphology of CA6 assembly after the reaction. The surface of the CA6 was still smooth and small holes were not observed. The color of CA6 surface was caused by the contamination, so the color of CA6 remained white after the reaction at 1773 K. CA6 and carbon composite bricks were still combined.
3.2. The Mass Change Fraction and the Thickness of the Reaction LayerThe mass change fraction of the experimental assembly was calculated using the mass measurements before and after the experiment according to:
| (3) |
The mass change fractions of the assemblies at different temperatures are presented in Fig. 6(a). Positive correlation was found between the absolute value of the mass change fraction and temperature. A part of weight loss of the assembly was mainly because of the reduction of SiO2 in carbon composite brick. SiO2 was reduced to form SiO gas, and the gas escaped from the carbon composite brick,19) and the main part of weight loss came from the erosion of carbon composite brick. As shown in Fig. 6(b), when the reaction time was longer, the weight loss was greater. The mass change fraction of the CA assembly was greater than that of the CA2 assembly, which was greater than that of the CA6 assembly.

Mass change fractions after the experiments. (a) Mass change fractions at different temperatures. (b) Mass change fractions versus reaction time. (Online version in color.)
Scanning electron microscopy (SEM) was used to measure the thickness of the reaction layer 10 times, and the average value was used as the final result. The thickness of the reaction layer increased with an increase in temperature, as seen in Fig. 7(a). The thickness of the reaction layer increased rapidly when the temperature was relatively low, and the thickness of the reaction layer at 1773 K was about 4 times thicker than that at 1723 K. The thickness of the reaction layer increased slowly when the temperature was relatively high. It was apparent that the thickness of the reaction layer of CA was significantly larger than that of CA2 and CA6, and the thickness of the reaction layer of CA2 was slightly larger than that of CA6. Thus, it is concluded that the change regulation was that, at the same temperature, the thickness of the reaction layer of CA assembly was the largest due to Ca content in CA was the highest. The thickness change in the reaction layer with respect to time is shown in Fig. 7(b); the formation of the reaction layer remained stable after 4 hours. In an actual hearth, it is expected that the protective layer, which may consisted of slag phase on the hot face of carbon composite brick, could form quickly at low temperature. This protective layer can separate the carbon composite brick from molten iron, which can delay the erosion of carbon composite brick.

Thickness of the reaction layer after the experiments. (a) Thickness of the reaction layer at different temperatures. (b) Thickness of the reaction layer versus reaction time. (Online version in color.)
The experimental assemblies after the reaction were inlaid in the resin, then polished by sand paper, SEM-EDS was conducted on the surface of reaction interface.
In generally, the solid-solid reaction at high temperature is mainly controlled by the transfer rate of elements, which can be characterized by Fick’s first law and Fick’s second law. In CaO–Al2O3 and CaO–SiO2 systems, the diffusion of elements was mainly Ca2+. Tagai et al.20) found that CaO can diffuse into large chunks of Al2O3 through different calcium aluminate layers. In the Al2O3–SiO2 system, the diffusion of elements was mainly Al3+ and Si2+. The diffusion rates of Al3+, Si2+, and Ca2+ at 1670 K in solid Al2O3 were 1×10⁻¹³ cm2/s, 7.51×10⁻¹² cm2/s, and 3.1×10⁻⁹ cm2/s, respectively,21) it can be seen that the diffusion rate of Ca2+ was significantly larger than that of Al3+ and Si2+, and the diffusion rate of Si2+ was larger than that of Al3+. Therefore, it can be predicted that Ca2+ had larger diffusion rate in the reactions of CA, CA2, and CA6 with carbon composite bricks.
SEM images of the interface at different temperatures are shown in Fig. 8. In the same mineral, Ca was only scattered on the side of the carbon composite brick when the temperature was low, such as in the case of the interfacial reaction of CA (Fig. 8(a)), and this indicated that the reaction rate was small. The diffusion rate of various elements was accelerated with an increase in temperature. The amount of elements flowing to the interface increased, and Ca clustered in banded form in the carbon composite brick near the interface (Fig. 8(b)). When the diffusion of Ca was dominant, the effect of temperature on the element transfer could be explained by Arrhenius formula:
| (4) |

Surface scanning of CA interface at different temperatures. (a) Surface scanning of CA interface at 1723 K. (b) Surface scanning of CA interface at 1823 K. (Online version in color.)
At this time, the rate constant increased exponentially with the increase of temperature. In the interfacial reaction of CA assembly at 1823 K, Si was enriched at the interface, and plagioclase, mullite, and liquid phase with high Si content might be formed. The diffusion rate of Ca in CA was higher than that of CA2, and the diffusion rate of Ca in CA2 was higher than that in CA6 at the same temperature; this was caused by the concentration gradient of Ca. The degree of the reaction could be dependent on the Ca content in the sample, the more reaction occurred if the more Ca content contained in the sample. As described above, the weight of the samples was the same, the Ca content in CA was higher than CA2 and CA6, the mass of Ca was higher. Therefore, the more reaction occurred in CA assembly, the degree of the reaction was more intense. On the left side of the figures were CA, CA2, CA6, the right side were carbon composite bricks, and the red box in the middle were reaction interfaces. From the distribution of Al, Si and Ca in the surface scanning, it could be seen that Al was distributed in carbon composite brick and CA, Ca was not contained in carbon composite brick, and Si was not distributed in CA. When the reaction proceeded, Al diffused from CA to carbon composite brick, Si diffused from carbon composite brick to CA, and Ca diffused from CA to carbon composite brick.
SEM images of the interface with different reaction times are shown in Fig. 9(a). The carbon composite brick contained some large Al particles, and Si was mainly connected to the carbon matrix. The diffusion rate of Ca increased with longer reaction time, and the distribution of Ca at the interface was clearly observed when the reaction of CA2 lasted for 12 hours (Fig. 9(b)). It is easy to form substances with high Si content at the interface due to enrichment of Si at the interface. The predicted products at 1773 K at different time are presented in Table 5. As presented in the table, the CA assembly changed the most as time went on, melilite might formed after the reaction time was kept for 12 hours.
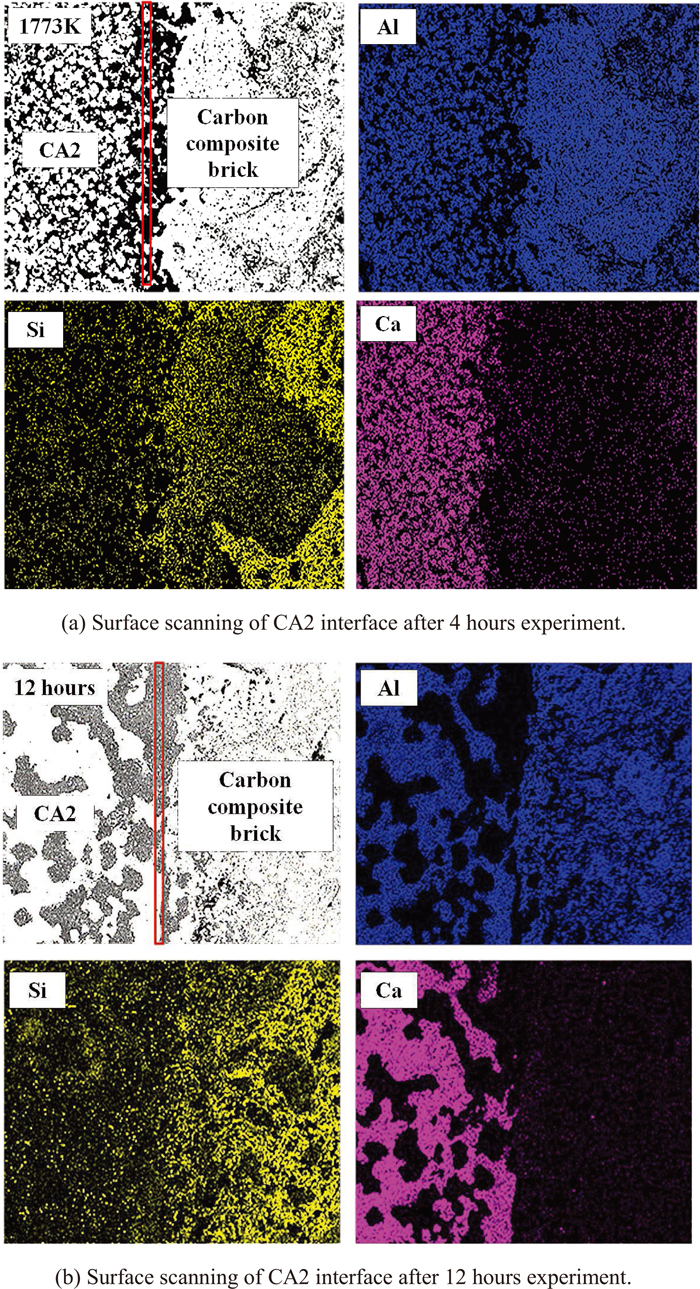
Surface scanning of the CA2 interface at different reaction time. (a) Surface scanning of CA2 interface after 4 hours experiment. (b) Surface scanning of CA2 interface after 12 hours experiment. (Online version in color.)
| Time, h | Carbon composite brick+CA | Carbon composite brick+CA2 | Carbon composite brick+CA6 |
|---|---|---|---|
| 4 | CA2, Al2O3 | CA6 | CA6, Al2O3 |
| 8 | CA, CA2, Al2O3 | CA6, Al2O3 | CA6, Al2O3 |
| 12 | Melilite, CA2, CA6, Al2O3 | CA6, Al2O3 | CA6, Al2O3 |
In order to reduce the erosion rate of carbon composite brick, experiments of coke ash and carbon composite brick at different temperatures were carried out, and the following results were found:
(1) The reaction between coke ash and carbon composite brick was observed in the experiments, and the reaction products were mainly CA2, CA6, and Al2O3. The compositions of the reaction products varied with temperature.
(2) Positive correlation was found between the mass change fraction and temperature. The mass change fraction of the CA assembly was greater than that of the CA2 assembly, which was greater than that of the CA6 assembly at 1773 K. The thickness of the reaction layer increased with an increase in temperature and Ca content, and the formed reaction layer remained stable after four hours. The thickness of the reaction layer of CA was significantly larger than that of CA2 and CA6, and the thickness of the reaction layer of CA2 was slightly larger than that of CA6.
(3) The diffusion rate of Ca2+ was significantly higher than that of Al3+ and Si2+, and Ca2+ diffusion played a key role in reaction. Cation diffusion was considered to be the rate determining step, and this was consistent with experimental results. Therefore, reducing the ash content of coke, especially the CaO in ash, is the key to reduce the erosion rate of carbon composite bricks below the centerline of taphole.
This work was financially supported by the Natural Science Foundation of China (51874025), the National Science Foundation for Young Scientists of China (51704019), Major Science and Technology Program for Water Pollution Control and Treatment (2017ZX07402001), supported by the Fundamental Research Funds for the Central Universities(FRF-BD-17-010A) and (FRF-TP-17-040A1).