Abstract
In this paper, a new Extreme Learning Machine (ELM) regression model of roll force and roll torque based on data-driven is proposed. The three-dimensional elastic-plastic finite element model (FEM) is established to solve the roll force and roll torque under different parameters (including rolling reduction rate, roll radius, rolling speed, average width of strip, entry temperature of strip). The regression model of ELM optimized by Particle Swarm Optimization (PSO) is established through using the datasets obtained by FEM. The PSO-ELM model prediction values of roll force and roll torque are compared with the single ELM and PSO-SVM model, and the error results of the prediction values are analyzed. The error results fully verify the feasibility and accuracy of the PSO-ELM model proposed. It is found that the new data-drive model of roll force and roll torque is simple in structure and it can make up for the deficiency of traditional mathematical mechanism model in dealing with nonlinear problems. The research result reveals that PSO-ELM method is suitable for parameters prediction and model optimization in strip rolling process.
1. Introduction
In the control system of hot strip rolling, the prediction accuracy of roll force and roll torque model play a key role in the calculation of rolling schedule, which directly affects the thickness accuracy of strip and the stability of strip piercing in finishing rolling area. The commonly used methods for calculating roll force and roll torque are engineering method, energy method, finite element method (FEM), boundary element method and artificial intelligence method. Karman was the first researcher to use engineering method to study the rolling force. He put forward the Karman equation named by his name which was based on the assumed condition of the rolling process, mechanical equilibrium equation, the plastic equation, the contact arc equation and friction law. Orowan1) assumed that sliding occurs when the friction force between the roll and the strip is less than the shear strength of the strip material, and adhesion occurs when the friction force is equal to the shear strength of the material. On this basis, the differential equation of the rolling unit pressure distribution was established combining the plate compression study of L.Prandtl. Sims2) developed analytical expressions of pressure distribution, roll force and roll torque by avoiding most of the numerical integration in Orowan’s theory. Ford and Alexander3) proposed a widely used rolling force model based on the modified Orowan model. The principle of the energy method is to establish the kinematically admissible velocity field and find the optimum solution satisfying the energy principle by mathematical method, so the stress distribution in the deformation zone is obtained, and the rolling force is calculated. Johnson4) used upper bound method to analyze the problem of hot strip rolling. Assuming that the material was ideal steel-plastic and plane deformation occurs, the slip line field was taken as kinematically admissible velocity field to calculate the power, and the contact pressure was obtained. Kobayashi5) and Kato6) tried to analyze the 3D rolling problem by using the stream function velocity field and the weighted velocity field, respectively. Liu7,8) used the stream function method to establish the vertical rolling shape and rolling force model, and he established the mathematical model of finishing rolling force based on the exponential velocity field. FEM is another commonly used method to study roll force and roll torque model. The FEM divides the research object into some small elements and obtains the global approximate solution by solving each element. Shangwu9) used three-dimensional FEM to simulate the hot rolling deformation process, and predicted the roll force, roll torque and unit contact pressure in the process of deformation. Moon and Lee10) proposed a FEM model to study the roll force and roll torque of plate rolling. Zhang and Cui11) established a three-dimensional thermo-mechanical coupled FEM model to study the parameters which influence roll force and strip output thickness. Although the FEM has become a powerful tool to solve various engineering problems, this method takes up large computer memory space and consumes a lot of time. The boundary element method is different from the FEM in dividing the element. Only the boundary of the solving area is divided. The function satisfying the governing equation is used to approximate the boundary condition and the approximate solution of the boundary is solved, then the point that needs to be solved internally is solved. Its characteristic is that the unknown number of the unit is less. In recent years, with the development of science and technology, artificial intelligence methods such as expert system, neural network and fuzzy control are also applied in rolling force and torque prediction and other problems. Siemens AG had used neural network to forecast the rolling force in industrial application.12) Pican13) used neural network to predict rolling force in temper rolling and achieved good results. Jeon and Kim14) designed a neural network algorithm to calculate the appropriate rolling force and torque before the strip entered the rolling mill and the application of this design optimized the rolling process. In general, the application of artificial intelligence in strip rolling is still in the research and development stage, which will be a new direction and trend in the field of manufacturing.
This paper attempts to establish a data-driven roll force and roll torque model to replace the traditional mathematical mechanism model to solve the complicated problems of multi-variables, strong coupling and nonlinearity in the rolling process. The structure of this paper is arranged as follows. In section 2, a 3D rolling model is established by FEM. The influence of different rolling parameters on rolling force and rolling torque are analyzed simply by solving the model. Section 3 introduces the theory of ELM and PSO algorithm and proposes hybrid PSO-ELM model based on ELM and PSO. In section 4, the experimental results are analyzed and discussed and the superiority of the PSO-ELM model is fully vindicated. Section 5 is the paper’s conclusions.
2. Influence Rules of Rolling Pressure and Roll Torque in Different Conditions
2.1. Establishment and Verification of 3D FEM Model for Rolling
In the actual production process, the rolling conditions are changeable, which is very inconvenient to study the influence parameters of rolling on roll force and roll torque. FEM can be used flexibly to set parameters of hot rolling model according to the research needs, simulate various experimental scheme, reduce test time and funds. Therefore, the FEM is used to solve the corresponding roll force and roll torque under different rolling parameters. A data-driven model of roll force and torque is established by using a large number of data obtained by FEM under various rolling parameters.
In the hot rolling process, back-up rolls have little effect on the roll force and torque, so, a simplified three-dimensional elastic-plastic FEM model composed of work rolls and strip steel is established in this paper. The model meets the needs of the research content, reduces the workload of modeling and saves the time of simulation calculation. The strip material is Q235, and the work-roll material is alloy forging steel. The strip and work-roll are set to the elastic plastic body and the rigid body, respectively. The parameters of the material model are shown in Table 1. The geometry of the sheet and work rolls are shown in Fig. 1. The rolling parameters used in the experiment are shown in Table 2. The variation curves of rolling force with time under different reduction are shown in Fig. 2.
Table 1. Material and geometry of models in FEM.
| Items | Strip | Work-roll |
|---|
| Material model | Bilinear elastic-plastic
isotropic hardening material | Rigid material |
| Density/kg·m−3 | 7850 | 7850 |
| Elasticity modulus/GPa | 207 | 210 |
| Poisson’s ratio | 0.362 | 0.33 |
| Length/mm | 750 | 400 |
Table 2. Condition of hot rolling experiments employed for the simulation.
| Reduction. (%) | Roll radius (mm) | Roll speed (m/s) | Strip width (mm) | Roll temperature (°C) |
|---|
| 10 | 100 | 2 | 650 | 870 |
| 15 | 150 | 3 | 750 | 900 |
| 20 | 200 | 4 | 850 | 930 |
| 25 | 250 | 5 | 950 | 960 |
| 30 | 300 | 6 | 1050 | 990 |
| 35 | 350 | 7 | 1150 | 1020 |
| 40 | 400 | 8 | 1250 | 1050 |
In order to verify the validity of the FEM, several groups of calculation results of traditional mathematical model of rolling force are collected, and the calculated data of the FEM model are compared with the mathematical model results data. The results of comparison are shown in Fig. 3. Because of the roll flattening and bouncing in hot rolling, the reduction of FEM simulation can only be close to the actual value. The rolling forces calculated by FEM are slightly higher than the measured ones, but the errors are less than 10.71%.
2.2. Distribution of Rolling Pressure in Different Process Parameters
The rolling force model of hot strip rolling is a typical nonlinear engineering problem. In order to better study the effect of a certain parameter on the rolling force, we select two parameters as independent variables and the unit width rolling force as the function result to draw the rolling force surface under different parameters with the data obtained by finite element solution. As shown in Fig. 4. Figures 4(a) and 4(e) indicate that reduction and radius of work roll are the dominant parameters for the rolling force, and the roll force rises observably as the reduction or radius of work roll increases. However, the effect of rolling speed on the rolling force is not significant. The rolling force will increase slowly with the rolling speed, and the increase of strip width will increase the total rolling force, but will not cause the rolling force to change on the unit width of strip. Rolling temperature has a negative correlation and rolling force decreases as the rolling temperature increases.

In the same way, the influence of different parameters on rolling torque is also studied. The rolling torque surface drawn from FEM is shown in Fig. 5. It can be seen from the Fig. 5 that the rolling torque rises as the increase of strip width, work roll radius and rolling speed. It will decrease as the increase of rolling temperature, because in the rolling temperature range studied in this paper, the deformation resistance of strip steel decreases gradually with the increase of temperature. Based on the above analysis, it can be concluded that the results of rolling force and rolling torque solved by FEM are accurate and feasible in both numerical and physical sense.
3. Brief Description of ELM and PSO Algorithm
3.1. Principle of ELM
Single-hidden Layer Feedforward Neural Network (SLFN) has been widely used in many fields due to its good learning ability. However, this method has the disadvantages of slow training speed, easy to fall into local minima and sensitivity to learning rate selection. Therefore, it is a trend of research in recent years to study a training algorithm with high training speed, global optimal solution and good generalization performance. The ELM adopts a new SLFN algorithm proposed by Huang.15,16,17,18) The algorithm randomly generates the connection weights between the input layer and the hidden layer and the biases value of the hidden layer neuron, and needs no adjustment during the training process, and only needs to set the number of the hidden layer neurons, so that the unique optimal solution can be obtained.
Consider N arbitrary distinct samples
(
X
i
,
t
i
)∈
R
n
×
R
m
, Xi = [xi1,xi2,...,xin]T, ti = [ti1,ti2,...,tim]T. If a SLFN with L hidden nodes can approximate these N samples with zero error, it then implies that there exist βi and bi such that
|
∑
i=1
L
β
i
g(
W
i
⋅
X
j
+
b
i
)=
o
j
,j=1,2
,...,N
| (1) |
where
βi is the output weight,
bi is the learning parameters of the hidden nodes,
g(
x) is the activation function and
Wi is the connection weights for the input layer and the hidden layer
Wi = [
wi1,
wi2,…,
win]
T.
The goal of learning in a single hidden layer network is to minimize the error of the output, which can be expressed as
|
∑
j=1
N
‖
o
j
-
t
j
‖
=0
| (2) |
This means the existence of
βi,
Wi and
bi so that
Eq. (3) holds.
|
∑
i=1
L
β
i
g(
W
i
⋅
X
j
+
b
i
)=
t
j
,j=1,2
,...,N
| (3) |
A matrix can be represented as
where
|
H(
W
1
,...,
W
L
,
b
1
,...,
b
L
,
X
1
,...
X
L
)
=
[
g(
W
1
⋅
X
1
+
b
1
)
...
g(
W
L
⋅
X
1
+
b
L
)
⋮
...
⋮
g(
W
1
⋅
X
N
+
b
1
)
...
g(
W
L
⋅
X
N
+
b
L
)
]
N×L
| (5) |
|
β=
[
β
1
T
⋮
β
L
T
]
L×m
| (6) |
|
T=
[
T
1
T
⋮
T
N
T
]
N×m
| (7) |
According to ELM theories,16,17) all the hidden nodes can be randomly assigned instead of being tuned. The solution of Eq. (4) is estimated as:
|
β
˜
=
min
β
‖
Hβ-T
‖=
H
+
T
| (8) |
Where
H+ is the Moore-Penrose generalized inverse of the implicit layer output matrix
H.
3.2. Principle of PSO
PSO was proposed by Kennedy and Eberhart19) in 1995, which originated from the study of bird predation behavior. The particle has only two properties: velocity V and position X. velocity represents the speed of movement and position represents the direction of movement. Each particle searches the optimal solution separately in the search space, and its extreme value is recorded as the current individual extremum Pbest, the individual extremum is shared with other particles in the whole particle swarm. In this way, the current global optimal solution Gbest of the entire particle swarm is found. All particles in the particle swarm adjust their velocity and position according to the current individual extremum Pbest found by themselves and the current global optimal solution Gbest shared by the whole particle swarm. The whole process is divided into: initialize particle swarm; evaluate particle; calculate fitness value; find individual extremum; find global optimal solution; modify the velocity and position of particle, and the update formula for velocity and position during optimization are as follows
|
V
id
k+1
=w
V
id
k
+
C
1
rand(0,1)(
P
id
k
-
X
id
k
)
+
C
2
rand(0,1)(
P
gd
k
-
X
id
k
)
| (9) |
|
X
id
k+1
=
X
id
k
+
V
id
k+1
| (10) |
where the
w is inertial factor,
C1 and
C2 are called the acceleration constant,
rand(
0,
1) is random number belong to 0–1,
Pid represents the
dth dimension of the individual extremum of the
ith variable,
Pgd represents the
dth dimension of the global optimal solution and
k represents the number of iterations.
Standard 2011 PSO algorithm has been used in this paper, it involves some improvements in the implementation,20,21,22,23,24,25) and PSO basic parameters are set as Table 3.
Table 3. The parameters used in PSO.
| Parameters | Values |
|---|
| Size of population | 100 |
| Inertia weight |
1
2ln2
|
| Acceleration factors | C1 = C2 = ln2 + 0.5 |
| Number of iterations | 50 |
In the second part, it is found that the FEM is feasible to obtain the sample data needed for the ELM model. According to the research needs of this paper, reduction, roll radius, roll speed, strip width and roll temperature are taken as the input variables of the ELM model, and the rolling force and the rolling torque are taken as the output variables of the ELM model. The structure of ELM model established is shown in Fig. 6. All samples data are generated by the control variate method. In science researches, the control variate method is often used to study the influence of each independent variable on dependent variables. The specific operation is to change the value of one independent variable in order to determine the effect of this independent variable on the dependent variable under the condition that the other independent variables are invariant. In this paper, the FEM is used to solve the rolling force and rolling torque under different rolling parameters, and each independent variable has a default value. The bold type value in Table 2 represents the default value of this independent variable. In each group of FEM experiments, two independent variables are selected as the object of study, and the other three independent variables are set as default values. The value of independent variables selected as the object of study is divided into 7 levels to change. So, there are
C
5
2
=10
groups of FEM experiments, and each group of experiments includes 7 × 7 = 49 experiments. The 490 samples data of rolling force and rolling torque will be obtained. The data obtained by FEM is divided into training set and testing set. The training set sample is used to build the model of the ELM, and the testing set sample is used to test the model generalization performance. All samples are normalized before input ELM. All the sample data is normalized to [−1,1].26,27) The normalized mapping methods are used as follows
|
x
i
'
=2×
x
i
-min(
x
i
)
max(
x
i
)-min(
x
i
)
+(-1),i=1,2,3,...,m
| (11) |
where max(
xi) and min(
xi) are the maximum and minimum number of data sequences.

Because the initial weights and biases of the ELM are generated randomly, the generalization performance of the network is difficult to reach the optimum. To address this problems, and then improve its generalization performance, PSO algorithm is used to optimize the initial weights and biases of ELM. Firstly, the swarm of PSO particles are randomly initialized. Each particle is composed of all the elements to be optimized which are the input weights and hidden biases that represent a candidate ELM. Secondly, the fitness of each particle in the swarm is calculated. The individual and global extremum under current conditions are recorded. Thirdly, adjusting particle velocity and position according to Eqs. (14) and (15). Fourthly, calculate the fitness of each particle after update the velocity and position, and the individual extremum and global extremum under the current condition are recorded again. Finally, all previous steps except the first one are repeated for a predefined number of iterations. The detailed process can be illustrated as shown in the flowchart in Fig. 7.

After model training, the generalization performance of PSO-ELM model is tested by error criteria. The calculation formulas of each error criteria are as follows:
|
R
2
=1-
∑
i=1
n
(
y
i
-
y
i
*
)
2
∑
i=1
n
(
y
i
-
y
¯
)
2
, (
y
¯
=
1
n
∑
i=1
n
y
i
)
| (12) |
|
MAE=
1
n
∑
i=1
n
|
y
i
-
y
i
*
|
| (13) |
|
MAPE=
1
n
∑
i=1
n
|
y
i
-
y
i
*
y
i
|
⋅100%
| (14) |
|
RMSE=
∑
i=1
n
(
y
i
-
y
i
*
)
2
n
| (15) |
4. Results and Discussion
In this section, in order to show how PSO-ELM performs, we have carried out experiments on a computer running 64-bit Windows 7 with a 2.6 GHz processor and 8 GB memory. The algorithm is implemented by MATLAB language.
The performance of the proposed PSO-ELM model and the other two comparison models were plotted in Fig. 8, for both rolling force and rolling torque, on training and testing data respectively. It can be seen from the Fig. 8 that the regression effect of using ELM algorithm model is obviously better than that of SVM algorithm. No matter the rolling force or the rolling torque, the determination coefficient of PSO-SVM is not above 0.985 both on the training set and testing set, and the determination coefficient is all above 0.999 in the model of ELM, which fully shows that under the research background of this paper, ELM has more advantages than SVM. The essence of ELM and SVM algorithm is to map the problem to high-dimensional space, and then make regression in high-dimensional space. In principle, the effect of regression is directly influenced by the way of mapping. If a key pattern shows obvious difference in high dimensional space, the effect of regression is good. If this critical pattern does not appear in the high-dimensional space, the regression effect is poor. The reason why ELM is superior to SVM is that ELM can be projected to higher dimensions in an infinite number of ways, and it trains very quickly. This algorithm can select a better part of the ELM to enhance the effect of regression. In the case of SVM, once the kernel function of SVM is determined, the mapping mode is only determined, and the possibility of other effects can be obtained only if another kernel function is selected. In addition, SVM training speed is slow. So, compared with ELM, the performance of SVM is slightly inferior.
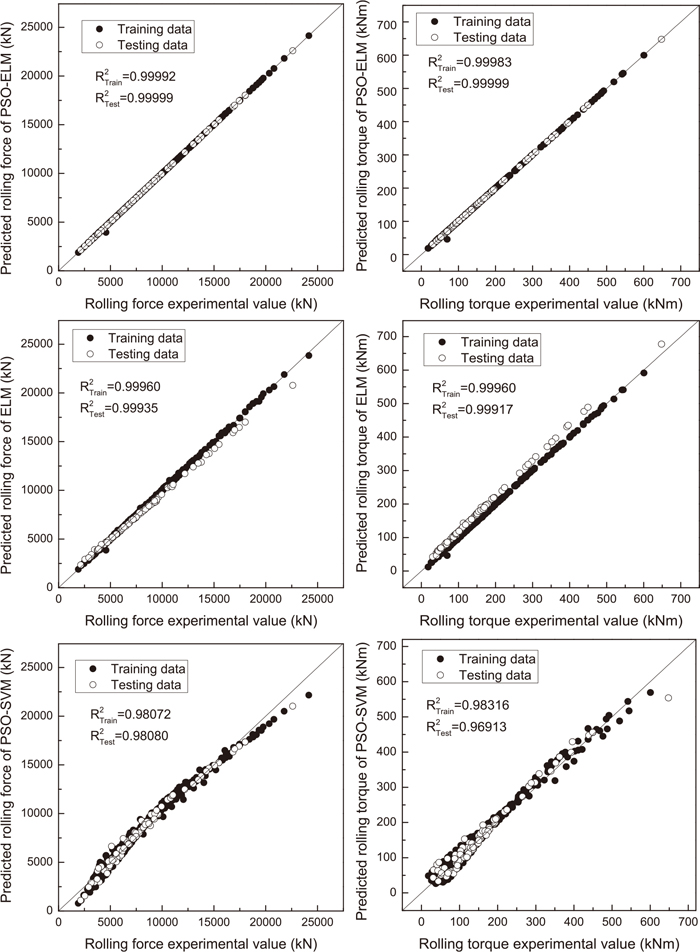
With respect to ELM algorithm, after the PSO algorithm optimizes the initial weights and biases of ELM, the regression effect of the model is improved significantly. As aforementioned, a high prediction capability was achieved for both training and testing data sets of roll force and roll torque even though the latter was not used for the training of the PSO-ELM model. Therefore, the PSO-ELM model appears to have a high generalization capability.
Comparison of the three models predicted roll force and roll torque with respect to FEM experimental values of training set and test set are given in Fig. 9. Figure 10 demonstrates the percentage error deviations of predicted roll force and roll torque using three models from FEM experimental results. The difference of prediction accuracy between the three models cannot be seen intuitively from Fig. 9. So, the relative error in the prediction models are chosen to be compared. Figure 10 shows clearly the difference between the relative error indices of PSO-ELM, single ELM and PSO-SVM models. For PSO-SVM model, the relative error of rolling force prediction is larger than that of ELM and PSO-ELM models, the reference range is y = ±20% and most of the samples are in error range. However, there are scattered outliers whose relative errors exceed ±20% of the error lines. The prediction effect of rolling torque based on PSO-SVM model is worse than that of rolling force and the local outliers are above the relative error line of ±25%. For the single ELM model, the relative error accuracy of the prediction results has been significantly improved compared with that of PSO-SVM. From the prediction effect of rolling force, the relative error is within ±15% of both the training set and the testing set. As far as the prediction effect of rolling torque is concerned, the accuracy of other samples is still within a reasonable range except that a few abnormal values on the test set exceed 25% error line. In particular, it should be pointed out that the relative error fluctuation of ELM model on training set is very small, the prediction accuracy is very high and all of them are within ±5%. But on testing set, the relative error fluctuation amplitude is large, and the prediction accuracy is also greatly reduced, the main reason for this phenomenon is that the training set samples are used in the modeling process of the data-driven model whether it’s predicting rolling force or rolling torque, but the testing set sample data are not involved in the modeling. Therefore, the prediction accuracy of the testing set is reduced, which also shows that the single ELM algorithm model exists over-fitting resulting in inadequate generalization performance. To address these problems, the single ELM model is optimized by PSO. The relative error of the optimization model is also presented in Fig. 10, it shows the relative error of PSO-ELM model is very small in terms of the prediction effect of rolling force or rolling torque, and the prediction effect of training set and testing set is also very excellent, all of them are near the straight line of y = 0%. This fully shows that the generalization performance of the ELM model optimized by PSO is greatly improved and meets the practical application requirements.

In order to evaluate the generalization performance of each model more synthetically and quantitatively, MAE, MAPE and RMSE are also used as the error index to analyze the models. Table 4 lists the calculated values of the three kinds of errors. Figure 11 is a more intuitive histogram of the three errors distribution drawn from the results of the calculation. From Table 4 and Fig. 11, the following can be analyzed.
Table 4. Analysis of the predictions given in
Fig. 11.
| Training | Testing |
|---|
| Roll force | Roll torque | Roll force | Roll torque |
|---|
| R2 | PSO-ELM | 0.99992 | 0.99983 | 0.99999 | 0.99999 |
| ELM | 0.99960 | 0.99960 | 0.99935 | 0.99917 |
| PSO-SVM | 0.98072 | 0.98316 | 0.98080 | 0.96913 |
| MAE | PSO-ELM | 11.0038 | 0.5164 | 4.1656 | 0.2655 |
| ELM | 49.8915 | 1.3086 | 303.1161 | 20.4076 |
| PSO-SVM | 468.2154 | 11.7260 | 443.6868 | 14.4773 |
| MAPE (%) | PSO-ELM | 0.1856 | 0.5430 | 0.0588 | 0.2305 |
| ELM | 0.6994 | 1.3564 | 3.4994 | 16.3247 |
| PSO-SVM | 6.8194 | 10.8226 | 6.9560 | 14.5969 |
| RMSE | PSO-ELM | 34.4303 | 1.3389 | 5.8771 | 0.38401 |
| ELM | 76.8788 | 2.0598 | 416.8847 | 21.4624 |
| PSO-SVM | 565.6218 | 14.3996 | 558.1674 | 19.0492 |

When comparing the single ELM model with the hybrid PSO-SVM model, the advantage of ELM model is not obvious. On the training set, the three error indexes of rolling force and rolling torque prediction of ELM model are evidently smaller than that of PSO-SVM model, on the test set, each index of rolling force prediction of the former is still superior to that of the latter, but the effect of rolling torque prediction shown by data is opposite. When comparing the PSO-ELM model with single ELM model, the performance of the PSO-ELM model is better than that of the single ELM model. The MAE prediction error of PSO-ELM model are smaller than that of single ELM model both in training set and test set, the MAPE and RMSE error indexes of the models also have the same law. The above results fully show that the PSO algorithm have promoted the prediction ability of single ELM. The reason for this phenomenon is that the PSO algorithms select the optimal initial weights and biases for the establishment of SLFN. When comparing the PSO-ELM model with the PSO-SVM model, the performance of PSO-ELM model far exceeds that of PSO-SVM model. Both model is optimized by PSO, the performance of ELM model has been improved significantly, but SVM is not ideal, which shows that the data-driven model based on ELM and PSO algorithm can accurately predict the rolling force and rolling torque in hot strip rolling process.
5. Conclusions
This paper presented an approach based on Particle Swarm Optimization (PSO) and Extreme Learning Machines for training Single hidden Layer Feedforward Networks (SLFN) to establish a data-driven roll force and roll torque prediction model. A three-dimensional finite element model was developed and verified to provide a data set for training and validation of the SLFN. The proposed PSO-ELM model utilizes the PSO algorithm to optimize the input weights and hidden biases of SLFN. The performance of PSO-ELM was evaluated using determination coefficient, relative error, mean absolute error (MAE), mean absolute percentage error (MAPE), and root mean square error (RMSE). Comparing the prediction results of the PSO-ELM model with the results established by single ELM and PSO-SVM under the same conditions, and the prediction accuracy and generalization capability of the proposed PSO-ELM model better than others was demonstrated. In short, the PSO-ELM is an effective and useful machine learning tool to replace the traditional mathematical mechanism model to solve the complicated problems of multi-variables, strong coupling and nonlinearity in hot strip rolling process.
Acknowledgments
This work was supported by National Key R&D Program of China (2017YFB0304100), National Natural Science Foundation of China (51704067, 51774084, 51634002), The Fundamental Research Funds for the Central Universities (N170708020), The Open Research Fund from the State Key Laboratory of Rolling and Automation, Northeastern University, Grant No.: 2017RALKFKT009.
References
- 1) E. Orowan: Proc. Inst. Mech. Eng., 150 (1943), 140.
- 2) R. B. Sims: Proc. Inst. Mech. Eng., 168 (1954), 191.
- 3) H. Ford and J. M. Alexander: J. Inst. Met., 92 (1964), 397.
- 4) W. Johnson and H. Kudo: Int. J. Mech. Sci., 1 (1960), 175.
- 5) S. I. Oh and S. Kobayashi: Int. J. Mech. Sci., 17 (1975), 293.
- 6) K. Kato, T. Murota and T. Kumajai: J. Jpn. Soc. Technol. Plast., 21 (1980), 359 (in Japanese).
- 7) Y. M. Liu, D. H. Zhang, D. W. Zhao and J. Sun: Int. J. Adv. Manuf. Technol., 82 (2016), 1153.
- 8) Y. M. Liu, G. S. Ma, D. W. Zhao and D. H. Zhang: Int. J. Mech. Sci., 98 (2015), 126.
- 9) S. Xiong, J. M. C. Rodrigues and P. A. F. Martins: Finite Elem. Anal. Des., 32 (1999), 221.
- 10) C. H. Moon and Y. Lee: ISIJ Int., 48 (2008), 1409.
- 11) J. Zhang and Z. Cui: J. Cent. South Univ. Technol., 18 (2011), 16.
- 12) T. Poppe, D. Obradovic and M. Schlang: Siemens Rev., 4 (1995), 24.
- 13) N. Pican, F. Alexandre and P. Bresson: IEEE Expert, 11 (2002), 22.
- 14) E. C. Jeon and S. K. Kim: J. Korean Soc. Mach. Tool Eng., 9 (2000), 7.
- 15) Q. Y. Zhu, A. K. Qin, P. N. Suganthan and G. B. Huang: Pattern Recognit., 38 (2005), 1759.
- 16) G. B. Huang, Q. Y. Zhu and C. K. Siew: 2004 IEEE Int. Joint Conf. on Neural Networks, IEEE Press, New York, (2004), 985.
- 17) G. B. Huang, Q. Y. Zhu and C. K. Siew: Neurocomputing, 70 (2006), 489.
- 18) Y. Lan, Z. Hu, Y. C. Soh and G. B. Huang: Neural Comput. Appl., 22 (2013), 417.
- 19) R. Eberhart and J. Kennedy: Proc. 6th Int. Symp. on Micro Machine and Human Science (MHS’95), IEEE Press, New York, (1995), 39.
- 20) A. E. Olsson: Particle Swarm Optimization: Theory, Techniques, and Applications, Nova Science Publishers, New York, (2010), 213.
- 21) J. Zhang, C. Zhang, T. Chu and M. Perc: PLoS One, 6 (2011), e21787.
- 22) M. Perc and A. Szolnoki: Biosystems, 99 (2009), 109.
- 23) A. Subasi: Comput. Biol. Med., 43 (2013), 576.
- 24) A. Selakov, D. Cvijetinović, L. Milović, S. Mellon and D. Bekut: Appl. Soft Comput., 16 (2014), 80.
- 25) Z. H. Wang, Y. M. Liu, D. Y. Gong and D. H. Zhang: Steel Res. Int., 89 (2018), 1800003.
- 26) F. Han, H. F. Yao and Q. H. Ling: Neurocomputing, 116 (2013), 87.
- 27) P. Niu, Y. Ma, M. Li, S. Yan and G. Li: Neural Process. Lett., 44 (2016), 813.


