Abstract
The effects of the crosshead speed, hydrogen content and temperature on fracture strength and fracture surface morphology were investigated using a tempered martensitic steel containing 1.67 mass% of Si (H-Si) and one containing 0.21 mass% of Si (L-Si). When L-Si specimens were charged with a small amount of hydrogen, fracture surfaces showed a transition from quasi-cleavage (QC) to intergranular-like (IG-like) to intergranular (IG) at room temperature. In contrast, when H-Si specimens were charged with a small amount of hydrogen, fracture surfaces showed a transition from QC to IG-like at room temperature. This transition in the fracture surface morphology can be explained by the magnitude relationship between intergranular and transgranular strengths under hydrogen charging. At a temperature of −196°C, hydrogen did not lower the fracture strength nor did it change the fracture surface morphology. Hence, hydrogen embrittlement at room temperature was presumably caused by hydrogen accumulation and lattice defect formation during stress application as well as by hydrogen trapped before stress was applied. Fracture strength decreased and converged to a constant value (lower critical stress) with decreasing crosshead speed. The crosshead speed for obtaining lower critical stress decreased as the fracture surface changed from IG to IG-like to QC. Therefore, the crosshead speed for obtaining lower critical stress should not be treated as a constant but should be determined experimentally for each type of fracture surface.
1. Introduction
Quasi-cleavage (QC)1,2,3) and intergranular (IG)4,5) features are known as the fracture surfaces on tempered martensitic steels caused by hydrogen embrittlement on the basis of a number of studies. Although a consensus has not necessarily been obtained, brittle mechanisms5,6,7,8,9,10) including the lowering of cohesive energies6) have been proposed as the mechanism of IG fracture. Ductile ones such as the accumulation11,12,13) of hydrogen-enhanced strain-induced lattice defects in the matrix grains or hydrogen-enhanced localized-plasticity14,15,16,17) have been proposed as the mechanisms of QC fracture.
Relative evaluation methods for comparing hydrogen embrittlement susceptibility among steels18,19) and absolute ones for judging which steels can be used safely in actual environments20,21) have been developed to date. The variables in the testing methods are the hydrogen content and the conditions regarding stress application, without considering differences in fracture morphologies such as IG or QC. In other words, the testing conditions have not changed regardless of the fracture surface morphology, although hydrogen embrittlement results from the nature of materials, hydrogen and stress.22) It has been reported that the evaluation results obtained by conventional strain rate tests (CSRT) and those by slow strain rate tests (SSRT) were consistent,23) whereas another study has shown that they were not consistent.24) One of the reasons for this disagreement is the difference in fracture surface morphologies, i.e., if IG fracture mainly occurs, the results would be consistent between SSRT and CSRT. If QC fracture mainly occurs, on the other hand, the results would not be consistent.24) Moreover, the authors reported that fracture strength reduction by hydrogen was enhanced by hydrogen precharging before constant load tests when QC fracture mainly occurred,1) while the effect of hydrogen precharging was small if IG fracture mainly occurred.4) The difference in the stress application after hydrogen precharging and hydrogen charging after stress application, i.e., the effect of the difference between “dislocation slip with hydrogen” and “dislocation slip without hydrogen” on fracture strength suggests that the mechanisms of QC fracture and IG fracture are different. It is important for evaluating hydrogen embrittlement susceptibility and for developing new materials in the future to understand the reasons why the fracture surface morphology shows a transition in various parameters and to find the common and unique features of each evaluation method.
In the present study, materials exhibiting QC fracture and those exhibiting IG fracture due to hydrogen charging were prepared. Their tensile strengths were almost the same because the Si content and tempering temperature were changed so as to control cementite precipitation morphologies and stability of dislocation structures.18) In addition, both types of steel showed intermediate fracture between IG and QC under some testing conditions. The intermediate fracture surface morphology had a large number of tear ridges on intergranular facets, and it was categorized and referred to as “intergranular-like (IG-like)” fracture.25) The hydrogen content, crosshead speed and test temperature were then varied as parameters in order to obtain fundamental knowledge regarding hydrogen embrittlement susceptibility and the transition in fracture surface morphologies. On the basis of the obtained findings, the reasons for the reduction in the fracture strength and the transition in the fracture surface morphology were considered. The concepts of “intergranular strength and transgranular strength”, which refer to the fracture strength of grain boundaries and that of the matrix, respectively, were introduced in order to discuss these points from the viewpoint of microstructure and hydrogen behavior under stress application. Moreover, testing conditions for evaluating hydrogen embrittlement susceptibility of steels having different fracture surface morphologies are discussed.
2. Experimental
2.1. Materials
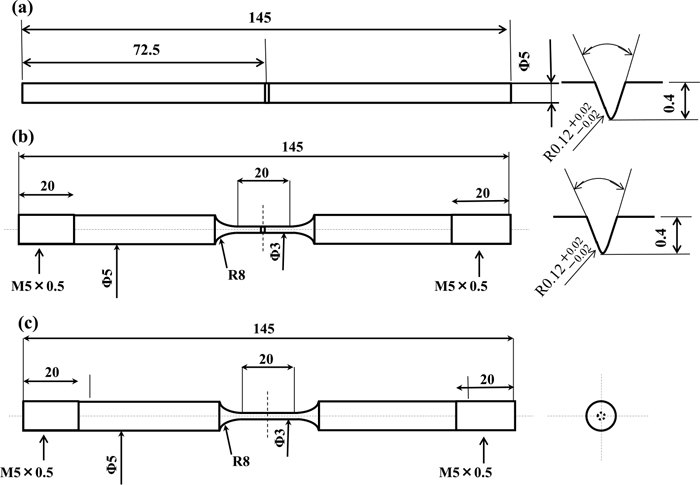
Induction quenched and tempered martensitic steels were prepared as specimens. Table 1 shows the chemical composition of the tested materials. Steel containing Si of 1.67 mass% (H-Si) and one containing Si of 0.21 mass% (L-Si) were prepared in order to control the stability of the dislocation structure and carbide precipitation morphology. The H-Si steel was induction quenched at a temperature of 1020°C and induction tempered at a temperature of 495°C while the L-Si steel was induction quenched at a temperature of 960°C and induction tempered at a temperature of 350°C. Figure 1 shows the microstructures of specimens observed by scanning electron microscopy (SEM) and transmission electron microscopy (TEM).18) In the L-Si steel, thick plate-like cementite precipitated on prior-austenite (γ) grain boundaries as denoted by the white lines. In contrast, thick plate-like cementite was not present on prior-γ grain boundaries in the H-Si steel, but finer cementite precipitated both on grain boundaries and in the matrix. The H-Si steel displayed 0.2% proof stress and tensile strength of 1437 MPa and 1490 MPa, respectively. The corresponding values of the L-Si steel were 1330 MPa and 1462 MPa, respectively. For evaluating hydrogen embrittlement susceptibility at a temperature of 30°C, round bar specimens notched circumferentially were prepared as shown in Fig. 2(a). The notch was machined to a depth of 0.4 mm using a lathe. For evaluating hydrogen embrittlement susceptibility at the temperature of liquid nitrogen (−196°C), round bar specimens with a parallel part were prepared as shown in Figs. 2(b) and 2(c) in order to avoid fracture at positions other than at that part such as at a chuck portion. Fracture could occur easily since the gage portion had higher tensile strength because of immersion into liquid nitrogen. The gage diameter and length were 3 mm and 20 mm, respectively. Figure 2(b) shows a circumferentially notched specimen. Figure 2(c) is a specimen without a notch. The gage diameter and length of the specimen were 3 mm and 20 mm, respectively.
Table 1. Chemical composition of specimens (mass%).
| C | Si | Mn | P | S |
|---|
| H-Si | 0.32 | 1.67 | 0.75 | 0.014 | 0.005 |
| L-Si | 0.30 | 0.21 | 0.72 | 0.019 | 0.002 |
Round bar specimens of 5 mm in diameter and notched circumferentially as shown in Fig. 2(a) were used to evaluate hydrogen embrittlement susceptibility at a temperature of 30°C. After the surface of the specimens was polished with #800 emery paper, hydrogen precharging was conducted by cathodic electrolysis at a current density of 0.5 to 150 A·m−2 in a 0.1 N NaOH aqueous solution at a temperature of 30°C and containing a NH4SCN additive of 5 g·L−1. L-Si and H-Si steel specimens were charged with hydrogen for 96 h and 72 h respectively so that the hydrogen content reached equilibrium at the surface and the center of the specimens. Round bar specimens with a gage diameter of 3 mm at the parallel part as shown in Figs. 2(b) and 2(c) were used to evaluate hydrogen embrittlement susceptibility at a temperature of −196°C. Specimens were precharged with hydrogen by cathodic electrolysis at a current density of 100 A·m−2 in a 0.1 N NaOH aqueous solution at a temperature of 30°C and containing a NH4SCN additive of 3 g·L−1. Both types of specimen were charged with hydrogen for 72 h so that the hydrogen content reached equilibrium at the surface and the center of the specimens.
The hydrogen content and state were analyzed by thermal desorption analysis (TDA) using a gas chromatograph. The specimens charged with hydrogen were degreased with acetone and immediately immersed in liquid nitrogen until starting TDA in order to prevent hydrogen from dissipating. The specimens were taken from liquid nitrogen and put into a quartz tube in the furnace. TDA was then conducted at a heating rate of 100°C·h−1 from room temperature.
2.3. Evaluation of Hydrogen Embrittlement Susceptibility
The hydrogen-charged and uncharged specimens shown in Fig. 2(a) were subjected to tensile tests at a temperature of 30°C at a crosshead speed of 0.0025 to 50 mm·min−1. The hydrogen-precharged specimens were charged with hydrogen during the tensile test under the same conditions as precharging to maintain their hydrogen content. Nominal stress, σ, was defined as σ = F/Amin, where F was the tensile load and Amin was the initial net cross-sectional area of the notch in the specimens.
The hydrogen-charged and uncharged specimens shown in Figs. 2(b) and 2(c) were subjected to tensile tests in liquid nitrogen at a temperature of −196°C at a crosshead speed of 0.05 mm·min−1. Hydrogen charging during the tensile test was not conducted since hydrogen was considered to hardly dissipate at −196°C. The fracture surfaces after the tensile tests were observed by SEM.
3. Results
3.1. Hydrogen Embrittlement Susceptibility and Fracture Morphology
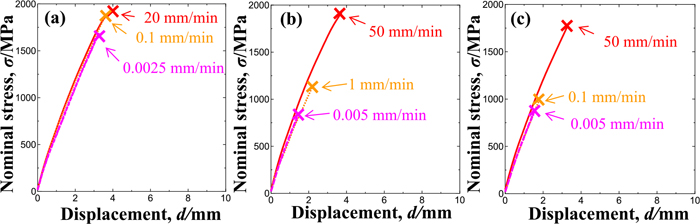
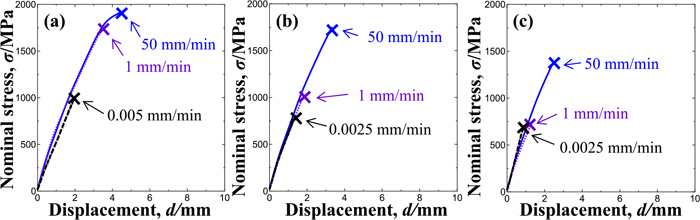
Figure 3 shows the nominal stress-displacement curves obtained in tensile tests of H-Si steel specimens at various crosshead speeds at a temperature of 30°C under various hydrogen contents and precharging conditions of (a) 0.1 mass ppm (current density of 0.5 A·m−2), (b) 1.6 mass ppm (10 A·m−2) and (c) 7.0 mass ppm (100 A·m−2) of hydrogen. The fracture strength decreased with the increasing hydrogen content and decreasing crosshead speed. Figure 4 shows the nominal stress-displacement curves obtained in tensile tests of L-Si steel specimens at various crosshead speeds at a temperature of −30°C under hydrogen charging following precharging of (a) 0.2 mass ppm (current density of 1 A·m−2), (b) 1.9 mass ppm (5 A·m−2) and (c) 5.4 mass ppm (150 A·m−2) of hydrogen. The fracture strength of these specimens also decreased with the increasing hydrogen content and decreasing crosshead speed.
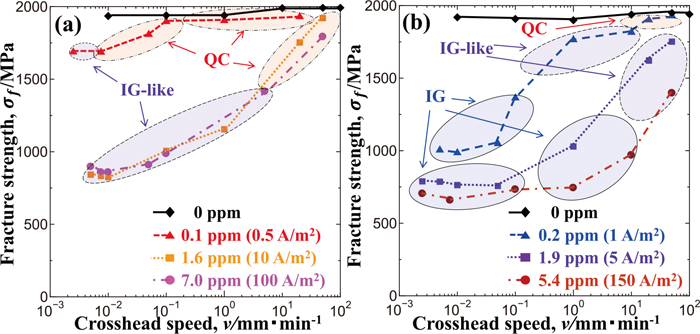
The relationships between fracture strength and crosshead speed shown in Figs. 3 and 4 are summarized in Fig. 5. The relationships displayed by the uncharged specimens are also shown for comparison. While uncharged L-Si and H-Si steel specimens did not show crosshead speed dependence of fracture strength, the fracture strength of the hydrogen-charged specimens declined with decreasing crosshead speed and converged to a constant value, so-called lower critical stress, at crosshead speeds lower than a certain particular value. The particular crosshead speed of the H-Si steel specimens was 0.0075 mm·min−1 when charged with hydrogen of 0.1 mass ppm and 0.01 mm·min−1 when hydrogen of 1.6 and 7.0 mass ppm was charged. In contrast, the speeds found for the L-Si specimens were 0.01, 0.05 or 1 mm·min−1 when hydrogen of 0.2, 1.9 or 5.4 mass ppm was charged, respectively. In summary, L-Si steel specimens displayed lower critical stress at higher crosshead speeds than H-Si steel specimens did.

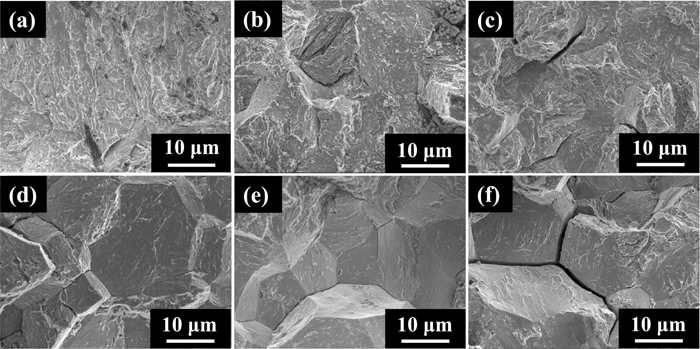
Figure 6 shows fractographs of the L-Si and H-Si steels in Fig. 5 obtained in tensile tests at a crosshead speed of 0.01 mm·min−1. Since circumferentially notched specimens were used in the present study, multiple possible crack initiation points were present along the notch tip. Because the actual crack initiation points could not be detected, the typical area near the notch tip is shown there. It includes both crack initiation and propagation zones. For H-Si steel specimens charged with hydrogen of 0.1 mass ppm (Fig. 6(a)), the fracture surface was QC. The fracture surfaces of the specimens charged with hydrogen of 1.6 (Fig. 6(b)) and 7.0 mass ppm (Fig. 6(c)) were IG-like, which included tear ridges on IG fracture surfaces and also included QC fracture. In contrast, for L-Si steel specimens charged with hydrogen of 0.2 mass ppm (Fig. 6(d)), 1.9 mass ppm (Fig. 6(e)) and 5.4 mass ppm (Fig. 6(f)), the fracture surfaces were all typical IG.
The typical fracture surfaces near the notch root, in addition to those shown in Fig. 6, were observed in order to investigate the correspondence between the fracture strength and the fracture surface morphology. The observed results are shown in Fig. 7 as an addition to those in Fig. 5. The range of crosshead speeds where QC fracture occurred for H-Si steel specimens differed according to the hydrogen content, as shown in Fig. 7(a). For hydrogen contents of 0.1, 1.6 and 7.0 mass ppm, QC fracture occurred at crosshead speeds of more than 0.01 mm·min−1, more than 10 mm·min−1 and more than 20 mm·min−1, respectively. That is, QC fracture tended to occur under a condition of a smaller hydrogen content or the combination of a larger hydrogen content and a high crosshead speed. On the other hand, IG-like fracture tended to occur under a condition of a larger hydrogen content or a smaller hydrogen content but a lower crosshead speed. Moreover, no IG fracture occurred. On the other hand, IG, IG-like and QC fractures occurred in L-Si steel specimens as shown in Fig. 7(b). QC fracture occurred only if the hydrogen content was as small as 0.2 mass ppm and the crosshead speed was more than 10 mm·min−1, while IG or IG-like fracture occurred under other conditions.
L-Si and H-Si steel specimens containing enough hydrogen to suffer marked hydrogen embrittlement at room temperature were tensile tested in liquid nitrogen at a temperature of −196°C in order to investigate the effects of the test temperature on hydrogen embrittlement susceptibility and fracture surface morphologies. Figures 8(a) and 8(b) show the stress-displacement curves of hydrogen-charged H-Si (hydrogen content: 5.0 mass ppm) and L-Si steel (hydrogen content: 5.9 ppm) specimens having the dimension shown in Fig. 2(b). The crosshead speed was 0.05 mm·min−1. The stress-displacement curves of uncharged specimens are shown as controls. Although the fracture strengths of both specimen types decreased due to hydrogen charging at room temperature, fracture strengths did not decrease at a temperature of −196°C regardless of the same hydrogen contents. The fracture strengths of the uncharged H- and L-Si steel specimens in Fig. 8 were higher than that of the specimens in Fig. 5. That was probably due to the difference in stress triaxiality resulting from the specimen geometries.

Figures 9 and 10 show the fractographs of H-Si and L-Si steel specimens after the tensile tests of which results were shown in Fig. 8, respectively. The fracture surface morphology of the uncharged specimens of both steels at room temperature was micro-void coalescence (MVC). This indicates that a plastic zone formed near notch tips and led to ductile failure, though uniform elongation is not observed in the stress-displacement curves in Fig. 8. The fracture surface morphology at room temperature of the hydrogen-charged specimens denoted as (b) in Figs. 9 and 10 was IG-like on the H-Si steel specimen and IG on the L-Si steel specimen. The fracture surface morphology of the uncharged (c) and hydrogen-charged (d) specimens of both steels at −196°C was a mixture of cleavage (CL) and shallow MVC. In summary, the fracture strength did not decrease and the fracture surface morphologies were a mixture of CL and MVC at −196°C, despite containing enough hydrogen for the fracture strength to decrease and for IG-like or IG fracture to occur at room temperature.
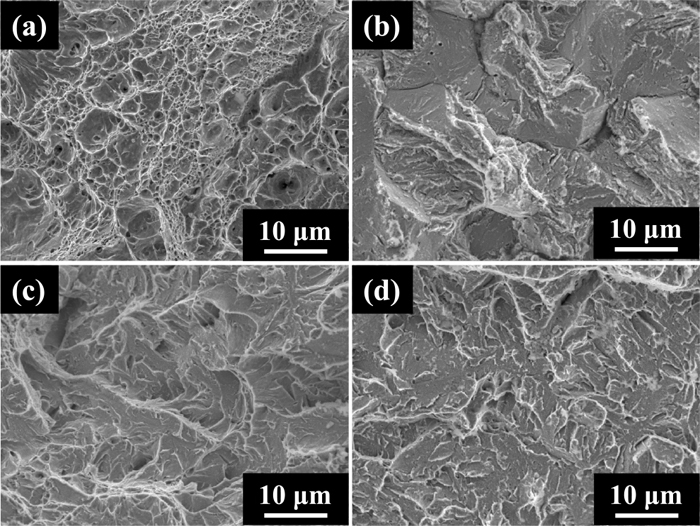
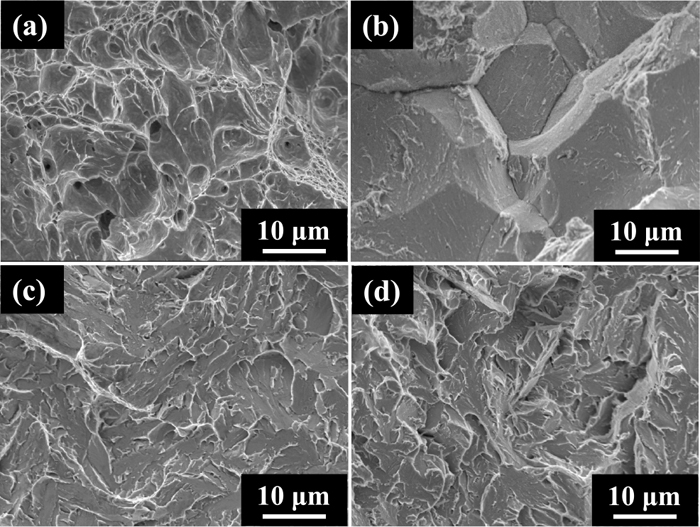
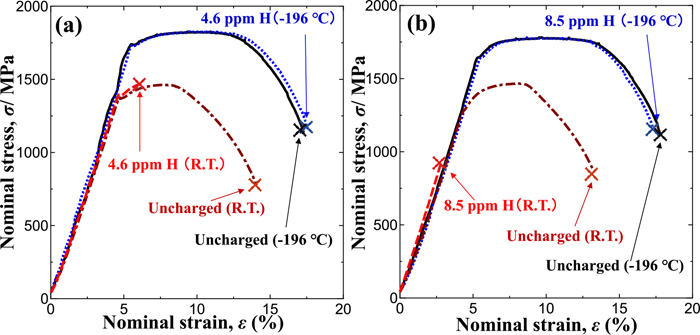
Figure 11 shows the stress-displacement curves obtained in tensile tests conducted under the same conditions as those in Fig. 8 using the specimens shown in Fig. 2(c) so as to eliminate the effect of stress-driven hydrogen diffusion to the notch root. Hydrogen-charged H-Si steel specimens (hydrogen content: 4.6 mass ppm) and L-Si steel specimens (hydrogen content: 8.5 mass ppm) exhibited significant ductility loss at room temperature, but yield stress, tensile stress and elongation did not decrease, and their stress-displacement curves were consistent with those of the uncharged specimens at −196°C, although the same hydrogen content was charged. Smooth specimens, in which stress-driven hydrogen diffusion did not occur, as well as notched specimens did not exhibit any effect of hydrogen on their mechanical properties at −196°C. The fractographs obtained in those tests are not shown here because they were almost the same as those of the notched specimens shown in Figs. 9 and 10.
Hydrogen accumulation near notch tips due to stress-driven hydrogen diffusion seems to be a key factor for IG fracture and reduction in fracture strength at room temperature, but IG fracture and reduction in tensile strength did not occur at −196°C, despite containing sufficient hydrogen for the tensile strength to decrease for smooth specimens that were used to avoid the effect of stress-driven hydrogen diffusion.
4. Discussion
4.1. Relationships between Transition in Fracture Morphologies and Transgranular/Intergranular Strengths
The reasons both steels exhibited a transition in fracture surface morphologies due to changes in crosshead speed and hydrogen content, as shown in Fig. 7, are discussed here. First, the results for L-Si steel specimens charged with hydrogen of 0.2 mass ppm will be discussed since they showed an obvious transition in fracture surface morphologies. The fracture surface morphology changed from QC to IG-like to IG with decreasing crosshead speed. QC is transgranular fracture, IG-like fracture propagates intergranular and transgranular alternately with tear ridges, and IG fracture initiates and propagates on the grain boundaries. Assuming that each fracture initiates and propagates along a position where cohesive energy is lower in the matrix and on the grain boundaries as applied stress was increased, the relationship of intergranular strength > transgranular strength was suggested at high crosshead speeds since the specimens charged with hydrogen of 0.2 mass ppm exhibited not IG but QC fracture at a crosshead speed of more than 10 mm·min−1. At medium crosshead speeds, intergranular strength ≒ transgranular strength was presumed since IG-like fracture occurred at crosshead speeds between 0.1 to 10 mm·min−1. At low crosshead speeds, intergranular strength < transgranular strength was presumed because IG fracture occurred at crosshead speeds of less than 0.1 mm·min−1.
Hence, the crosshead speed dependence of the intergranular and transgranular strength was changed by microstructural factors under hydrogen charging. That presumably leads to a transition in fracture surface morphologies since cracks initiated and propagated along the place where strength was low while the uncharged specimens always exhibited MVC. Figure 12(b) shows the crosshead speed dependence of the transgranular (TG) and intergranular (IG) strengths schematically. It was presumed from the crosshead speed dependence of the fracture strength and the transition in fracture surface morphologies in the L-Si steel specimens charged with hydrogen of 0.2 mass ppm, as shown in Fig. 7(b).
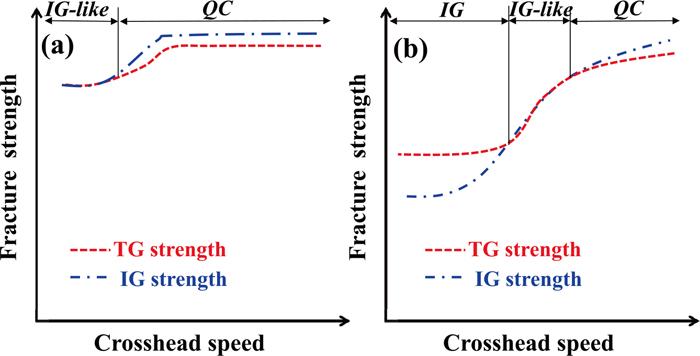
On the basis of the same concept as described above, the transition in fracture surface morphologies of the H-Si steel specimens charged with hydrogen of 0.1 mass ppm, which was almost the same content as the L-Si steel specimens, will be discussed below. The facture surface morphologies changed from QC to IG-like with decreasing crosshead speed, as shown in Fig. 7(a). At crosshead speeds of 0.01 to 10 mm·min−1, intergranular strength > transgranular strength was presumed since the fracture morphology was not IG but QC. At crosshead speeds of less than 0.01 mm·min−1, intergranular strength ≒ transgranular strength was inferred since the fracture morphology was IG-like. Figure 12(a) schematically shows the crosshead speed dependence of the TG and IG strengths of the H-Si steel specimens charged with hydrogen of 0.1 mass ppm. It was presumed from the crosshead speed dependence of the fracture strength and the transition in the fracture surface morphologies as shown in Fig. 7(a).
4.2. Relationships between Transgranular/Intergranular Strengths and Microstructure
The transition in the fracture surface morphologies of the H-Si and L-Si steel specimens was discussed in the previous section on the basis of the magnitude relationship between transgranular and intergranular strengths. Here, the difference in the effect of hydrogen on the transgranular and intergranular strengths between the H-Si and L-Si steel specimens will be discussed from the viewpoint of their microstructure and substructure. When the hydrogen content was small, both the transgranular and intergranular strengths of H-Si steel specimens were higher than those of the L-Si specimens, as shown in Figs. 12(a) and 12(b). The reasons for this are presumably (i) solid solution strengthening and (ii) increased resistance to tempering softening because of a higher Si content. Increasing the Si content can raise the tempering temperature without lowering tensile strength. In fact, the tempering temperature of the H-Si specimens (495°C) was 145°C higher than that of the L-Si specimens (350°C). Higher tempering temperature presumably changes the microstructure as follows:
(X) stabilizing dislocation structures and
(Y) changing the form of carbide precipitation.
With regard to stabilizing dislocation structures, it was reported that increasing the Si content reduces the stress relaxation value.18) This indicates that increasing the Si content, i.e., high-temperature tempering, can stabilize dislocation structures even at the same tensile strength. It was also reported that hydrogen stabilized lattice defects such as vacancies formed through the cutting of dislocations due to the dislocation slip in the matrix, which enhances hydrogen embrittlement.11) Hence, the stabilized dislocation structure suppresses lattice defect formation in the matrix, which presumably prevents a reduction in transgranular strength under hydrogen charging.
As for changing the form of carbide precipitation, the increased Si content hinders transformation of ε-carbides to Fe3C during tempering since Si solutes in ε-carbides and Si diffusion control that transformation.26) In the present study, while large plate-like cementite precipitated on the prior-γ grain boundaries in the L-Si steel specimens, little cementite precipitated on the prior-γ grain boundaries and fine cementite precipitated in the matrix of the H-Si steel specimens.18) Coarse second-phase particles hinder dislocations from moving through grain boundaries, which leads to concentration of stress and strain.27) Thus, finer Fe3C particles on grain boundaries in the H-Si steel specimens probably reduced the concentration of stress and strain, resulting in a suppression of the reduction in grain boundary strength. In addition, contiguous precipitates on grain boundaries presumably change interface energy, which can also reduce intergranular strength.
In summary, the stabilized dislocation structure reduced the susceptibility of transgranular strength to hydrogen, and the suppressed precipitation of plate-like cementite reduced the susceptibility of intergranular strength to hydrogen, resulting in higher fracture strength under hydrogen charging for the H-Si steel specimens than for the L-Si steel specimens. On the basis of the concepts of transgranular and intergranular strengths discussed above, a guideline for reducing the susceptibility of fracture strength to hydrogen under a high hydrogen content can be proposed. H-Si steel specimens charged with a high content of hydrogen exhibited IG-like fracture, as shown in Fig. 7(a). This indicates that both transgranular and intergranular strengths must be improved to increase fracture strength. On the other hand, the fracture strength of the L-Si steel specimens charged with a high content of hydrogen can be improved by increasing intergranular strength with the transition in fracture surface morphologies from IG to IG-like fracture since they exhibited IG fracture, as shown in Fig. 7(b).
4.3. Relationships between Transition in Fracture Morphologies and Crosshead Speed Dependence
The fracture strengths and fracture surface morphologies of the H-Si and L-Si steel specimens were discussed above from the viewpoint of microstructure and the concepts of transgranular and intergranular strengths. In this section, the reasons for the crosshead speed dependence of fracture strength and fracture surface morphologies will be discussed. Although enough hydrogen to cause hydrogen embrittlement at room temperature was induced, QC, IG-like and IG fractures, which are related to hydrogen, did not occur and mechanical properties did not deteriorate at −196°C, as shown in Figs. 8, 9, 10, 11. This indicates that hydrogen initially present on the prior-γ grain boundaries was not sufficient to cause IG fracture. Hydrogen initially trapped by cementite, martensite blocks, packets and lath boundaries was not sufficient to cause QC fracture. The results obtained in tensile tests conducted at −196°C and those conducted at a high crosshead speed at room temperature suggest that hydrogen embrittlement was not caused only by hydrogen having been present before stress application and that hydrogen embrittlement resulted from hydrogen accumulation and lattice defect formation during the stress application process. The phenomena showing crosshead speed dependence during the stress application process under hydrogen charging are:
(A) Increment in local equilibrium hydrogen concentration at the notch tip by stress-driven diffusion,6,28)
(B) Segregation of hydrogen transported by dislocations onto grain boundaries or second phase particles,14)
(C) Hydrogen diffusion into a propagating crack (mobile effect of hydrogen),7) and
(D) Hydrogen-enhanced local plasticity (HELP).15,16,17)
In general, temperature and strain rate are equivalent in body-centered cubic metals. In the present study, both low temperature (Fig. 8) and high crosshead speed (Fig. 5) raised fracture strength and reduce hydrogen embrittlement susceptibility, i.e., their effects were equivalent. This indicates that some thermally activated processes are related to the transition in fracture surface morphologies and the crosshead speed dependence of fracture strength. One of the empirical equations in the literature29) indicates that the effective diffusion coefficient of hydrogen in α-iron at −196°C was almost 10−5 times smaller than that at room temperature. High crosshead speeds at room temperature lead to a shortage of time for stress-driven hydrogen diffusion, making it difficult for hydrogen to follow dislocations. As a result, all these factors (A)–(D) should not operate at high crosshead speeds at room temperature.
Next, the relationships between factors (A)–(D) and fracture will be discussed here. IG fracture is generally explained by the reduction of cohesive energy on grain boundaries by hydrogen. Factors (A)–(D) can act as accelerators for hydrogen accumulation near grain boundaries. Hence, not only hydrogen initially trapped by grain boundaries but also hydrogen accumulated during the stress application process are important causes of IG fracture. One of the possible reasons why intergranular strength shows crosshead speed dependence was that factors (A)–(D) have crosshead speed dependence. Moreover, lower critical stress, which is constant and independent of crosshead speed, was obtained at higher crosshead speeds as more hydrogen was charged to specimens. The reason was probably that the initial hydrogen content was so high that the local hydrogen content reached the critical value with less assistance by factors (A)–(D). Even if cohesive energy reduction on grain boundaries applies to crack propagation induced by hydrogen, it does not apply to crack initiation by hydrogen. Therefore, in addition to reduced cohesive energy on grain boundaries, other factors such as dislocation pile-up near grain boundaries or vacancy formation by the cutting of dislocations near grain boundaries can enhance IG fracture.
Transgranular fracture, in particular QC fracture, is treated as fracture occurring at martensite blocks or lath boundaries2,13,30) and/or fracture due to hydrogen-enhanced strain-induced vacancy accumulation11) in literature. Factors (A), (B) and (D) probably enhance strain-induced vacancy formation. The authors have reported that hydrogen-enhanced strain-induced lattice defects, which are mainly vacancy-type defects, were formed by hydrogen-dislocation interactions and enhanced hydrogen embrittlement.11,31) As mentioned above, dislocations slip with more hydrogen as the strain rate is lower. Hence, at lower crosshead speeds, more hydrogen is trapped immediately by vacancies formed by the cutting of screw dislocations, etc., and stabilizes the vacancies. In fact, more hydrogen-enhanced strain-induced vacancies were formed with decreasing strain rates in X80 pipeline steel32) and in cold-drawn pearlitic steel.33,34) Since lattice defect formation showed strain rate dependence in these previous papers and in the present study, transgranular strength also shows strain rate dependence. In addition, hydrogen accumulation near martensite blocks or lath boundaries was enhanced by factors (A), (B) and (D), which may lead to transgranular fracture.
4.4. Test Conditions for Evaluating Hydrogen Embrittlement Susceptibility Based on Transgranular and Intergranular Fracture Mechanism
Test conditions to note for evaluating hydrogen embrittlement susceptibility will be discussed here on the basis of the evaluation results shown in Fig. 7 and the mechanism discussed above. Fracture strength showed crosshead speed dependence under a wide range of hydrogen contents in high strength steel that exhibited transgranular fracture, as shown in Fig. 7(a). Assuming tests using a lower critical stress are appropriate for evaluating hydrogen embrittlement susceptibility of materials used over long periods of time, a crosshead speed of less than 0.01 mm·min−1 is required even if the hydrogen content is higher. This crosshead speed is at least 10−2 times as small as that for steels fracturing mainly by IG morphology. In the literature,24) the fracture strength in SSRT at a crosshead speed of 0.005 mm·min−1 was smaller than that in CSRT at a crosshead speed of 1 mm·min−1 when steels that exhibited mainly QC fracture and with a tensile strength of 1100 MPa were evaluated. That is consistent with the results of the present study, as shown in Fig. 7(a). While hydrogen accumulation near prior-γ grain boundaries is presumably the rate-controlling-step for intergranular fracture, formation and accumulation of hydrogen-enhanced strain-induced lattice defects as well as hydrogen accumulation on blocks or lath boundaries probably constitute the rate-controlling step for transgranular fracture. That was presumably the reason transgranular strength showed crosshead speed dependence in a wider range of crosshead speeds than intergranular strength did.
On the other hand, lower critical stress was obtained at a crosshead speed of less than 1 mm·min−1, which includes the conventional crosshead speed in tensile tests, when high strength steel that exhibited intergranular fracture was tested, as shown in Fig. 7(b). That is consistent with the literature,23) which indicates fracture strength in SSRT at a crosshead speed of 0.005 mm·min−1 and that in CSRT at a crosshead speed of 1 mm·min−1 were consistent when steels that exhibited IG fracture and had a tensile strength of 1300–1500 MPa were evaluated. However, at crosshead speeds higher than 1 mm·min−1, fracture strength depends on the crosshead speed. In addition, the crosshead speed required for obtaining lower critical stress decreases with decreasing hydrogen content. Hence, if steels that tend to exhibit IG fracture, i.e., the susceptibility of intergranular strength to hydrogen is larger than that of transgranular strength, are to be evaluated, a crosshead speed small enough to increase hydrogen accumulation on grain boundaries due to factors (A)–(D), in addition to hydrogen initially trapped by grain boundaries, is required. That crosshead speed differs according to the hydrogen content or the magnitude relationship between transgranular and intergranular strengths. The magnitude relationship differs depending on the microstructure. Hence, the crosshead speeds required to obtain lower critical stress must be determined experimentally even though the evaluated materials show typical IG fracture.
Above all, the conditions required to obtain lower critical stress in evaluating hydrogen embrittlement susceptibility differ according to the fracture morphologies. If steels exhibiting QC or IG-like fracture surfaces are evaluated at the crosshead speeds required for evaluating steels exhibiting IG fracture, the strength obtained will be higher than the actual lower critical stress. In addition, if steels exhibiting IG fracture are evaluated at the crosshead speed required for evaluating the same kind of steels but charged with less hydrogen, the strength obtained will be higher than the actual lower critical stress. In summary, since the crosshead speed required for obtaining lower critical stress in evaluating steels exhibiting IG fracture is higher in the order of IG, IG-like and QC, the crosshead speed determined for IG fracture morphology will no longer be appropriate when different fracture morphologies such as IG-like and QC appear, i.e., the crosshead speed must be determined experimentally for each fracture morphology so that appropriate testing conditions are used.
5. Conclusion
Tempered martensitic steels exhibiting mainly QC and IG fractures in the presence of hydrogen were prepared by changing the Si content of specimens with a tensile strength level of 1450 MPa. The effects of the crosshead speed, hydrogen content and test temperature on fracture strength and fracture surface morphology were investigated using circumferentially notched specimens. The results obtained regarding the testing conditions for evaluating hydrogen embrittlement susceptibility can be summarized as follows.
(1) H-Si steel specimens exhibited QC fracture under a small hydrogen content or at a high crosshead speed. IG-like fracture, which propagated with tear ridges on prior-γ grain boundaries, was observed under a combination of a high hydrogen content and low crosshead speeds. In contrast, L-Si steel specimens exhibited QC fracture under a combination of a small hydrogen content and high crosshead speeds. IG or IG-like fracture was displayed under the other conditions. The fracture strength of both types of steel decreased with decreasing crosshead speeds and converged to a constant value. The converged value is referred to as the lower critical stress. The crosshead speed required for obtaining lower critical stress in L-Si steel specimens was higher than that for H-Si steel specimens.
(2) The fracture strength of L-Si and H-Si steel specimens did not decrease due to hydrogen at a temperature of −196°C, and the fracture surface morphology was a mixture of CL and MVC, i.e., hydrogen affected neither fracture strength nor the fracture surface even if the charged hydrogen content was large enough to reduce fracture strength and to change the fracture surface morphology to IG or IG-like at room temperature. Hence, hydrogen initially trapped by prior-γ grain boundaries was not sufficient to induce IG fracture. In addition, hydrogen initially trapped by cementite in the matrix, martensite blocks, packets and lath boundaries was not sufficient to cause QC fracture. Therefore, hydrogen accumulation or lattice defect formation during the stress application process is needed for hydrogen embrittlement at room temperature and at a low crosshead speed.
(3) The fracture surface morphologies of L-Si steel specimens charged with a small content of hydrogen transitioned from QC to IG-like to IG with decreasing crosshead speed at room temperature. Assuming a crack initiated and propagated at the position where cohesive energy was low as applied stress was increased, transgranular strength was lower than intergranular strength at high crosshead speeds since the fracture surface morphologies were QC. Transgranular strength was almost as high as intergranular strength at medium crosshead speeds since the fracture surface morphology was IG-like. Transgranular strength was higher than intergranular strength at low crosshead speeds since the fracture morphology was IG.
(4) The fracture surface morphologies of H-Si steel specimens charged with a small content of hydrogen transitioned from QC to IG-like with decreasing crosshead speed at room temperature. Transgranular strength was lower than intergranular strength at medium or high crosshead speeds since the fracture surface morphology was QC. Transgranular strength was as high as intergranular strength at low crosshead speeds since the fracture surface morphology was IG-like.
(5) The fracture strength of H-Si steel specimens charged with hydrogen was higher than that of L-Si steel specimens at any crosshead speed. The stabilized dislocation structure of H-Si steel specimens worked to reduce the susceptibility of transgranular strength to hydrogen under hydrogen charging. Restricted precipitation of plate-like cementite on prior-γ grain boundaries reduced the susceptibility of intergranular strength to hydrogen under hydrogen charging.
(6) When hydrogen embrittlement susceptibility was evaluated relatively and when different fracture surface morphologies such as IG, IG-like and QC appeared, the crosshead speed required for obtaining lower critical stress in the steels evaluated was higher in the order of IG, IG-like and QC. Hence, the crosshead speed determined for steels exhibiting IG fracture morphology to obtain lower critical stress is not appropriate for steels exhibiting IG-like or QC fracture, i.e., the crosshead speed must be determined experimentally for each fracture morphology so that appropriate testing conditions are used.
Acknowledgements
The present study is part of the Fundamental Factors and Property Evaluation of Hydrogen Embrittlement Project being conducted by a study group at the Iron and Steel Institute of Japan. The authors are grateful to the members of the study group for their valuable suggestions.
References
- 1) Y. Matsumoto and K. Takai: Metall. Mater. Trans. A, 48 (2017), 666.
- 2) Y. H. Kim and J. W. Morris, Jr.: Metall. Trans. A, 14 (1983), 1883.
- 3) M. Gao and R. P. Wei: Acta Metall., 32 (1984), 2115.
- 4) Y. Matsumoto and K. Takai: Metall. Mater. Trans. A, 49 (2018), 490.
- 5) C. J. McMahon, Jr.: Eng. Fract. Mech., 68 (2001), 773.
- 6) R. A. Oriani and P. H. Josephic: Acta Metall., 22 (1974), 1065.
- 7) M. Yamaguchi, J. Kameda, K. Ebihara, M. Itakura and H. Kaburaki: Philos. Mag., 92 (2012), 1349.
- 8) A. R. Troiano: Trans. Am. Soc. Met., 52 (1960), 54.
- 9) R. P. Frohmberg, W. J. Barnett and A. R. Troiano: Trans. Am. Soc. Met., 47 (1955), 892.
- 10) J. R. Rice and J. S. Wang: Mater. Sci. Eng. A, A107 (1989), 23.
- 11) T. Doshida, H. Suzuki, K. Takai, N. Oshima and T. Hirade: ISIJ Int., 52 (2012), 198.
- 12) M. Nagumo: Mater. Sci. Technol., 20 (2004), 940.
- 13) M. Nagumo, M. Nakamura and K. Takai: Metall. Mater. Trans. A, 32 (2001), 339.
- 14) A. Nagao, C. D. Smith, M. Dadfarnia, P. Sofronis and I. M. Robertson: Acta Mater., 60 (2012), 5182.
- 15) H. K. Birnbaum and P. Sofronis: Mater. Sci. Eng. A, A176 (1994), 191.
- 16) P. Sofronis and H. K. Birnbaum: J. Mech. Phys. Solids, 43 (1995), 49.
- 17) I. M. Robertson: Eng. Fract. Mech., 68 (2001), 671.
- 18) Y. Matsumoto, K. Takai, M. Ichiba, T. Suzuki, T. Okamura and M. Shigeru: ISIJ Int., 53 (2013), 714.
- 19) T. Depover, D. Pérez Escobar, E. Wallaert, Z. Zermout and K. Verbeken: Int. J. Hydrog. Energy, 39 (2014), 4647.
- 20) S. Yamasaki and T. Takahashi: Tetsu-to-Hagané, 83 (1997), 454 (in Japanese).
- 21) E. Akiyama: ISIJ Int., 52 (2012), 307.
- 22) F. Nakasato: Tetsu-to-Hagané, 88 (2002), 606 (in Japanese).
- 23) Y. Hagihara, C. Ito, N. Hisamori, H. Suzuki, K. Takai and E. Akiyama: Tetsu-to-Hagané, 94 (2008), 215 (in Japanese).
- 24) T. Chida, Y. Hagihara, E. Akiyama, K. Iwanaga, S. Takagi, H. Ohishi, M. Hayakawa, D. Hirakami and T. Tarui: Tetsu-to-Hagané, 100 (2014), 1298 (in Japanese).
- 25) T. Yasukawa and K. Takai: CAMP-ISIJ, 30 (2017), 848, CD-ROM (in Japanese).
- 26) T. Nishimura: J. Jpn. Soc. Heat Treat., 20 (1980), 342 (in Japanese).
- 27) M. Nagumo, T. Yagi and H. Saitoh: Acta Mater., 48 (2000), 943.
- 28) M. Wang, E. Akiyama and K. Tsuzaki: Scr. Mater., 53 (2005), 713.
- 29) R. C. Frank, D. E. Swets and D. L. Fry: J. Appl. Phys., 29 (1958), 892.
- 30) A. Shibata, T. Murata, H. Takahashi, T. Matsuoka and N. Tsuji: Metall. Mater. Trans. A, 46 (2015), 5685.
- 31) K. Takai, H. Shoda, H. Suzuki and M. Nagumo: Acta Mater., 56 (2008), 5158.
- 32) M. Hattori, H. Suzuki, Y. Seko and K. Takai: JOM, 69 (2017), 1375.
- 33) T. Doshida and K. Takai: Acta Mater., 79 (2014), 93.
- 34) R. Konno, T. Manabe, D. Hirakami and K. Takai: Tetsu-to-Hagané, 104 (2018), 36 (in Japanese).