Abstract
Crystallisation behaviour has been investigated on samples with two compositions: (A) 42CaO-37SiO2-21Al2O3 and (B) 43CaO-27SiO2-19Al2O3-11CaF2 (all mass%). Composition (A) is within the primary phase region of gehlenite and composition (B) is just between gehlenite and cuspidine on a mass basis. Two types of sample were prepared from glassy and molten states for each composition. These samples were characterised by differential thermal analysis, X-ray diffraction analysis and electron probe microanalysis.
- Crystallised samples A from glassy state:
It contained gehlenite and wollastonite in the XRD profile, and in BE images gehlenite crystals grew more largely than wollastonite, suggesting that gehlenite precipitates in preference to wollastonite.
- Crystallised samples B from glassy state:
It contained cuspidine and gehlenite in the XRD profile. In BE images, cuspidine precipitated but gehlenite was not observed.
- Crystallised samples A from molten state:
It contained only gehlenite in the XRD profile, and in BE images there was dendritic gehlenite developed across the sample.
- Crystallised samples B from molten state:
It contained cuspidine and CaF2 as well as gehlenite in the XRD profile. In BE images, gehlenite comprised the major part, and it is likely that gehlenite crystallises in preference to cuspidine.
It is also likely that the pseudo-binary system of gehlenite and cuspidine forms eutectics and that the eutectic composition is rather closer to cuspidine. Consequently, the increase in Al2O3 concentration would little affect crystallisation of the glassy portion in actual mould fluxes containing CaF2 but strongly affects crystallisation of the liquid portion.
1. Introduction
Mould fluxes play a very important role in the continuous casting of steel. The mould flux infiltrates into the steel shell and the mould, and exists layer by layer, typically in the form of a glassy phase next to the mould, a partially crystallised phase and a liquid phase next to the shell. Mould fluxes are required to have several functions including (i) lubrication between the steel shell and the mould and (ii) heat extraction rate control from the molten steel.1) The former function is primarily related to viscosity2,3) and the latter function to thermal conductivity4,5) and optical properties.6,7,8,9,10) Thus, the physical properties of mould fluxes have been investigated by many workers for a long time.11) In addition to the physical properties, in practice, the types of mould flux are selected from many perspectives including the mould geometry and the steel grade. For the mould geometry, the melting rate is designed to decrease in the order of slabs > blooms > billets,12) whilst for the steel grade the basicity is adjusted to decrease in the order of hypo-peritectic steel > medium carbon steel > low carbon steel.13,14,15) In the former two steel grades, mould fluxes are expected to have higher solidification temperatures and form flux films with higher fractions of crystalline phase to reduce the heat extraction rate.
During the continuous casting of steel, on the other hand, mould fluxes normally pick up 4–5 mass% of Al2O3, which originates from both Al2O3 inclusions in molten steel and the chemical reaction in the following:12)
|
4
Al
_
+3(Si
O
2
)→3
Si
_
+2(A
l
2
O
3
)
| (1) |
Thus, even if mould fluxes are properly designed initially, Al2O3 pick-up modifies the chemical compositions of mould fluxes and thereby affects their various properties and characteristics to worsen the mould flux performance. Meanwhile, the continuous casting has now been applied to non-magnetic steel such as 20Mn23AlV containing 1.5–2.5 mass% aluminium and advanced high-strength steels such as TRIP steels, which contain 0.5–3 mass% aluminium, depending upon the silicon concentration, to stabilise the austenite phase. The amount of Al2O3 pick-up increases with an increase in Al concentration in molten steel.
Against the above background, there have been many investigations on effects of increased concentrations of Al2O3 on mould fluxes, which on the whole fall into three categories: 1) mechanisms and kinetics on Al2O3 pick-up,16,17,18,19,20,21) 2) physical properties and characteristics,2,22,23,24,25) and 3) crystallisation behaviour.26,27,28,29,30) With respect to Al2O3 pick-up, for example, it has been reported that the Al2O3 concentration increases to 16 mass% in the flux film within 20 min of casting and reaches 22 mass% after the end of the second heat even in case of steel containing 0.7 mass% Al16) and that there are some cases where it exceeds 30 mass%.17) The increased concentration of Al2O3 increases the viscosity,2,23) worsening the lubrication function. The high concentration of Al2O3 may also change the crystallised phase itself as well as its fraction in the flux film, which would affect the heat extraction rate. Actually, there are several articles reporting that cuspidine (Ca4Si2O7F) is the main crystalline phase in conventional mould fluxes but gehlenite (Ca2Al2SiO7) also appears with an increase in Al2O3 concentration.26,27,28,29,30) As a result, the crystallisation temperature increases with increasing Al2O3 concentration up to 30 mass%,30) and the total heat flux across the mould flux tends to decrease,24,25,28) which would be due to increased interfacial thermal resistance between the mould flux and the mould.25) On the contrary, there have been no reports available for thermal conductivity data of mould fluxes with gehlenite as main crystalline phase, which data are indispensable for heat transfer calculation or simulation, although there are a few for mould fluxes with cuspidine.4,5)
The authors focus on how the change in crystalline phase from cuspidine to gehlenite alters the physical properties and characteristics of mould fluxes; however, many of the previous reports in the above are for multi-component mould fluxes whose compositions are close to those of practical mould flues. Because of this, it is rather difficult to catch the intrinsic effect of gehlenite. In such a situation, it is necessary to research on the pseudo-binary system of cuspidine and gehlenite. In conventional mould fluxes, in addition, crystallisation occurs in two possible ways: (a) cuspidine precipitates at the interface between the mould flux and the mould, and its precipitation proceeds in the glassy phase toward the shell side, and (b) cuspidine crystallises directly from the liquid phase.14) As a consequence, the present work aims to investigate crystallisation of glasses and melts from the CaO–SiO2–Al2O3 and CaO–SiO2–Al2O3–CaF2 systems to have basic knowledge about the pseudo-binary system of cuspidine and gehlenite, as a first step toward the future work on the effect of gehlenite on the physical properties and characteristics of mould fluxes.
2. Experimental
2.1. Sample Preparation
Two samples with different compositions were employed: (A) 42CaO-37SiO2-21Al2O3 and (B) 43CaO-27SiO2-19Al2O3-11CaF2 (all mass%). Composition (A) is within the primary phase region of gehlenite (2CaO·SiO2·Al2O3), as shown in Fig. 1 focusing on a part of a phase diagram of the CaO–SiO2–Al2O3 system.31) Composition (B) is just between gehlenite and cuspidine (3CaO·2SiO2·CaF2) on a mass basis, which is roughly gehlenite: cuspidine = 57:43 on a mole basis. Throughout this paper, the samples having compositions (A) and (B) are denoted by ‘samples A and B’, respectively. These samples were prepared from reagent grade SiO2, Al2O3, CaF2 and CaCO3 powders, the last being decomposed to CaO by heating at 1050°C for 12 h. These oxides and fluoride were weighed to the desired compositions and mixed in an alumina mortar. Two types of sample were prepared for each composition: (i) crystallised samples from glassy state and (ii) crystallised samples from molten state.

About 20 g of weighed mixtures were placed in platinum containers and melted in air at 1550°C for 1 h in case of sample A and for 10 min in case of sample B to reduce evaporation of CaF2. The melts of sample A were poured onto a brass plate and pressed by another to obtain glassy samples, which were further heat-treated at 700°C lower than the glass transition temperature in air for 15 min to remove internal strain and cooled down at a rate of 5°C/min. The melts of sample B were poured into brass moulds to obtain glassy samples. These glassy samples were breakable and hence were heated in air up to 700°C lower than the glass transition temperature at 5°C/min for heat-treatment for 15 min, and then cooled down at 5°C/min. To prepare crystallised samples A and B, the glassy samples were heated on refractory bricks up to 800–1100°C at 5°C/min. At these temperatures they were held in air for 12 h and then cooled down at 5°C/min. Crystallised samples A and B from glassy state are denoted by ‘crystallised samples A(G) and B(G)’, respectively.
2.1.2. Crystallised Samples from Molten State
About 50 g of weighed mixtures were placed in alumina containers (30 mm in outer diameter and 24 mm in inner diameter). Sample A was heated up to 1550°C at 5°C/min, at which temperature it was melted in air for 12 h, and then cooled down to 1385°C at 0.25°C/min, followed by 5°C/min cooling. In contrast, sample B was heated up in the same manner as above, melted for 12 h and then cooled down at 5°C/min. After cooling down, both samples A and B were about 5 cm high in the containers. Samples for characterisation were taken from the portions 2–3 cm above the bottom of the container. In addition, crystallised samples A and B from molten state are named ‘crystallised samples A(M) and B(M)’, respectively. It is worth mentioning that both samples may have some alumina pick-up and sample B(M) may suffer from some evaporation of CaF2.
2.2. Sample Characterisation
Differential thermal analysis (DTA) was applied to know crystallisation temperatures of the glassy samples. About 30 mg of sample powders were placed in platinum pans, heated up to 700°C at 5°C/min for sample A and up to 400°C for sample B for their stabilisation, and further heated up to 1200°C at 5, 10 or 15°C/min to record DTA profiles. About 30 mg of alumina powders in the form of corundum were used as standard sample. X-ray diffraction (XRD) was applied to powder samples to identify the crystalline phases using PDF cards where the Co-Kα line was used as the X-ray source, and electron probe microanalysis (EPMA) was also employed to produce element mapping data as well as to observe microstructures of the crystallised samples.
3. Results and Discussion
3.1. Crystallisation of Glassy Samples
Figures 2(a) and 2(b) show the appearances of sample A before and after heat-treatment at 1000°C for crystallisation, respectively. The glassy sample A is initially transparent and colourless, and becomes milky white after crystallisation; at the same time, the shape is also deformed significantly. The same change has occurred in the sample heat-treated at 1100°C but the change has been less remarkable in the sample at 950°C although the clarity has been lost. Figures 3(a) and 3(b) show the appearances of sample B before and after heat-treatment at 1000°C for crystallisation, respectively. The glassy sample B is also initially transparent and colourless, and becomes milky white after crystallisation. The shape deformation is not significant, compared with sample A. The clarity has been lost in the sample heat-treated at 800°C as well as in the sample shown in Fig. 3(b).
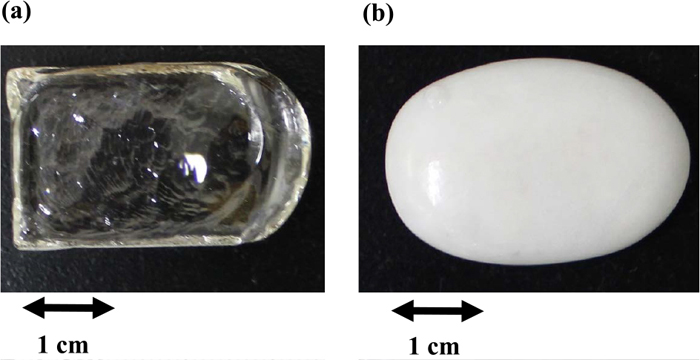

Figure 4 shows DTA profiles of glassy sample A. The DTA profiles depend on the heating rate, which would arise from the difference in crystallisation time. Meanwhile, the present work does not focus on crystallisation kinetics but on the feature of crystallisation of this glass. Hence, take the profile recorded at a heating rate of 15°C/min as an example because it shows distinctive changes. The profile exhibits an endothermic peak around 820°C and two exothermic peaks around 1000°C and 1040°C. The endothermic peak is due to glass transition. Figure 5 shows XRD profiles of crystallised samples A(G) heat-treated at 950°C and 1000°C for 12 h for crystallisation where the Co-Kα line was used as the X-ray source. There are no diffraction peaks for the sample heat-treated at 950°C, whereas for the sample heat-treated at 1000°C there are diffraction peaks assigned to gehlenite and wollastonite (CaO·SiO2). The sample heat-treated at 1100°C has also shown the same diffraction profile. These results are in consistent with the report by Hayashi et al.,32) who investigated crystallisation of glassy samples in the CaO–SiO2–Al2O3 system by XRD analysis and reported that gehlenite and wollastonite were found in a sample with compositions close to sample A after firing at 1100°C for 1 h. Hence, the exothermic peaks in Fig. 4 stems from gehlenite and wollastonite. Figure 6 shows a backscattered electron (BE) image and element mappings of an inner part of crystallised sample A(G) heat-treated at 1100°C. According to XRD profiles, there should exist two types of crystalline phase such as gehlenite and wollastonite in this sample. The grey portion in the BE image is rich in aluminium, calcium and oxygen and thus would be gehlenite, and the dark portion being needle-like crystals is rich in calcium, silicon and oxygen, and thus would be wollastonite. The white portion is supposed to be glass matrix or anorthite according to Fig. 1 although there are no diffraction peaks in Fig. 5, which is probably due to its weak diffraction intensity arising from low symmetry of the crystal structure; however, it is not certain yet. It can be seen from Fig. 6 that gehlenite crystals grow more largely than wollastonite, which suggests that gehlenite precipitates in preference to wollastonite. Thus, the exothermic peaks around 1000°C and 1040°C would be relevant to precipitation of gehlenite and wollastonite, respectively.


Figure 7 shows DTA profiles of glassy sample B. The profile recorded at a heating rate of 15°C/min exhibits an endothermic peak around 730°C and two exothermic peaks around 860°C and 970°C. The endothermic peak is due to glass transition. Figure 8 shows XRD profiles of crystallised samples B(G) heat-treated at 800°C, 850°C, 900°C and 1100°C for 12 h for crystallisation where the Co-Kα line was used as the X-ray source. There are no diffraction peaks in the sample heat-treated at 800°C. At 850°C, on the contrary, there are diffraction peaks due to cuspidine, and diffraction peaks due to gehlenite join at temperatures higher than 900°C. XRD analysis has suggested that in glassy sample B cuspidine precipitates at lower temperature than gehlenite. Hence, the exothermic peaks around 860°C and 970°C would be relevant to precipitation of cuspidine and gehlenite, respectively. Figure 9 shows a BE image and element mappings of an inner part of crystallised sample B(G) heat-treated at 1000°C. According to the XRD profile, there should exist two types of crystalline phase such as gehlenite and cuspidine in this sample. The BE image shows two types of crystalline phase: one is needle-like in a radial pattern and the other is feather-like. Both are rich in calcium, fluorine and oxygen and would be cuspidine. It is worth noting that these cuspidine phases seem to contain aluminium; at the moment, however, it is uncertain whether cuspidine contains aluminium as solute or it coexists with another oxide containing aluminium. In addition, there is no gehlenite phase observed clearly in Fig. 9 because fluorine exists across the image. On the other hand, Fig. 10 shows a BE image near the surface of crystallised sample B(G) heat-treated at 1100°C. The difference in contrasts indicates that there are two types of crystalline phases in this image. The white part comprising a large percentage corresponds to cuspidine, and the darker portion just near the surface corresponds to gehlenite, where aluminium has been detected but fluorine has not in element mapping images. Thus, it is certain that cuspidine precipitates in preference to gehlenite in glassy sample B; accordingly, the increase in Al2O3 concentration would little affect crystallisation of the glassy portion in actual mould fluxes containing CaF2 as well.

Both samples A and B were melted in alumina containers and were about 5 cm high in the containers after cooling down. Sample A(M) was glassy near its surface; in contrast, sample B(M) was crystallised across the sample. For both samples, XRD analysis was applied to the portion 2–3 cm above the bottom of the container. Figures 11(a) and 11(b) show XRD profiles of crystallised samples A(M) and B(M), respectively, where the Co-Kα line was used as the X-ray source. Sample A(M) contains gehlenite only as crystalline phase although the composition of sample A is within the composition triangle of gehlenite, wollastonite and anorthite, as shown in Fig. 1. On the other hand, sample B(M) contains cuspidine and CaF2 as well as gehlenite.

Figures 12(a)–12(c) show BE images of crystallised sample A(M), where the sample was taken from the portion about 2 cm above the bottom of the container. It can be seen from Fig. 12 that there are dendritic crystalline phases developed across the sample (see the white portion) and that the crystalline growth seems less directional in the centre of the sample (Figs. 12(a) and 12(b)) than near the container wall (Fig. 12(c)). Element mapping has confirmed that these crystalline phases are rich in calcium and aluminium, and the phases would be gehlenite in light of the XRD profile in Fig. 11. Crystallisation of gehlenite would start at the interface between the sample and the alumina container because the container should be cooled more quickly than the sample itself. The dark portion would be glass matrix except for pores observed in Fig. 12(c). On the other hand, the upper part of the sample in the Al2O3 container was glassier, and the lower part of the sample near the container wall contained calcium aluminate according to the XRD profile. This calcium aluminate would be CaO·Al2O3 or 5CaO·3Al2O3 formed by alumina pick-up.

Figures 13(a)–13(c) show BE images of crystallised sample B(M), where the sample was taken from the portion about 2 cm above the bottom of the container. In Figs. 13(a) and 13(b), the grey, white and dark parts correspond to gehlenite, cuspidine and pore, respectively; however, there are no GaF2 phase observed in this image. It is supposed from Fig. 13(b) that gehlenite crystallises directionally first and then cuspidine crystallises in the form of particles with gehlenite from the residual liquid at the eutectic point. This situation is opposite to that in sample B(G). As shown in Fig. 13(c), gehlenite comprises the major part near the container wall but a small amount of cuspidine also exits in the form of particles; in addition, calcium aluminate crystallises owing to alumina pick-up. The amount of cuspidine has been smaller at the upper part of the sample, which would be due to evaporation of CaF2. As a consequence, crystallisation of sample B(M) is supposed to proceed as follows: gehlenite crystallises in preference to cuspidine, which concentrates cuspidine components in the residual liquid, from which cuspidine also crystallises with gehlenite at the eutectic point.

As mentioned in 2.1, sample B was synthesised to have 57 mol% gehlenite and 43 mol% cuspidine; in addition, the respective melting points are 1593°C31) and 1407°C.33) In light of the microstructure of crystallised sample in Fig. 13, it is likely that the pseudo-binary system of gehlenite and cuspidine forms eutectics and that the eutectic composition is rather closer to cuspidine. This suggests that the increase in Al2O3 concentration strongly affects the preference of crystallisation in actual mould fluxes containing CaF2, modifying the physical properties and characteristics such as thermal conductivity and viscosity. As shown in Fig. 13, gehlenite crystallises directionally. This directionality might affect thermal conductivity of mould fluxes because there is one-directional heat flow in a mould flux film in continuous casting.
4. Conclusions
Crystallisation behaviour has been investigated on samples with two compositions: (A) 42CaO-37SiO2-21Al2O3 and (B) 43CaO-27SiO2-19Al2O3-11CaF2 (all mass%) using DTA, XRD and EPMA. The features of crystallisation are summarised as follows:
- Crystallisation from glassy state
Sample A: The DTA profile at a heating rate of 15°C/min has exhibited an endothermic peak around 820°C (glass transition) and exothermic peaks around 1000°C (gehlenite precipitation) and 1040°C (wollastonite precipitation). In BE images, gehlenite crystals grow more largely than wollastonite, suggesting that gehlenite precipitates in preference to wollastonite.
Sample B: The DTA profile at a heating rate of 15°C/min has exhibited an endothermic peak around 730°C (glass transition) and exothermic peaks around 860°C (cuspidine precipitation) and 970°C (gehlenite precipitation); however, gehlenite has been observed only near the sample surface in BE and element mapping images. Cuspidine precipitates in preference to gehlenite.
- Crystallisation from molten state
Sample A: The XRD profile has shown that only gehlenite crystallises although the composition (A) is within the composition triangle of gehlenite, wollastonite and anorthite. In BE images, there has been dendritic gehlenite developed across the sample.
Sample B: The XRD profile has shown the presence of cuspidine and CaF2 as well as gehlenite. In BE images, gehlenite comprises the major part and it is likely that gehlenite crystallises in preference to cuspidine. It is also likely that the pseudo-binary system of gehlenite and cuspidine forms eutectics and that the eutectic composition is rather closer to cuspidine.
Consequently, the increase in Al2O3 concentration would little affect crystallisation of the glassy portion in actual mould fluxes containing CaF2 but strongly affects crystallisation of the liquid portion.
References
- 1) K. C. Mills and A. B. Fox: ISIJ Int., 43 (2003), 1479. https://doi.org/10.2355/isijinternational.43.1479
- 2) M. Persson, M. Görnerup and S. Seetharaman: ISIJ Int., 47 (2007), 1533. https://doi.org/10.2355/isijinternational.47.1533
- 3) K. C. Mills, S. Karagadde, P. D. Lee, L. Yuan and F. Shahbazian: ISIJ Int., 56 (2016), 264. https://doi.org/10.2355/isijinternational.ISIJINT-2015-364
- 4) S. Ozawa, M. Susa, T. Goto, R. Endo and K. C. Mills: ISIJ Int., 46 (2006), 413. https://doi.org/10.2355/isijinternational.46.413
- 5) S. Takahashi, R. Endo, T. Watanabe, M. Hayashi and M. Susa: ISIJ Int., 58 (2018), 905. https://doi.org/10.2355/isijinternational.ISIJINT-2017-661
- 6) M. Susa, A. Kushimoto, H. Toyota, M. Hayashi, R. Endo and Y. Kobayashi: ISIJ Int., 49 (2009), 1722. https://doi.org/10.2355/isijinternational.49.1722
- 7) M. Susa, A. Kushimoto, R. Endo and Y. Kobayashi: ISIJ Int., 51 (2011), 1587. https://doi.org/10.2355/isijinternational.51.1587
- 8) Y. Kobayashi, R. Maehashi, R. Endo and M. Susa: ISIJ Int., 53 (2013), 1725. https://doi.org/10.2355/isijinternational.53.1725
- 9) R. Endo, Y. Kono, Y. Kobayashi, M. Susa, S. Mineta and H. Yamamura: Tetsu-to-Hagané, 100 (2014), 571 (in Japanese). https://doi.org/10.2355/tetsutohagane.100.571
- 10) M. Wang, R. Endo, Y. Kobayashi, Y. Susa, M. Susa and M. Hanao: J. Tech. Assoc. Refract. Jpn., 36 (2016), 3 (in Japanese).
- 11) K. C. Mills: ISIJ Int., 56 (2016), 1. https://doi.org/10.2355/isijinternational.ISIJINT-2015-231
- 12) K. C. Mills: ISIJ Int., 56 (2016), 14. https://doi.org/10.2355/isijinternational.ISIJINT-2015-355
- 13) K. Tsutsumi, T. Nagasaka and M. Hino: ISIJ Int., 39 (1999), 1150. https://doi.org/10.2355/isijinternational.39.1150
- 14) M. Hanao, M. Kawamoto, M. Hara, T. Murakami, H. Kikuchi and K. Hanazaki: Tetsu-to-Hagané, 88 (2002), 23 (in Japanese). https://doi.org/10.2355/tetsutohagane1955.88.1_23
- 15) M. Hanao, M. Kawamoto and A. Yamanaka: Tetsu-to-Hagané, 100 (2014), 581 (in Japanese). https://doi.org/10.2355/tetsutohagane.100.581
- 16) H. Yin, K. Blazek, J. Macino and J. Cotrell: Proc. 8th European Continuous Casting Conf., ASMET, Leoben, Austria, (2014), 962.
- 17) H. Harmuth and G. Xia: Proc. 8th European Continuous Casting Conf., ASMET, Leoben, Austria, (2014), 952.
- 18) Q. Wang, S. Qiu and P. Zhao: Metall. Mater. Trans. B, 43 (2012), 424. https://doi.org/10.1007/s11663-011-9600-8
- 19) M.-S. Kim, S.-W. Lee, J.-W. Cho, M.-S. Park, H.-G. Lee and Y.-B. Kang: Metall. Mater. Trans. B, 44 (2013), 299. https://doi.org/10.1007/s11663-012-9770-z
- 20) Y.-B. Kang, M.-S. Kim, S.-W. Lee, J.-W. Cho, M.-S. Park and H.-G. Lee: Metall. Mater. Trans. B, 44 (2013), 309. https://doi.org/10.1007/s11663-012-9769-5
- 21) J. Rudnizki, R. Shepherd, E. Balichev, A. Karrasch and F. Kruger: Proc. 8th European Continuous Casting Conf., ASMET, Leoben, Austria, (2014), 1013.
- 22) Y. Tsukaguchi, M. Hanao, M. Kawamoto, M. Adachi and H. Hayashi: Tetsu-to-Hagané, 97 (2011), 433 (in Japanese). https://doi.org/10.2355/tetsutohagane.97.433
- 23) V. Kircher, I. Marschall, N. Kölbl and H. Harmuth: Proc. 8th European Continuous Casting Conf., ASMET, Leoben, Austria, (2014), 1050.
- 24) W. Yan, W. Chen, Y. Yang, C. Lippold and A. McLean: ISIJ Int., 55 (2015), 1000. https://doi.org/10.2355/isijinternational.55.1000
- 25) L. Zhou, W. Wang and K. Zhou: Metals, 6 (2016), 139. https://doi.org/10.3390/met6060139
- 26) W. Wang, K. Blazek and A. Cramb: Metall. Mater. Trans. B, 39 (2008), 66. https://doi.org/10.1007/s11663-007-9110-x
- 27) Z. T. Zhang, G. H. Wen, J. L. Liao and S. Sridhar: Steel Res. Int., 81 (2010), 516. https://doi.org/10.1002/srin.201000058
- 28) H. G. Ryu, Z. T. Zhang, J. W. Cho, G. H. Wen and S. Sridhar: ISIJ Int., 50 (2010), 1142. https://doi.org/10.2355/isijinternational.50.1142
- 29) C. B. Shi, M. D. Seo, J. W. Cho and S. H. Kim: Proc. 8th European Continuous Casting Conf., ASMET, Leoben, Austria, (2014), 972.
- 30) L. Zhou, W. Wang and K. Zhou: Metall. Mater. Trans. E, 2 (2015), 99. https://doi.org/10.1007/s40553-015-0047-8
- 31) E. M. Levin, C. R. Robbins and H. F. McMurdie: Phase Diagrams for Ceramists, The American Ceramic Society, Columbus, (1964), 219.
- 32) K. Hayashi, M. Fukui and I. Uei: J. Ceram. Soc. Jpn., 83 (1975), 178 (in Japanese). https://doi.org/10.2109/jcersj1950.83.956_178
- 33) T. Watanabe, H. Fukuyama, M. Susa and K. Nagata: Metall. Mater. Trans. B, 31 (2000), 1273. https://doi.org/10.1007/s11663-000-0015-1


